
1. Introduction
Indonesia's energy requirement increases every year while the domestic production keeps declining. In 2016, Indonesia's fossil fuel consumption was 48.5 million kiloliters and increased to 55.4 million kiloliters in 2017. This value was much higher compared to fossil fuel production in the same year which was only 26.2 million kiloliters [1,2]. The government took an alternative approach by importing fossil fuel to solve this problem. However the depletion of fossil fuel resources, climate change, and sustainability issues are some of the reasons why we need to focus more on renewable energy.
Bioethanol is one of the renewable energy sources that can help us overcome this problem. The utilization of bioethanol as additives for fossil fuel can cut down the need for importing fossil fuel from another country up to 25%. The utilization of corn-based ethanol produced from dry mills can reduce the greenhouse gasses emission from 34% up to 108% [3]. Bioethanol utilization can also increase the gasoline octane number from 88 to 91-95 without the addition of hazardous chemicals such as Tetraethyl Lead (TEL) or Methy-Tert-Butyl Ether (MTBE) [4].
The first generation of bioethanol is produced from corn or sugarcane. It has demonstrated several sustainability issues [5]. The second generation bioethanol is also known as lignocellulosic bioethanol. Lignocellulose, as the major component of the plant cell
wall, is a carbon source that is abundantly available thus ensures the availability of bioethanol raw material supply. Lignocellulosic biomass comprises hemicellulose, and lignin [6]. Cellulose and hemicellulose are polymers from simple sugars, such as hexose and pentose, which is used as the substrate for hydrolytic enzyme production and bioethanol fermentation process while lignin is the component that can inhibit the process [7]. Napier grass (Pennisetum purpureum S.) is one of the perennial grasses that has a great potential to be the raw material for bioethanol production. Napier grass has a high cellulose content (around 30-37%) and low lignin content (8-21%) [8]. Its annual productivity is also high and can reaach up to 78 tons dry weight [9]. It has an efficient photosynthetic activity and water consumption, which makes this grass does not need any intensive care or special treatments [10]. These are the reasons Napier grass is a perfect candidate to be cultivated as an energy crop.
Bioconversion process of cellulose and hemicellulose to produce bioethanol comprises of two major steps, which are the hydrolysis of cellulose and hemicellulose into simple sugars and the fermentation process of the simple sugars into bioethanol. Various ways have been tried to increase the efficiency of bioethanol production. One of the methods is integrating the saccharification and fermentation process into one single process, called simultaneous saccharification and fermentation (SSF). This process can increase the efficiency of bioethanol production by reducing the product inhibition effect and reducing the number of reactors needed so it will reduce the investment cost for large scale production [11]. Neurospora sitophila is a mesophilic mold that can secrete cellulase and hemicellulase with an immense enzyme activity and simultaneously converting sugars produced by the saccharification process into bioethanol on micro-aerobic condition [12].
Mold naturally lives in a humid environment with the surrounding moisture content less than 100% [13]. Large scale ethanol fermentation system usually uses the submerged fermentation system despite the natural habitat of the mold. The solid-state fermentation process has no flowing water in the system, thus offers a living condition that is more favorable for Neurospora sitophila. The solid-state fermentation to produce enzymes and bioethanol using mold as the bioconversion agent hopefully will increase product yield. The addition of soybean curd residue was intended to increase the nitrogen and sugar content of the fermentation substrate. Soybean residue has 17-18 kinds of amino acids that can support the growth of the Neurospora sitophila [14]. Besides nitrogen, carbohydrates, and amino acids, soybean curd residue also has a huge amount of micronutrients that are important for the growth of the mold. The addition of soybean curd residue has been proven to increase the activity of cellulase enzyme produced by Neurospora siophila with paddy stalk as the substrate [15]. We expect that the combination of Napier grass and soybean curd residue and the utilization of simultaneous saccharification and fermentation in a solid-state culture can increase the enzyme activity as well as the bioethanol production by Neurospora sitophila.
2. Materials and Methods
2.1. Microorganism
Microorganism used in this experiment was Neurospora sitophila which was obtained from the Microbiology Laboratory Culture Collection, School of Life Sciences and Technology, Bandung Institute of Technology. Neurospora sitophila was cultured on a potato dextrose agar slant and subcultured every two weeks. Culture stock was stored on the refrigerator at 4°C.
2.2. Viability Curve Analysis of Neurospora sitophila
Fungal spore viability analysis was conducted using the Total Plate Count method [16]. Spores attached on agar slant were diluted into particular concentrations (10<sup>-1</sup>, 10<sup>-2</sup>, and 10<sup>-3</sup> more dilute than the original stock solution) and were counted using a hemocytometer under a light microscope. All of the diluted spores were cultivated on the PDA on Petri dishes and incubated on room temperature for several days. The colony-forming unit was calculated using equation (1).
\[\frac{CFU}{ml} = \frac{(A \times 10^{-1}) + (B \times 10^{-2}) + (C \times 10^{-3})}{3}\] (1)
notes:
\(A = Colony number on 10^{-1} dilution solution\)
B = Colony number on \(10^{-2}\) dilution solution
\(C = Colony number on 10^{-3} dilution solution\)
2.3. Napier Grass and Soybean Curd Residue
The vegetative part of Napier grass was collected from CV Bintang Tani Bogor, West Java and then cultivated inside the screen house located on Bandung Institute of Technology, Jatinangor, West Java. Cultivation was done for 3 months and the Napier grass was harvested and later dried to be processed further. Additional substrate, the soybean curd residue, was collected from Mr. Cikeruh tofu production plant in Jatinangor, Sumedang, West Java.
2.4. Napier Grass and Soybean Curd Residue Preparation
Three-month old Napier grass was cleaned with flowing tap water and dried with shade drying method on room
temperature for three days. The moisture content of the dried grass was below 10% (w/w). The dried grass was chopped with blender and passed up through mesh with 0.500 mm and 0.125 mm sieve opening so the particle size of the substrate would be between 0.500 mm and 0.125 mm.
The Soybean curd residue (SCR) was cleaned and dried using an oven on 50o C. The SCR was dried until the moisture content reached 10%. The SCR was then chopped with a blender and sieved through the sieves with 0.500 mm and 0.125 mm opening. The SCR powder was stored inside an airtight container to be processed further.
2.5. Lignocellulosic Compound Analysis
Lignocellulosic compound on the mixed substrate was analyzed using Chesson-Datta fractioning method [17]. The lignocellulosic content on the substrate can be determined using equations (2) to (6).
Hot water soluble = \[\frac{A-B}{A} \times 100\%\] (2)
\[Hemicellulose = \frac{B-C}{A} \times 100\%\] (3)
\[Cellulose = \frac{C - D}{A} \times 100\% \tag{4}\]
\[Lignin = \frac{D - E}{A} x \ 100\% \tag{5}\]
\[Ash = \frac{E}{A} \times 100\% \tag{6}\]
Notes:
A = initial mass sample (g)
B = Residual mass after water extraction (g)
C= Residual mass after H2SO4 extraction (g)
D= Residual mass after H2SO4 72% extraction (g)
E= Residual mass after ashing (g)
2.6. Total Kjeldahl Nitrogen Analysis
Total nitrogen from the substrates that will be used for the experiment was analyzed using total Kjeldahl method [18]. Nitrogen percentage was calculated using the equation (7).
\[\% Nitrogen = \frac{(ml \ acid \ standard - ml \ blank) \times N \ from \ acid \times 1,4007}{dry \ weight \ of \ sample} (7)\]
2.7. Aerobic Cultivation of Neurospora sitophila and Bioethanol Production
The solid-state fermentation process was done in two steps as described by Rao et al. in 1983 and Dogaris et al. in 2009 [12,19]. This process was carried out in 250 ml Erlenmeyer flasks with 25% of working volume consisting of the substrate and 75% was the headspace. On the first step, about three grams of mixed substrate were pasteurized using a water bath on 80o C for one hour and were replicated three times. After the sterilization, the moisture content of the substrate was adjusted using glucose (5 g/L), yeast extract (6.4 g/L), and Neurospora minimal medium with the concentration of every component as follow:
KH2PO4 1g/L; NH4NO3 1g/L; MgSO4.7H2O 0.5 g/L; CaCl2 0.1 g/L; NaCl 0.1 g/L; ZnCl2 2 mg/L; FeCl3 0.3 mg/L; CuCl2 0.1 mg/L; NaMoO4.2H2O 0.02 mg/L; MnCl2 0.02 mg/L; and H3BO3 0.01 mg/L
The fermentation medium was added until the moisture content of the substrate reached 70-80%. One ml of heavy spore suspension of Neurospora sitophila (approximately 107 spores/ml) was inoculated into the substrate. The sample was incubated on 33o C for 6 days. The substrate combination is listed in Table 1.
Table. 1 The mass ratio of Napier grass to Soybean Curd Residue used in this research
| Napier grass (g) | SCR (g) | Ratio |
|---|---|---|
| 3 | 0 | 3:0 |
| 1.5 | 1.5 | 1:1 |
| 2.7 | 0.3 | 9:1 |
The cellulose enzyme activity was analyzed every day for six days. After the highest enzyme activity of the aerobic process was determined, the process was conducted all over again from the beginning and after two days, the system would be switched from aerobic condition to a micro-aerobic condition.
2.8. Enzyme Extraction
Fermentation substrate was harvested, weighed, and extracted using the method stated by Dogaris et al. [12]. Substrate was weighed using an analytical mass balance, and after the addition of the 50mM buffer solution, samples were incubated using an orbital incubator shaker (the incubator operated at 250 RPM and 28o C for 60 minutes) and followed by the separation of the enzyme from the substrate using a filter cloth and a micro-centrifuge at 4o C and 12000g. After that, samples were stored in the refrigerator at 4o C before use.
2.9. Enzyme Activity Analysis (FPA Method)
Cellulase enzyme activity was analyzed using the Filter Paper Assay (FPA) Method [20]. Samples were diluted and calculated using the equation (8). Dilution from the sample had to be made if the reducing sugar detected was above 2 mg glucose equivalent/ml. Dilution was made until the concentration of the reducing sugar detected was around 2 mg glucose equivalent/ml. The enzyme concentration that is needed to release 2 mg of glucose was added to the equation (8).
\[FPU = \frac{0.37}{[enzyme]needed to release 2 mg of glucose} unit/ml\] (8)
Absorbance was calculated using pure glucose as the standard. Standard curve was made using 10, 3.35, 2.5,1.65, and 1 mg glucose/0.5 ml. Filter paper used was the
Whatman® ashless filter paper no. 1, while the reagents used were Rochelle salt (10%) and DNS reagent.
2.10. Reducing Sugar Analysis
Reducing sugar analysis was conducted using Dinitrosalicyclic Acid (DNS) method [21]. The reducing sugar was calculated as glucose equivalent with pure glucose as the reference standard. The concentration of glucose standard solutions used was as follow: 10, 3.35, 2.5, 1.65, and 1 mg glucose/0.5 ml.
2.11. Bioethanol Concentration Analysis
Ethanol was extracted from the fermentation substrate using distillation method as stated by Devrajan [22]. Substrate that had been fermented was mixed with hot water (50o C) in a 1:1 mass ratio. The mixture of sample and water was incubated for 30 minutes in a static condition. Sample then was distilled, along with the distillate, was collected to be analyzed further.
The ethanol concentration was measured using the spectrophotometer method as describe by Crowell and Ough [23]. Around 30-35 ml distillate was mixed with 10 ml of dichromate reagent (34 g of potassium dichromate mixed with 325 concentrated sulphuric acid) and incubated at 60o C for 20 minutes. After 20 minutes, the sample was cooled down to room temperature, and the absorbance was measured using UV-VIS spectrophotometer on 600 nm wavelength. Alcohol detected was a 10 times dilution of the original sample.
\[Yse = \frac{Ef - Ei}{Sf - Si}x \ 100\% \tag{9}\]
Ef= Ethanol final weight (g)
Ei= Ethanol initial weight (g)
Sf= Substrate final weight (g)
Si = Substrate initial weight (g)
3. Results and discussion
3.1. Lignocellulose Composition of Napier Grass
Napier grass used in this research was a three-month old crop. Energy content form the three-month old Napier grass was the highest compared to the older or younger age Napier grass [24]. The comparison of lignocellulosic compounds compared to other studies can be seen in Table 2.
3.2. The Effect of Aerobic Cultivation Period on Cellulase Enzyme Activity
Cellulase enzyme activity was measured using the Filter Paper Assay (FPA) method. ANOVA analysis did not show any significant difference in enzyme activity from different substrate combinations, but the difference in cellulose reduction was up to 27% from the control. The cellulase activity profile for different substrate combinations is presented in Figure 1.
The control substrate gave the lowest cellulose reduction compared to substrate AT1 and AT2. Control substrate had a 45% cellulose reduction while AT1 and AT2 substrate reached 55.47% and 71.72% respectively. High cellulose reduction for substrate AT2 showed that the cellulose enzyme secreted by Neurospora sitophila on AT2 substrate was better at hydrolyzing cellulose compared to the other substrate combinations. Better mold growth perhaps is one of the reasons why the enzyme activity on AT2 substrate was better than the other two substrate combinations. Protein analysis from the three substrate combinations showed that the AT2 substrate has the highest protein enhancement compared to the other substrates. The measurement of total crude protein is one of the indirect method for measuring fungal growth on a solid substrate [30,31]. Protein enrichment profile can be seen in Figure 2 and the fungal growth on the second days of aerobic cultivation can be seen in Figure 3 (a)-(c).
High fungal growth on the AT2 substrate could be caused by the high initial nitrogen and extractives content of the substrates. From the lignocellulosic analysis, AT2 has the highest extractives content, approximately 25% weight, while the AT1 and control substrate has 23% and 16% respectively. The extractives content is usually comprised of pectin and other soluble oligosaccharides [17]. Soluble oligosaccharide can be used as an additional nutrition for the mold on the early stage of its growth. These soluble simple sugars can enhance the growth of the fungi. The composition of the lignocellulosic biomass of each substrate can be seen in Figure 4.
Soybean Curd Residue (SCR) contains micronutrients, for example potassium, sodium, calcium, magnesium, iron, copper, manganese, and zinc, which are needed by the Neurospora. Calcium is known to be beneficial for Neurospora hyphal growth. Schmid and Harold's (1988) experiment proved the importance of calcium ion for Neurospora hyphal growth. The growth of Neurospora and its hyphae is higher as the concentration of calcium ion increases [32]. External calcium ion was needed to balance the calcium ion inside the cell whereas the internal calcium ion is very important for hyphal growth [33].
Table 2 Lignocellulosic fraction comparison
| Research | Hot water | Hemicellulose | cellulose | Lignin (%) | ash (%) | others (%) |
|---|
| soluble content (%) | (%) | (%) | ||||
|---|---|---|---|---|---|---|
| This research | 16.1 ± 5.8 | 33.78± 1.6 | 40.35 ± 6.7 | 8.64 ± 2.4 | 1.1 ± 0.2 | - |
| Yasuda et al., 2013 [25] | - | 26.50 | 37.50 | 14.90 | 12.70 | 15.10 |
| Montipo et al., 2018 [26] | 16.43 | 20.62 | 33.60 | 18.42 | 12.25 | 0.99 |
| Sladen et al., 1991[8] | - | 20-31 | 30-37 | 8-21 | - | - |
| Kataria et al., 2016 [27] | - | 28.44 | 38.98 | 19.26 | 2.17 | 11.15 |
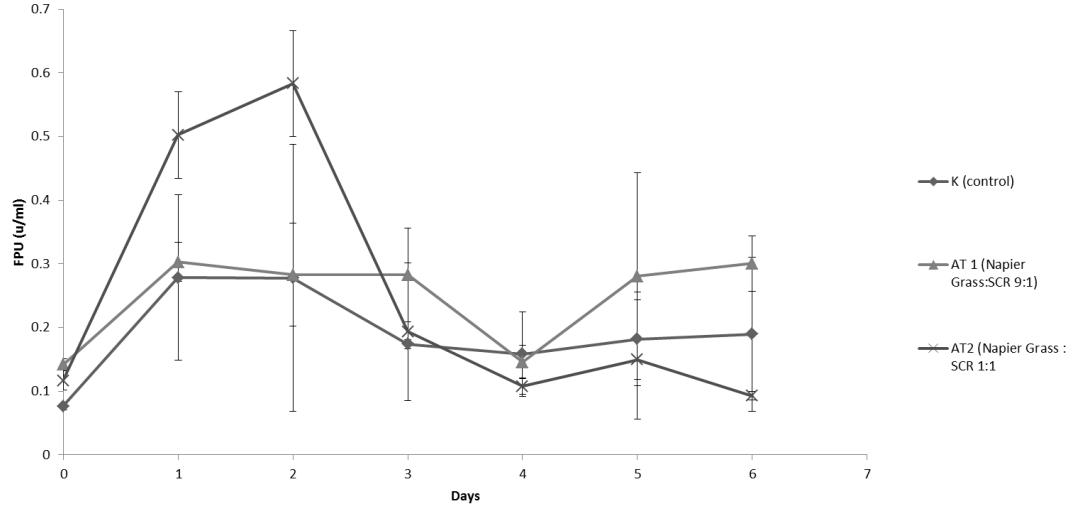
Figure 1 Enzyme activity profile for each substrate combination
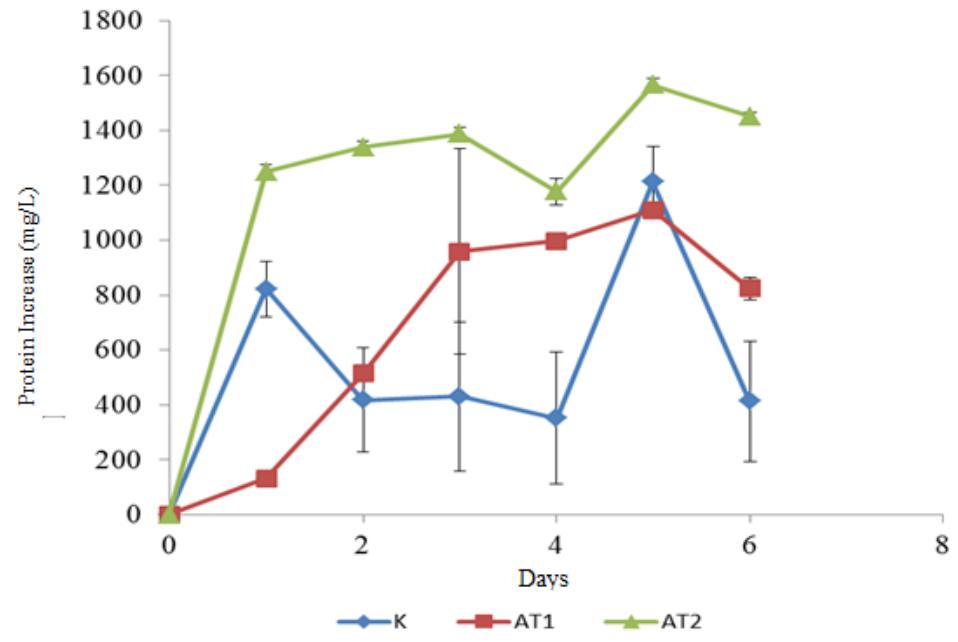
Figure 2 The increase of total protein content for each substrate combination
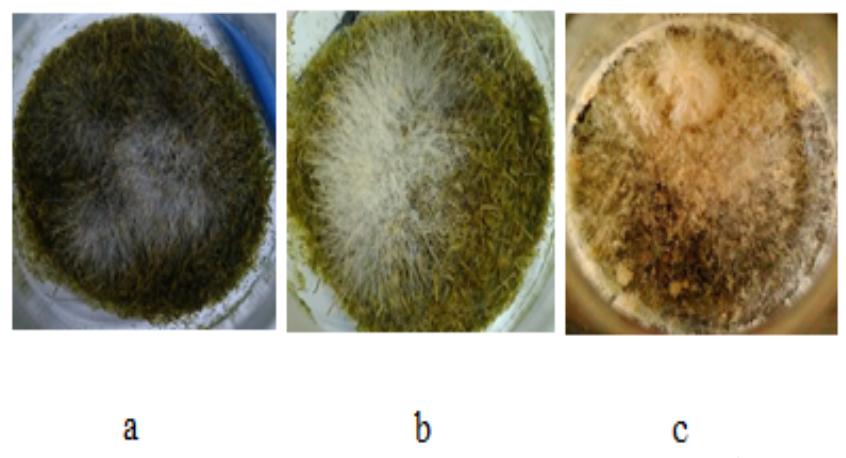
Figure 3 The growth of Neurospora sitophila on each substrate combination on the 2nd day of aerobic cultivation period (a) Control, (b) AT1, (c) AT2
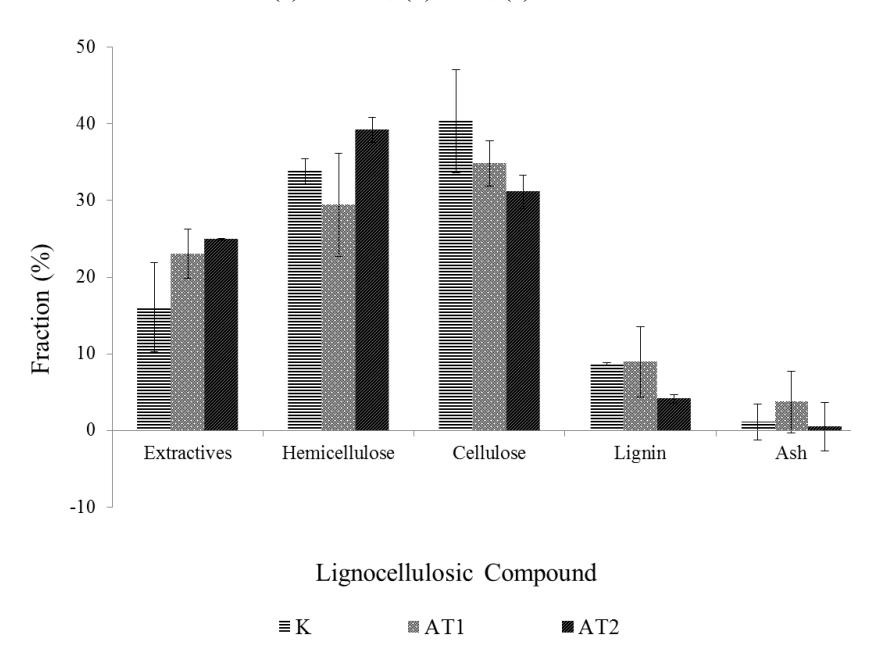
Figure 4 Lignocellulose fraction of fermentation substrate at the initial stage of cultivation
Neurospora sitophila has been known to be able to produce cellulase enzymes when cultivated in the submerged system as well as in the solid-state system [12,34,35]. According to Oguntimein et al. in 1991, cultivation of Neurospora sitophila in a submerged fermentation system can produce cellulase enzymes with the highest activity reached 0.18 FPU after 48 hours with a corn cob as the substrate [34]. Cellulase enzyme activity achieved on this research was higher compared to the study conducted by Oguntimein and his team. This comparison showed that solid-state fermentation system can produce a higher enzyme activity compared to the submerged system. This hypothesis was also proved by the study conducted by Kantini and Sudiana in 2018 [15]. Their research showed that cellulase enzyme produced by Neurospora sitophila on a solid state
culture was given a better result compared to the Neurospora that was cultivated on a free -flowing medium.
One of the most possible reasons that the enzyme activity produced by Neurospora was better when it was cultivated on a solid substrate is because of the natural living conditions of the mold. Mold that was cultivated by submersion will have different physiological activities compared to the fungi that was cultivated on a solid substrate [14]. The use of solidstate fermentation system was intended to mimic the natural habitat of fungi, hence it can enhance its physiological activities relative to the submerged fermentation system [36]. Li and his team conducted a study in 2013 about the characteristic of the protein secreted by Neurospora on both solid-state and submerged fermentation system. On a submerged fermentation system, the protein analysis and characterization showed a large portion of proteins related to the fight and stress response of the fungi, while the protein profile for solid-state fermentation system was dominated by protein for growth [35].
Cellulase enzyme activity obtained from this study was higher compared to the study conducted by Li and his team. Neurospora cultivated on wheat stalks with a steam explosion as the pre-treatment gave cellulase enzyme activity of 0.45 U/gram substrate. Meanwhile, in this study, the highest FPAse achieved was 1.8 U/gram substrate from AT2 substrate combination (without a pretreatment before the fermentation process). The higher cellulase activity means that Napier grass is a better substrate compared to wheat stalks for cellulase production.
3.3. The Effect of Fermentation Period and Napier Grass-SCR Ratio on the Ethanol Yield
The highest ethanol yield from this study came from the AT2 sample (Napier grass : SCR mass ratio of 9:1). The ethanol yield from the AT2 sample was 2.12 g Ethanol/100 g substrate consumed. Ethanol yield from AT2 substrate and control substrate were 0.71 g ethanol/100 g substrate consumed and 1.09 g ethanol/g substrate consumed respectively. The comparison can be seen in Table 3.
Table. 3 Ethanol yield from each substrate combination
| Substrate Combination | Ethanol Yield (g EtOH/100 g substrate) | Optimum Fermentati on Period (days) |
|---|---|---|
| Control (K) | 1.09 | 2 |
| Napier Grass : SCR | 2.12 | 6 |
| = 9:1 (AT1) | ||
| Napier Grass : SCR | 0.71 | 3 |
| =1:1 (AT2) |
From the data, it can be seen that the ethanol yield from the AT1 substrates was higher compared to the other substrates. It is assumed that there is a lower cellulose fraction of the AT2 substrate compared to the AT1 substrate. However, the cellulose fraction itself was probably not the only factor affecting the ethanol production. The ethanol yield from the control substrate was also lower than the AT1 substrate, despite its higher cellulose content. The better growth profile of Neurospora sitophila on the AT1 substrate was probably the main reason why the ethanol production from the AT1 substrate was higher than the control substrate.
From this study, it was found that the maximum ethanol concentration was achieved on the sixth day of the microaerobic cultivation period which was 1.874 g/L from the AT1 substrate. The AT2 substrate produces 0.811 g/L ethanol that was achieved on the fifth day of fermentation period. Meanwhile the control substrate achieved the highest ethanol concentration of 0.641 g/L on the 7th day of the fermentation period. From ANOVA test, it could be concluded that the difference of the ethanol concentration was significantly different for each substrate variation. The ethanol concentration profile was showed in Figure 5.
Despite the high cellulase activity secreted by Neurospora in this study, ethanol production was very low compared to other studies. Theoretical ethanol yield from this SSF process was calculated using the formula as shown in Table 4 and the calculation for the three types of substrate combinations compared to the experiment based value is shown in Table 5. This formula and its conversion efficiencies were adapted from Badger [7].
The experimental based yield was approximately 10 times lower compared to the expected theoretical yield. The low ethanol yield was probably due to the excessive oxygen that was still present in the micro-aerobic process. In this study, the oxygen absorber used was an iron powder combined with NaCl salt that was sold commercially. The oxygen absorber can absorb around 30 ml of O2. Using an assumption that the volume of the reactor used was 250 ml and the concentration of O2 inside the reactor was the same as the concentration of O2 in the normal air in the atmosphere, the volume of the oxygen in the headspace of 250 ml reactor was 50.4 ml. This calculation showed that there was still too much oxygen inside the reactor. The presence of oxygen inside the reactor made the fermentation process became ineffective. In a condition where the amount of oxygen is high, the dominant reaction will be the respiration pathway where the pyruvic acid will go into the tricarboxylic acid cycle and go through the electron transport chain reaction, thus resulting in ATP formation and carbon dioxide [33]. Purging the oxygen with nitrogen gas could result in a higher yield of ethanol [34].
During the fermentation process, it could be seen that the glucose concentration has never had any significant upsurge. This is due to the low glucose content on the first day of the micro-aerobic condition. When the cellulase enzyme hydrolyzed the cellulose, it produced reducing sugar which is simultaneously consumed by the fungi to generate biomass, ethanol, and other products. When the reducing sugar on the substrate is very low while the ethanol concentration is high, there will be a probability of alcohol dehydrogenase enzyme repression to occur and other enzymes that play role in glyoxylate cycle will be produced, thus resulting in ethanol consumption as a carbon source for the fungi via gluconeogenesis [35]. Glucose profile for each substrate combination is shown in Figure 6 and the change in the lignocellulose compound during the fermentation process is shown in Figure 7.
From Figure 7 (a)-(c), it can be seen that there were reductions both in cellulose fraction and hemicellulose fraction. This proved that Neurospora sitophila can produce both cellulase and hemicellulase enzymes. This conclusion was supported by the study conducted by Li and his team on 2013 about the characterization of protein secreted by Neurospora, in which they also found out that Neurospora can secrete proteins that have similar amino acid sequences as the protein that encodes hemicellulose enzyme such as endo-1,4-ß-xylanase GH10-2 and ß-xylosidase GH3-8 [14].
Neurospora also has xylitol dehydrogenase enzyme that is a catalyst for the fungal cells to produce xylose derivate such as xylitol [37].
Table 4 Theoretical Ethanol Yield Formula
.
| Parameters | Source of Carbohydrate | |||
|---|---|---|---|---|
| Hemicellulose | Cellulose | |||
| Dried Napier grass (gram) (DM) | 3 | 3 | ||
| Mass fraction (a) | % hemicellulose x DM | % cellulose x DM | ||
| Enzymatic conversion efficiency (b) | 0.9 | |||
| Ethanol Stoichiometric yield (c) | 0.51 | |||
| Fermentation efficiency (d) | 0.50 | |||
| Ethanol yield (gram) | (a x b x c x d)/100 (P1) | (a x b x c x d)/100 (P2) | ||
| Total ethanol yield ( gram/100 gram substrate) | P1+P2 | |||
Table 5 Theoretical and Experiment Based Ethanol Yield for All Substrate Combinations
| Ethanol Yield (g ethanol/ 100 g substrate) | |||
|---|---|---|---|
| Substrate Variation | Theoretical | Experiment Based | |
| Control (K) | 19.48 | 1.09 | |
| AT1 | 16.55 | 2.12 | |
| AT2 | 18.56 | 0.71 | |
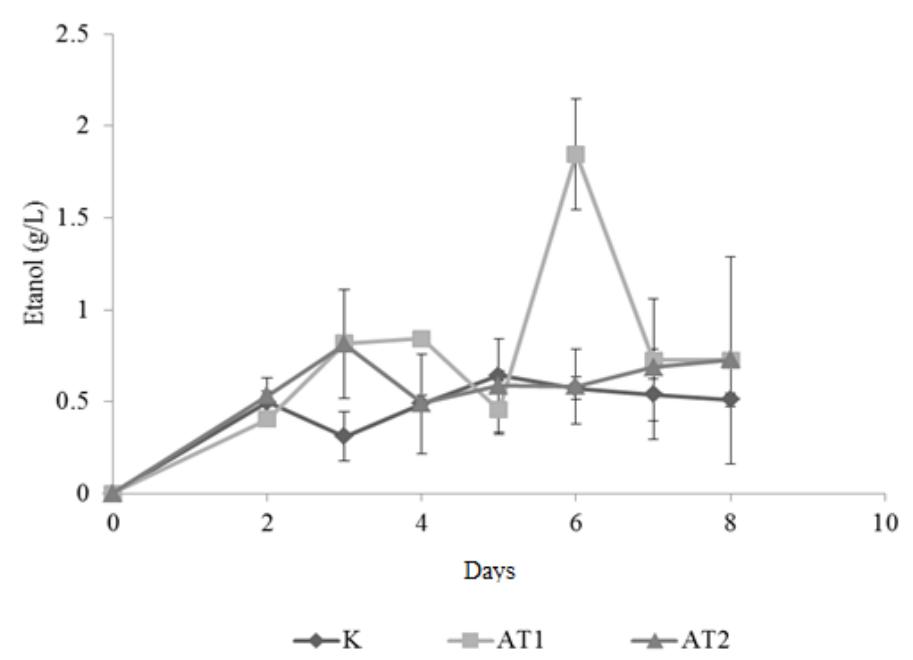
Figure 5 Ethanol Concentration Profile for Each Substrate Combination
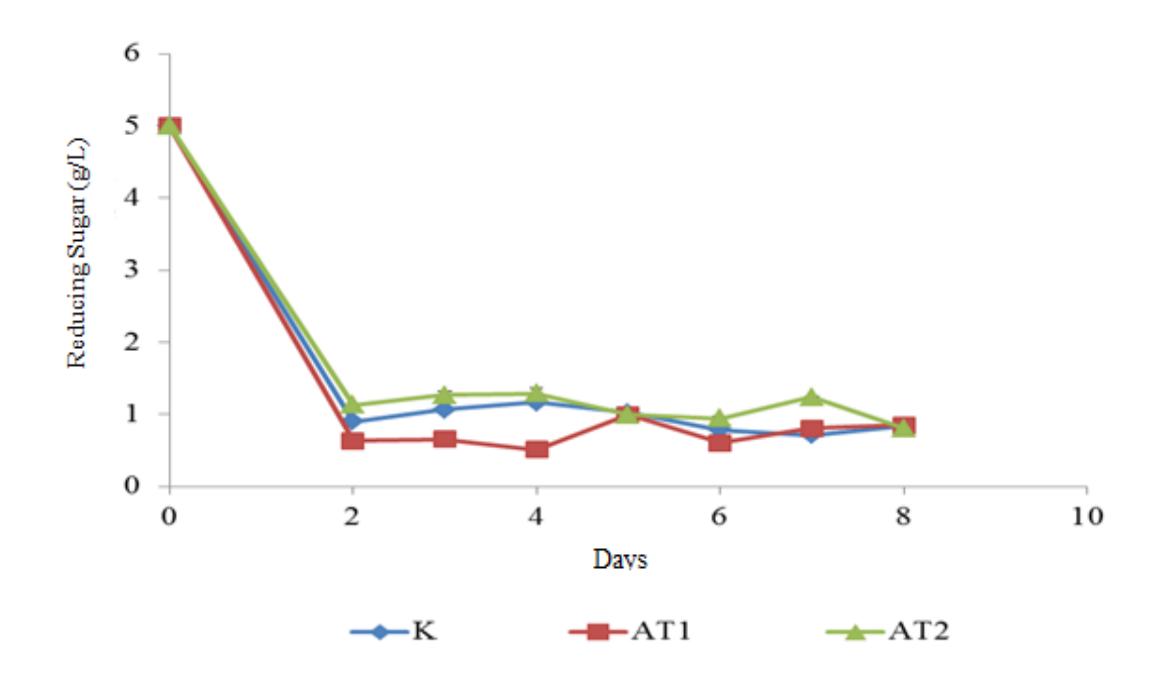
Figure 6 Glucose Reduction Profile for Each Substrate Combination
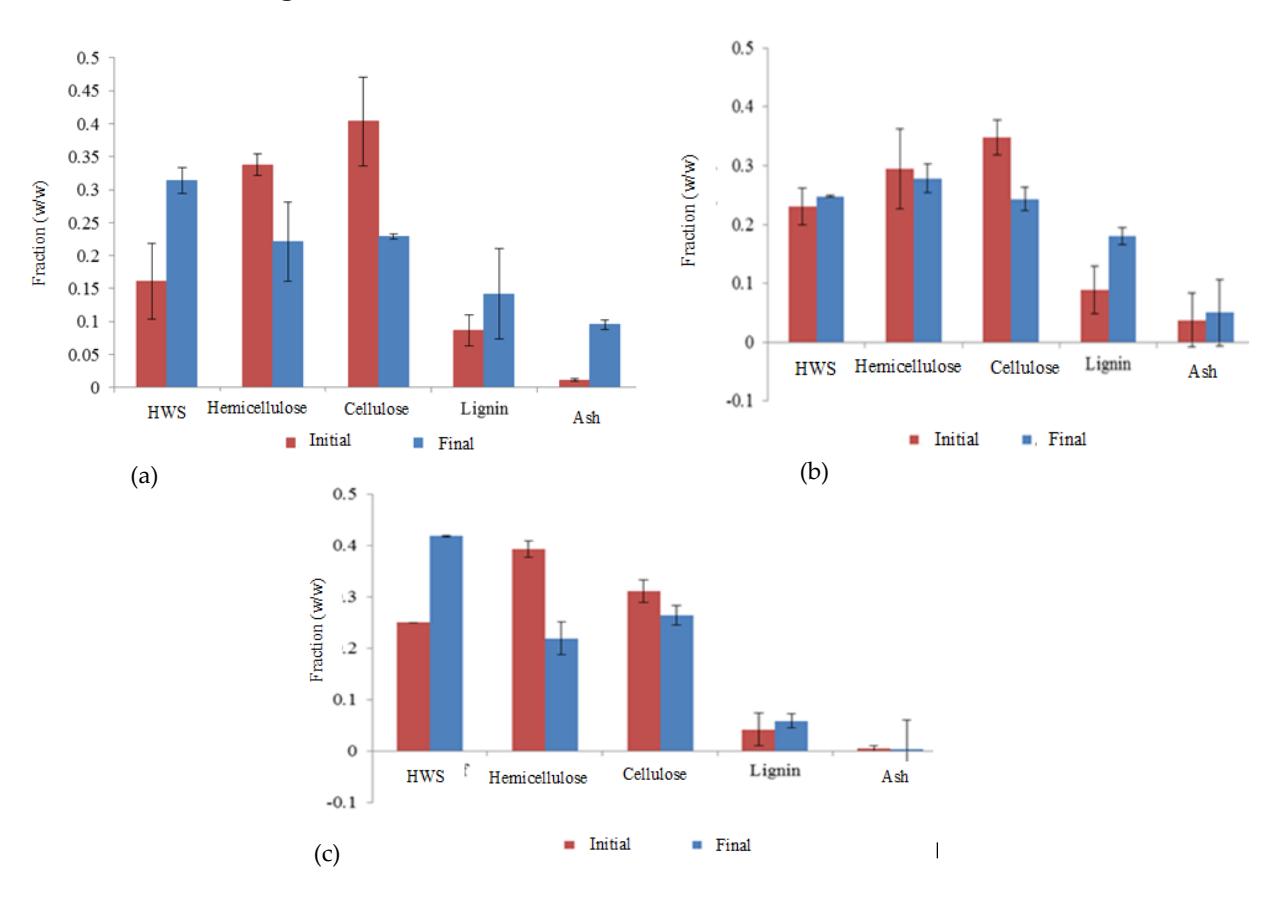
Figure 7 Hemicellulose reduction on the initial and final period of fermentation period (a) Control Substrate (b) AT1 (c) AT2
The extractives and lignin content from the substrate that had been fermented increased for every substrate combination. The ash content also increased for the control substrate. Napier grass has various compounds that were water soluble aside from free reducing sugar. Two of them were catechin and tannins. Catechin content inside Napier grass can be as high as 6 mg/g dry basis [38]. These compounds were stored inside a vacuole [39]. If the cellulose and hemicellulose content of the plant cell wall was reduced, these water soluble compounds could easily be washed out from the vacuole thus resulting in a higher fraction of hot water soluble content.
The increase of lignin fraction that oddly happened does not mean that the lignin compound of the substrate was increasing. The increase of lignin fraction on the substrate was suspected due to the decrease of other components fraction, whereby the lignin fraction will be higher because the fungi cannot consume it or it can be assumed that the lignin mass did not change.
4. Conclusions
In conclusion, Napier grass and simultaneous saccharification and fermentation method has a potential for cellulase and bioethanol production. The optimum aerobic cultivation period that gives the maximum cellulase enzyme activity was two days on the AT2 substrate. The optimum micro-aerobic cultivation period that gives the maximum ethanol yield was 6 days on the AT1 substrate combination. However, the bioethanol yields were still very low compared to the theoretical yields and other studies, thus further improvement on the micro-aerobic system is needed to increase the bioethanol yield.
Acknowledgment
We thank ITB for supporting this research through the P3MI project.