
1. Introduction
Herbicide is one type of pesticide that is used to eliminate or inhibit the growth of unwanted plants that are commonly known as weed. Herbicide changes the influence of chemicals in weed tissues, which can destroy the said tissues or damage the physiological system needed for life or growth. When processes of respiration, photosynthesis, cell division, and elongation of cells are disturbed, weeds will deplete energy reserves [1].
Paraquat dichloride is a bipyridylium herbicide group, which is also known by the name 1,1'-dimethyl-4,4' bipyridinium dichloride or N, N'-dimethyl-4,4'-bipyridinium dichloride [2]. Paraquat dichloride has an empirical formula of C12H14N2Cl2, and is commonly used as an herbicide to control weed growth in agricultural and plantation areas in various regions in Indonesia. Paraquat dichloride is very soluble in water and is a contact herbicide that works in the leaves, particularly in the chloroplasts. Paraquat absorbed by plants will inhibit photosynthesis, more specifically the photosystem I, which causes the formation of reactive oxygen species (ROS) such as superoxide radicals (O2- ) or peroxide acid (H2O2), which will then attack cell membranes [2]. Oxidative lipid degradation (lipid peroxidation) is one of the parameters of damage caused by an increase in the number of ROS. This lipid degradation occurs as a result of the reaction process between unsaturated fatty acids in cell membranes and ROS to form lipid hydroperoxide (lipid hydroperoxides) [2]. The accumulation of lipid hydroperoxide in the membrane can disrupt the function of cell membranes, resulting in a loss of cell permeability and the occurrence of leakage [3].
A large amount of herbicide use in agriculture has been known to potentially cause agricultural land and water pollution [4, 5] and pose a threat to the health of animals [6, 7] and humans [8]. In non-target insects, Cousins et al. [9] reported the decreasing size of oenocytes of honeybee larvae after being exposed to very small concentrations of paraquat. Studies related to insect physiology also show that paraquat can decrease the number of the emergence of adult insects and compromise the ovipositioning ability of a parasitoid wasp, Diaeretiella rapae [10]. More than 95% of herbicide use is exposed to water, plants and non-target organisms such as soil arthropods [11]. Soil arthropods are particularly important in the process of breaking down organic matter, mineralizing plant nutrients, increasing soil aggregation, changing soil physical properties, stimulating succession, controlling pests and as indicators of pollution [12].
The impact of herbicide application on biodiversity and abundance of soil arthropods is pertinent, since it will compromise the sustainability of the ecosystem. A recent study related to that of ours was carried out in oil palm plantation [13], whereas in this study, the effect of the application of paraquat dichloride on the diversity and abundance of soil arthropods was carried out in a corn field.
2. Methodology
This research was conducted at the ITB Research Garden, Haurgombong Village, Sumedang as well as the Entomology Laboratory of SITH ITB from July to December 2018. Since the recommended concentration of paraquat dichloride was 4mL/L and a certain degree of error in applying this usually occurred among farmers, we experimented on a variety of paraquat dichloride concentrations, i.e. 0 mL/L (control), 3.33 mL/L, 4 mL/L, 4.66 mL/L, and 5.33 m/L. Each of the concentrations was applied on the sample plots within 35 days after planting. The size of the sampling plot was 5 m x 4.5 m and each treatment was applied in five plots. Sampling was carried out four times, namely at T0 (initial conditions prior to tillage), T1 (after tillage), T2 (after pesticide spraying), and T3 (before harvest).
A sampling of soil arthropods was made using a modified pitfall trap method [14], by installing a plastic cup containing detergent solution in the soil with the top opened and placing the cup in such a way that its top edge aligned with the surface of the soil. Each plot consists of three pitfall traps. Traps were set for 24 hours. Trapped arthropods were transferred into a plastic bag containing 70% of alcohol solution.
The identification of arthropods was carried out to the family level, using a stereo microscope and McGavin's arthropod identification book [15]. The data obtained were then analyzed by determining the Shanon-Wiener diversity index (H'), Simpson dominance index (D), and Sorensen (S) similarity index using the following formula:
Shannon Index (H') = \[-\Sigma p_i (\ln p_i), p_i = \frac{ni}{N}\] (1)
Simpson Index (D) = \[\Sigma\] \(\frac{n_i (n_i-1)}{N (N-1)}\) (2)
Simpson Diversity Index = 1−D (Simpson's reciprocal index =$ % ) (3)
Sorenson Index: \[C = \frac{2j}{(a+b)}\] (4)
Index:
pi = proportion of individual species i
ni = number of individual species i
N = total number of individuals a = number of individuals at location A b = number of individuals at location B
j = number of individuals at locations A and B
3. Results and discussion
3.1. Population dynamics of soil arthropods
Formicidae was the predominant group in the area for all sampling times, with the number of individuals reaching an order of hundreds (Table 1). Different result was reported in oil palm plantation with Formicidae being the dominant group only at week-0 and 4, whereas the Acarine was mostly found at week-2 and 8 [13]. Other families of soil arthropods showed a low number of individuals, most probably due to dry conditions. The event of rainfall at T3 significantly increased the number of individuals of almost all families, especially Gryllidae, Araneidae, Pyrrhocoridae and Tenebrionidae. The application of paraquat dichloride did not give any significant effect on the number of individuals of the arthropods, as shown in Table 1.
3.1.1. Number of individuals
Total number of individuals of soil arthropods fluctuated from T0 to T3, without any specific trend. The highest number of individuals was found at T2 sampling, which is after an herbicide application using 4.66 mL/L of paraquat dichloride. This shows that paraquat dichloride did not have a significant effect on the individual number of soil arthropods (see Figure 1).
3.1.2. Species richness
A comparison of the richness of soil arthropod species at T0, T1, T2, and T3 is listed in Figure 2. The richest species of soil arthropods are found at the time of T3 (before harvest). Species richness shows the diversity of soil arthropods, which may be related to the health of the soil ecosystem. Species richness is among the factors that influence species diversity. After tillage (T1), species richness of soil arthropods decreased in all treatment groups (Figure 2). This might occur since the soil was dried out without any standing crops left at the time of tillage, resulting in a disturbed habitat and decreasing soil arthropod richness [13,16].
Table 1 Soil Arthropod Families Population Dynamics at T0, T1, T2 and T3
| Arthropod families | Number of individuals | |||||
|---|---|---|---|---|---|---|
| T0 | T1 | T2 | T3 | |||
| 1. | Acrididae | 9 | 6 | 7 | 16 | |
| 2. | Alydidae | 2 | 0 | 0 | 0 | |
| 3. | Araneidae | 16 | 3 | 2 | 36 | |
| 4. | Blatellidae | 2 | 0 | 0 | 0 | |
| 5. | Carabidae | 2 | 0 | 0 | 4 | |
| 6. | Cicadidae | 10 | 1 | 2 | 7 | |
| 7. | Chrysomelidae | 1 | 0 | 0 | 5 | |
| 8. | Clubionidae | 0 | 0 | 4 | 14 | |
| 9. | Forficuldae | 0 | 0 | 0 | 4 | |
| 10. | Formicidae | 279 | 260 | 412 | 178 | |
| 11. | Gryllidae | 10 | 3 | 7 | 92 | |
| 12. | Hesperiidae | 0 | 3 | 2 | 0 | |
| 13. | Ichneumonidae | 0 | 0 | 3 | 0 | |
| 14. | Libellulidae | 0 | 0 | 0 | 2 | |
| 15. | Muscidae | 1 | 1 | 0 | 3 | |
| 16. | Mycetophilidae | 0 | 1 | 4 | 3 | |
| 17. | Pentatomidae | 1 | 0 | 0 | 9 | |
| 18. | Pyrgomorphidae | 0 | 0 | 3 | 0 | |
| 19. | Pyrrhocoridae | 0 | 1 | 1 | 36 | |
| 20. | Rhinotermitidae | 0 | 0 | 0 | 1 | |
| 21. | Scarabaeidae | 0 | 0 | 0 | 1 | |
| 22. | Syrphidae | 0 | 3 | 3 | 3 | |
| 23. | Tenebrionidae | 15 | 3 | 6 | 24 | |
| 24. | Vespidae | 2 | 1 | 1 | 1 | |
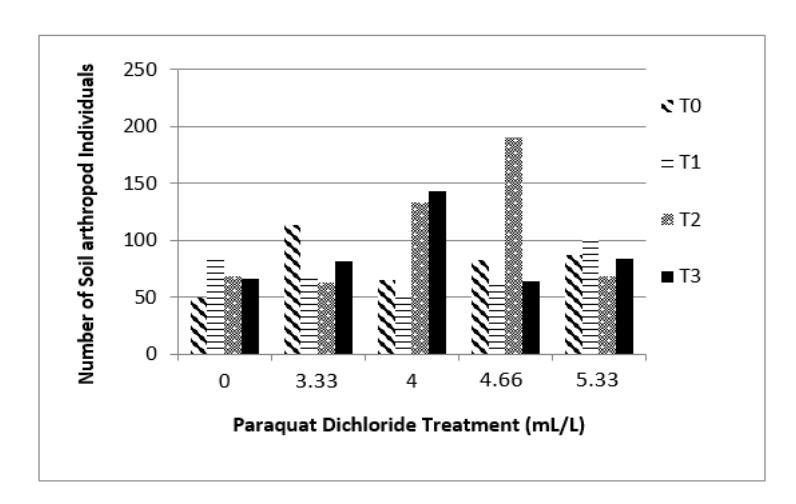
Figure 1 Comparison of the Number of Individual of Soil Arthropods at T0, T1, T2 and T3
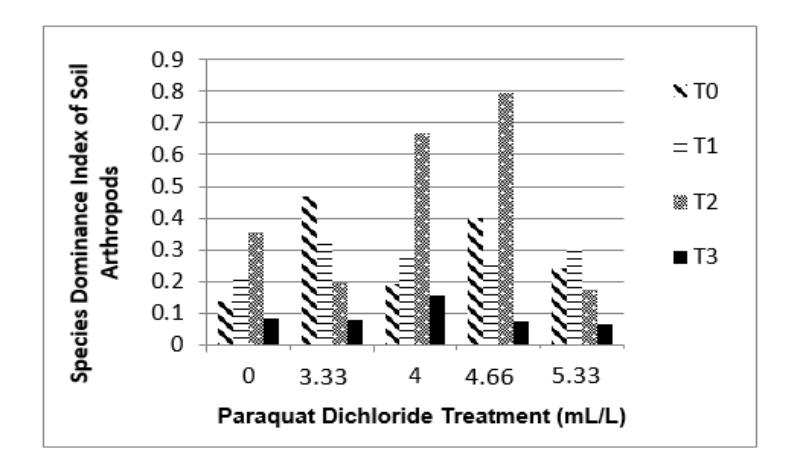
Figure 2 Comparison of abundance of soil arthropod species at T0, T1, T2, and T3
After spraying herbicide (T2), the richness of soil arthropod species in the treatment group did not show any specific trend, which indicated that paraquat dichloride did not have a significant effect on the species richness of soil arthropods. Species richness of soil arthropods increased towards harvest (T3) to a point higher than T0. During the T3 data collection, the rain had begun to fall. Air and soil temperatures decreased and were lower than the temperatures at T0, T1, and T2. Soil moisture in the treatment plot also increased on T3. Corn plants began to flourish, along with the surrounding weeds. This condition supports the survival of soil arthropods in the corn field, hence an increase in the species richness of soil arthropods. However, based on our One-Way ANOVA analysis, the herbicide paraquat dichloride did not have a significant effect on the richness of soil arthropod species (p = 0.958). Accordingly, Tukey's post-hoc test also showed that the species richness of soil arthropods between treatments did not differ significantly.
3.1.3. Species dominance index
A comparison of the dominance index of soil arthropod species at T0, T1, T2, and T3 is shown in Figure 3. The Simpson dominance index measures the presence of dominant species in an ecosystem. Higher index value indicates that the abundance of each species in the ecosystem is not evenly distributed. The low evenness of these species results in a low species diversity in the area. The dominance index of arthropods reached the highest value in treatment D (4.66 mL / L) at T2 (an index value of 0.794), which showed a high degree of dominance (Figure 3). With T1 and T2, the dominance index values for the treatments do not correspond to any certain trend. However, at T3 (before harvest) the dominance index value in all treatment groups decreased. It can therefore be concluded that at the time of T3, the diversity of soil arthropods increased. However, based on the One-Way ANOVA analysis, paraquat dichloride did not have a significant effect on the dominance index of soil arthropod species (p = 0.631).
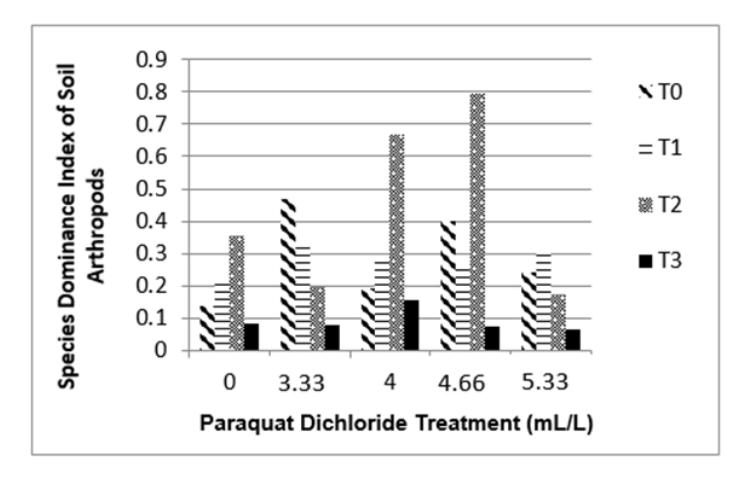
Figure 3 Comparison of the dominance index of soil arthropod species on T0, T1, T2, and T3
According to the Tukey post hoc test, the dominance index of soil arthropod species between treatments did not differ significantly.
3.1.4. Species diversity index
Comparison of the diversity index of soil arthropod species at T0, T1, T2, and T3 is shown in Figure 4. Species diversity index shows the diversity of species in a certain habitat. Diversity is influenced by both species richness and evenness, the latter can be measured through the dominance index of species. One one hand, at T1 and T2, the diversity index value in the treatment does not have a certain trend. Spraying herbicide may not have a significant effect on the species diversity index at the time of T2. On the other hand, at T3 (before harvest), the diversity index value in all treatment groups experienced an increase (Figure 4).
Based on the One-Way ANOVA analysis conducted, the use of paraquat dichloride did not result on any significant
effect on the diversity index of soil arthropod species (p = 0.818). Similarly, Tukey's post-hoc test also shows no significant difference between the diversity index values of soil arthropod species.
3.2. Sorensen similarity index
The Sorensen similarity index value between control (A) and the highest concentration treatment groups (E) is shown in Figure 5. The Sorensen (IS) similarity index between the control group and the highest concentration of paraquat dichloride herbicide treatment at T0, T1, T2, and T3 (with a value exceeding 50%) showed that the composition of soil arthropods in the two treatment plots were highly similar (Figure 5). Based on the results of identification (Table 1), Formicidae is the most common family of arthropods at T0, T1, T2, and T3, compared to other families.
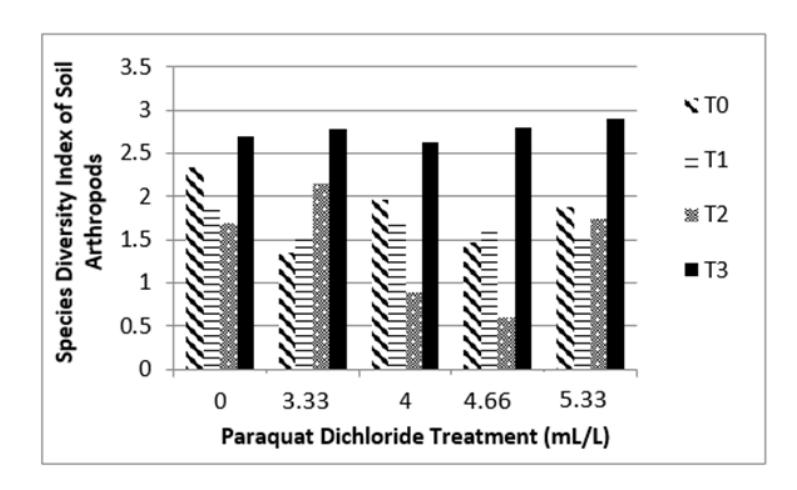
Figure 4 Comparison of diversity index of soil arthropod species at T0, T1, T2 and T3
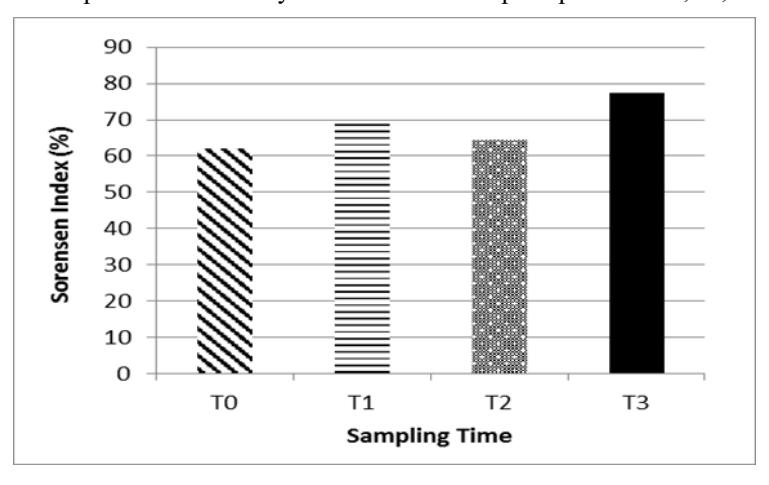
Figure 5 Sorensen similarity index value between control and treatment groups with the highest paraquat dichloride concentration at T0, T1, T2 and T3
4. Conclusion
From the results of the study, it can be concluded that the herbicide paraquat dichloride has no significant effect (p> 0.05) on individual numbers, species richness, species dominance, and diversity indices of soil arthropod species, whereas the Sorensen similarity index shows that the composition of soil arthropods in the control group and the treatment group with the highest concentration shows a high similarity, as indicated by an index value of more than 50%.
Acknowledgments
This research is funded by the Directorate of Fertilizers and Pesticides, the Directorate General of Agricultural Infrastructure and Facilities, Ministry of Agriculture of the Republic of Indonesia, to which we express our gratitude. We also thank the executive director of ITB Campus Jatinangor to allow the use of the Haurgombong Research Garden land to carry out the implementation of this research, and the Dean of SITH ITB who granted a permission and administrative assistance to conduct this research.