
1. Introduction
Pliek u, a fermented food condiment from Aceh, Indonesia, is produced from the fermentation process of coconut (Cocos nucifera) endosperm. The process typically involves an uncontrolled (uninoculated) fermentation process of coconut endosperm in 3-4 days. Characteristically, pliek u has a specific taste and smell, granular texture, and dark brown (Figure. 1). Acehnese people use pliek u as food condiment in cooking to give specific flavor and taste.
During the process of pliek u fermentation, it is believed that the coconut endosperm is undergoing several changes because of the activities of a diverse microbial community. Little has been reported, however, regarding the dynamic of these activities during the fermentation of pliek u. The profile of this microbial community diversity can be investigated with Community Level Physiological Profiling (CLPP) analysis. This method is based on the different uses of carbon substrate by the microbial community [1]
BIOLOGTM EcoPlate is a relatively simple method to study and to characterize the diversity of the physiological profile of the microbial community. The EcoPlate comprises a blank with 31 carbon substrates that can describe the metabolic activity of the microbial community in the environment [2]. In this study, BIOLOGTM EcoPlates was used to analyze the physiological profile of the bacterial community and to examine the correlation between fermentation time and bacterial metabolic activity in pliek u during fermentation.
2. Methodology
2.1. Sample
Samples of pliek u were collected from Siron of Aceh Besar Regency in the province of Aceh, Indonesia, where it was traditionally produced. According to the producer, pliek u was made from approximately one-year-old freshly grated coconut endosperm. The substrate was fermented for at least 72 hours until the substrate produced oil. Then, the substrate was dried under the sun, and the oil was separated from the pulp using a press machine. Sampling was done every 24 hours during fermentation stages (sample I=0 h, sample
II=24 h, sample III=48 h, and sample IV=72 h). The samples were stored at 4°C in a refrigerator until analysis.
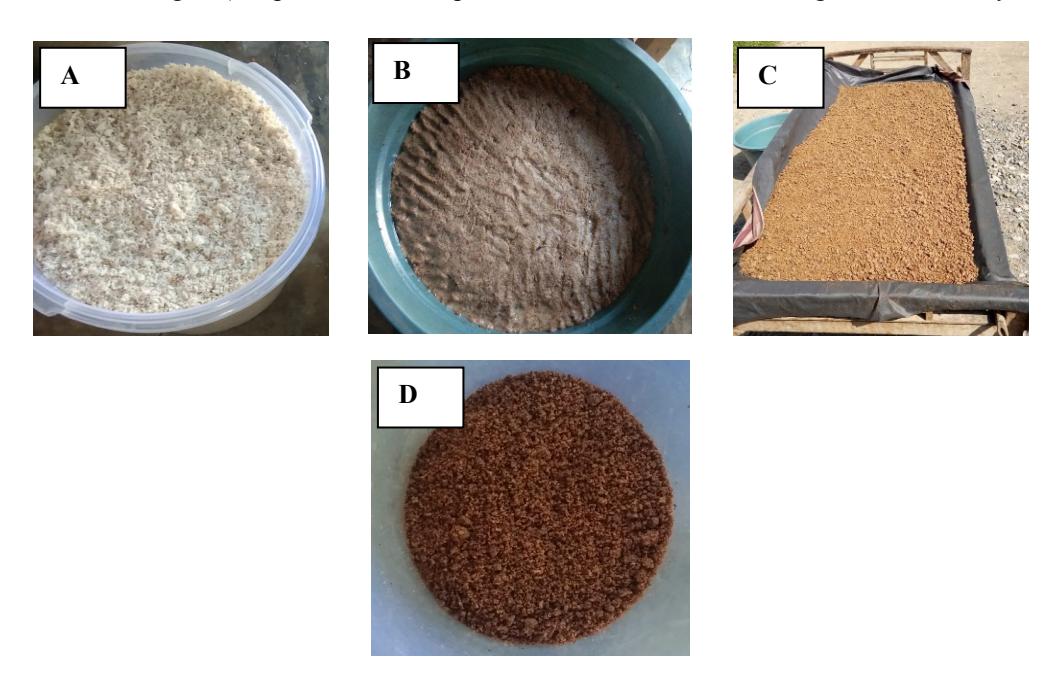
Figure 1. Documentation of the traditional pliek u fermentation process. (A) grated coconut; (B) during fermentation process; (C) drying process; (D) pliek u
2.2. Total Plate Count
Homogenate samples were inoculated on nutrient agar (NA) media with streak plate method and incubated at room temperature (± 28°C) for 24 h. Enumeration was performed to obtain the total plate count number expressed in colonyforming unit per mL (CFU/mL) [3].
2.3. Proximate Analysis and pH
Proximate analysis was conducted according to SNI 01- 2891-1992 to determine protein, fat, ash, and lipid contents from samples. Total carbohydrate was calculated by its difference. Subsequently, pH was analyzed based on the Association of Official Analytical Chemists standard procedures [4].
2.4. Community Level Physiological Profile (CLPP)
The samples were then prepared and inoculated into the BIOLOGTM EcoPlate based on the previous method [5] with some modifications. Three grams of sample was suspended into 27 mL nutrient broth and incubated for 12 hours at room temperature (± 28°C). Then, one ml suspension was suspended in 9 ml phosphate buffer saline (PBS) and diluting until 10-3 . A 100 µL was pipetted from the 103 dilution and inoculated to each one of the 96 wells in BIOLOGTM
EcoPlates. The EcoPlate was put back in the plastic wrapper and incubated at room temperature (± 28°C) in the dark. Absorbance measurements were conducted every 24 hours (0, 24, 48, 72, 96, and 120 h) with BIO-RAD iMarkTM microplate absorbance reader at a wavelength of 590 nm. Microbial activity in each microplate was expressed as average well color development (AWCD) was calculated according to Garland and Mills 1991 [6].
\[AWCD = \sum (C_i - R)/31 \tag{1}\]
Shannon's diversity index (H'), which is related to the number of carbon substrates the bacterial community is able to degrade, was calculated as follow:
\[H' = -\sum pi \times (\ln pi) \tag{2}\]
Definitions:
Ci: The OD590 nm values in 31 carbon wells.
R: The OD590 nm value in control well.
pi: The OD590 nm value in i well divide mean OD590 nm value of 31 wells
2.5. Bacterial Isolation and Characterization
Samples were aseptically taken from the BIOLOGTM EcoPlate well that showed positive results after 120 h
incubation. The concentration of the bacterial in the samples was decreased with serial dilutions technique up to 10-5 . Then, 100 µL of the samples was inoculated to nutrient agar media and incubated at room temperature ± 28º C for 24 h. The bacterial colonies were separated, purified, and characterized based on colony morphology [3]. These bacterial isolates were referred to as EC1-EC5 in this research.
2.6. Bacterial Identification
The selected bacteria based on substrate carbon utilization and domination were identified by molecular technique. A single isolate colony analysis used PCR (polymerase chain reaction) with 16s rRNA gene primers. Sequencing was performed by Macrogen (Korea). The results sequences were compared in GenBank with the use of the BLAST method to determine their approximate phylogenetic affiliation on the NCBI website (http://www.ncbi.nlm.nih.gov/) [7]. Then, phylogenetic analysis was performed with MEGA-X software and constructed using neighbour-joining algorithm with bootstrap 1000 replication [8].
2.7. Statistical Analyses
HeatMaps were performed on standardized data from the AWCD values at 120 h (BIOLOGTM EcoPlate) with R studio using Pheatmaps packages [9][10]. The results were also submitted to the principal component analysis (PCA) to determine the correlations between the substrates utilization and bacterial community during pliek u fermentation using Past3 [11].
3. Results and discussion
3.1. Bacterial Counts and Chemical-nutritional Characteristics
The number of bacteria involved during fermentation was determined by culturing the bacteria on nutrient agar media. Samples were enumerated and expressed in colony forming unit per mL (CFU/mL). Total plate count of bacterial enumeration in the samples decreased along with the time of fermentation. Similar to the number of total bacteria, the substrate pH also decreased in line with the time of fermentation, from 4.43 to 3.96 (Table 1). This strongly suggested that the decrease in the number of total bacteria was probably due to the decrease in pH value [12], as bacterial growth tends to be more bound to a certain pH compared to fungi and yeast [13].
Table 1. Total plate count enumeration of bacteria and chemical-nutritional characteristics of pliek u during fermentation.
| Sample | Total Plate | pH | Moisture | Ash (%) | Protein (%) | Fat (%) | Carbohydrate |
|---|---|---|---|---|---|---|---|
| Count | (%) | (%) | |||||
| (CFU/mL) | |||||||
| I | 1.8 x 10⁸ | 4.43 | 56.31 | 1.20 | 28.94 | 3.46 | 10.09 |
| II | 5.6 x 10⁸ | 4.71 | nd1 | nd1 | nd1 | nd1 | nd1 |
| III | 9.6 x 10⁸ | 4.08 | nd1 | nd1 | nd1 | nd1 | nd1 |
| IV | 5.0 x 10⁸ | 3.96 | 48.80 | 1.03 | 37.49 | 3.94 | 8.74 |
nd = not determined.
I= fermented pliek u 0 h; II= fermented pliek u 24 h; III= fermented pliek u 48 h; IV= fermented pliek u 72 h
Proximate analysis was conducted to evaluate the nutritional change during pliek u fermentation. The fermentation process caused biochemical changes in the substrate by the microorganisms' activity [14]. The result of the proximate composition of pliek u during fermentation is shown in Table 1. The moisture content on the substrates was high at the beginning of fermentation; however, it decreased at the end of fermentation from 56.31% to 48.80%. The decrease in the moisture content suggested the effects of water evaporation during fermentations that occurred in an open condition. The ash and carbohydrate contents decreased from 1.20% to 1.03% and 10.09% to 8.74% respectively, while the protein and fat contents increased from 28.94% to 37.49% and 3.46% to 3.94% respectively. Extensive hydrolysis of the protein and fat molecules to amino acids, simple fatty acids, and other simple molecules could have caused the increase in protein and fat values. The increase in protein and fat is an indication that pliek u can be a source of plant protein and fat [14].
3.2. Community-Level Physiological Profiles (CLPPs)
There was 31 carbon substrates utilization by a bacterial community from pliek u samples during fermentation that were calculated based on the BIOLOGTM EcoPlates analysis. AWCD was calculated based on the trendline equation to make it easier to see patterns of changes in AWCD values. The results of the AWCD analysis showed that there was a lag phase from day 0 to day 1, and subsequently an increase in AWCD values with an increase in the incubation time of the EcoPlates. The AWCD values in sample IV were 1.0833 and significantly higher than the AWCD values from samples II, I, and III at the value of 0.2984, 0.2505, and 0.0866 respectively (Figure 2).
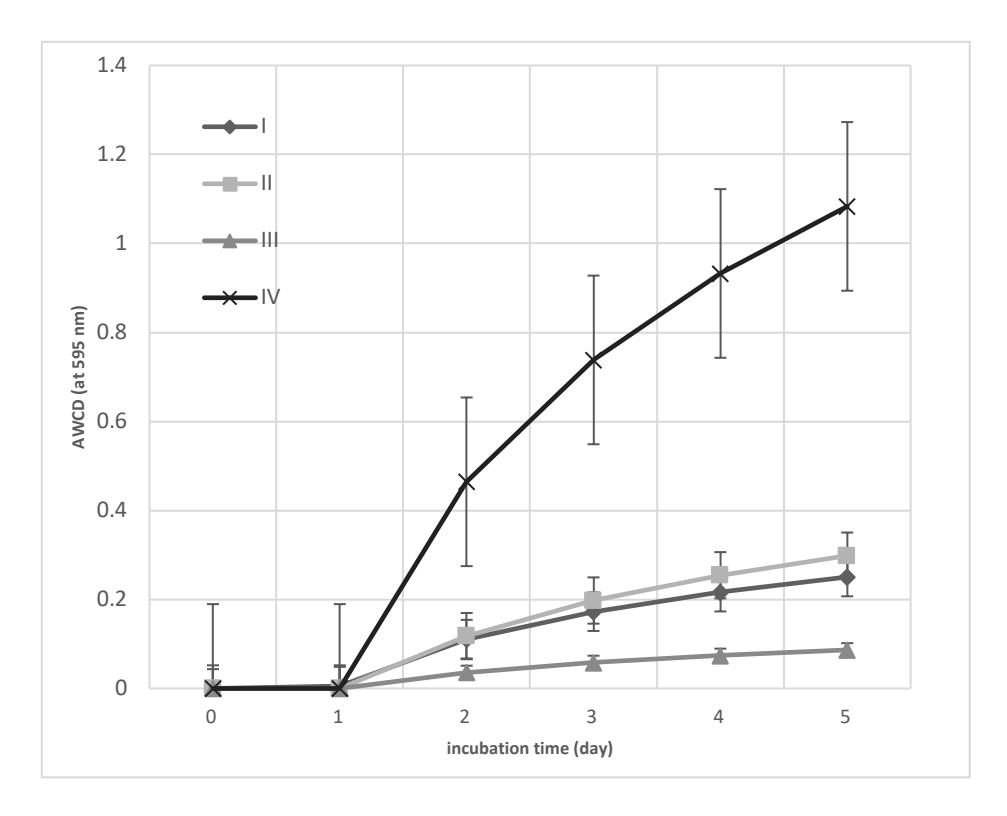
Figure 2. Trendline average well colour development of pliek u during fermentation (n = 3). I= fermented pliek u 0 h; II= fermented pliek u 24 h; III= fermented pliek u 48 h; IV= fermented pliek u 72 h.
Inoculum density and the structure of the community can influence the rate of substrate utilization by the bacterial community described in the AWCD value in the samples [15]. The number of the bacterial community in the pliek u during the fermentation process showed a decrease in the total plate count number from the 24 h of fermentation to the end of fermentation (Table 1). In contrast, the AWCD value at 48 h fermentation showed the lowest AWCD value and at 72 h fermentation showed the highest AWCD value (Figure 2). Thus, there were differences in the structure of the bacterial community at each stage of fermentation. The differences in the diversity or structure of bacterial communities at the stage of pliek u fermentation may be owing to the condition of spontaneous fermentation process of pliek u. In the spontaneous fermentation, bacteria could enter the substrate via various sources, such as air or the equipment used that contained various microorganisms [16][17].
3.3. Functional Diversity
Shannon index (H') showed functional diversity that encompassed both substrate richness and substrate evenness. Functional diversity, operationally, is defined as the rate of substrates utilization by the microbial community [18]. The H' value of the bacterial community was analyzed at day-0 and day-5 of the EcoPlate incubation (Figure 3). In all samples, there was no significant change in the H' value
during the time indicated, which showed that the entire bacterial community on EcoPlate had been active and metabolized the substrate from day-0. Then, the H' values from samples I, II, and IV generally had approximately the same index value in the range of 3.00. In contrast, the H' value in sample III was slightly lower (below 3.00). This result showed that the bacterial community in sample III had a lower ability to utilize the substrate than the bacterial community in samples I, II, and IV.
3.4. Analysis of Substrate Utilization and Multivariate Analysis
The patterns of carbon substrates utilization of the bacterial communities in pliek u during fermentation varied based on fermentation times. The number of carbon substrates utilized was lower in samples I and III than in samples II and IV (Figure 4). Heatmap results indicated that at 0 and 48 hours of fermentation, carbon substrate utilization was carbohydrates (N-Acetyl-d-glucosamine, d-Cellobiose, β-Methyl-d-glucoside, d-Mannitol), carboxylic acid (Pyruvic acid methyl ester), and polymer (α-Cyclodextrin). Then, the bacterial community at 24 hours of fermentation was correlated to the use of three polymers (Glycogen, Tween 80, Tween 40), four carbohydrates (i-Erythritol, d-Mannitol, d-Cellobiose, β-Methyl-d-glucoside), two carboxylic acid (2- Hydroxy benzoic acid, γ-hydroxybutyric acid), and two
amino acids (l-Threonine, l-Phenylalanine). Finally, the bacterial community at 72 hours correlated to the use of four amino acid substrates (l-Serine, l-Arginine, l-Asparagine, Glycyl-l-glutamic acid), seven carboxylic acids (D-Galactonic acid γ lactone , d-Galacturonic acid, d-
Glucosaminic acid, Itaconic acid, 4-Hydroxy benzoic acid, d-Malic acid, γ-Amino butyric acid), five carbohydrates (α-d-Lactose, β-Methyl-D-glucoside, D-Cellobiose, d-Mannitol, N-Acetyl-d-glucosamine), carbon phosphate (Glucose-1 phosphate), amine (Putrescine), and polymer (Tween 40).
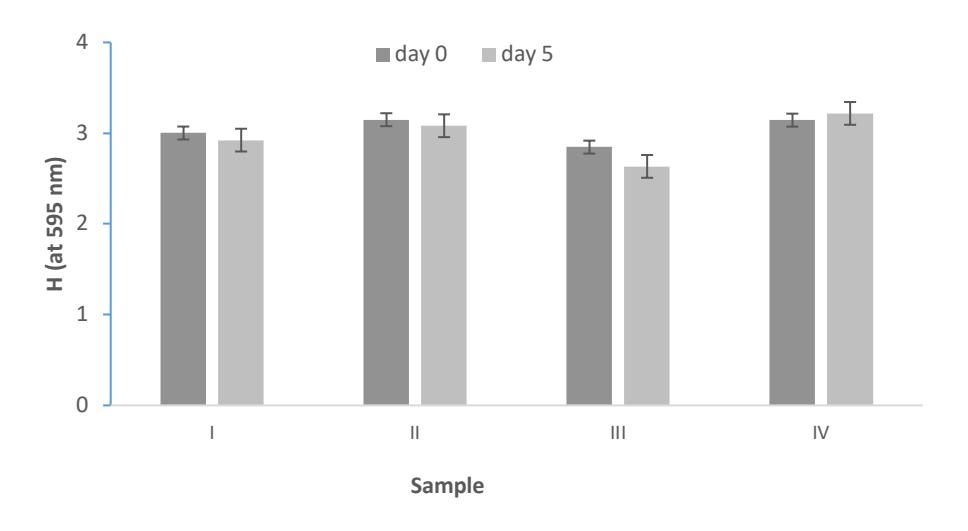
Figure 3. The Shannon index (H') of pliek u during fermentation (n = 3), evaluated on the day-0 and the day-5 day of BIOLOGTM EcoPlate incubation
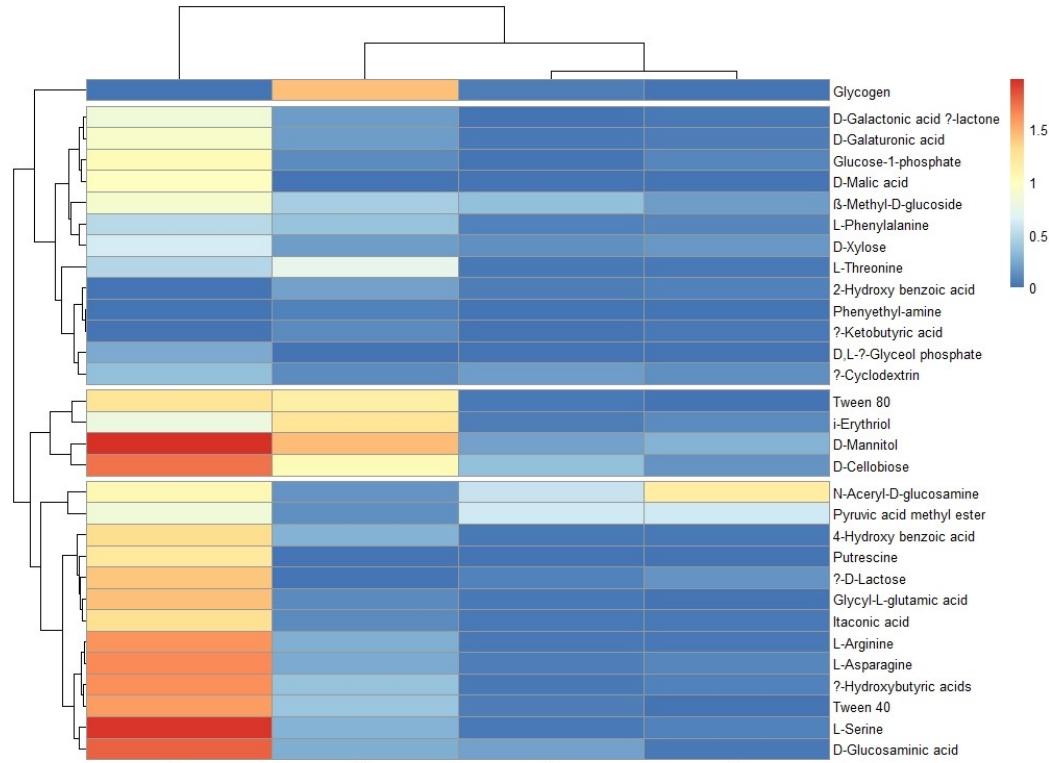
Figure 4. Cluster analyses and HeatMaps for the carbon utilization patterns of the 31 substrates located on the BiologTM EcoPlates data incubated for 120 h from samples pliek u during fermentation (n = 3). Samples I= fermented pliek u 0 h; II= fermented pliek u 24 h; III= fermented pliek u 48 h; IV= fermented pliek u 72 h.
Based on the Principal Component Analysis (PCA), pliek u samples during fermentation were distinguished into three groups based on their metabolic profiles:
- Sample IV with very high biological activity
- Sample II with average biological activity
- Samples I and III with the lowest biological activity (Figure 5).
The result from the PCA also showed that the bacterial community in samples I and III were correlated to the substrate group of carbohydrate, while in sample II the bacterial community was correlated to substrate group carbohydrate and polymer. The bacterial community in sample IV was corelated with substrate group amino acids, carbohydrate, and carboxylic acid.
The data showed that the microbial community-level physiological profiles were different at each stage of fermentation (Figure 5). The use of polymer and carbohydrate substrates by the bacterial community at the 24 h of pliek u fermentation was related to the availability of nutrients on the pliek u fermentation substrate. Nutrients were available in coconut endosperm at the beginning of fermentation in the form of complex compounds such as polysaccharides, proteins, and fats. At this stage, cellulolytic, proteolytic, and lipolytic microorganisms seemed to have hydrolysed the polysaccharide molecules, such as galactomannan and glucomannan; the protein molecules, such as globulin, albumin, glutelin-1, glutelin-2, and prolamin; the fatty acid molecules such as caproic acid (6: 0), acids, globulins, protein molecules, globulin, albumin, glutelin-1, glutelin-2, and prolamin and fatty acid molecules such as caproic acid (6: 0), acids caprylic (8: 0), capric acid (10: 0), lauric acid (12: 0), meristic acid (14: 0), palmitic acid (16: 0), stearic acid (18: 0), oleic acid ( 18: 1) and linoleic acid (18: 2) became simple molecules [19][20][21]. Then, there was a change in metabolism from polymer and carbohydrate substrates to amino acids, carboxylic acids, carbohydrates by the bacterial community at the 72 h of fermentation. Changes in the use of these substrates were probably due to the formation of flavour compounds or over fermentation that was correlated to the bacterial community structure in pliek u during fermentation.
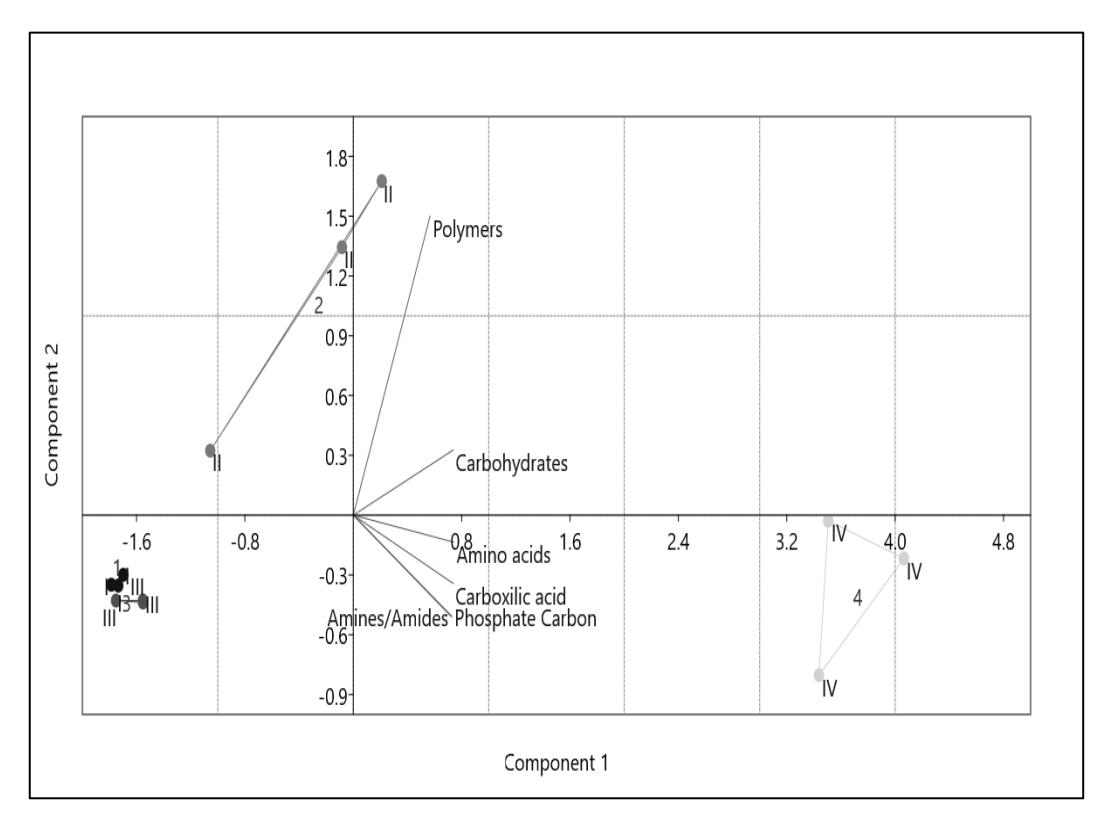
Figure 5. Principal component analysis of substrates utilization bacterial community during pliek fermentation from BiologTM EcoPlates incubated for 120 h (n = 3). I= fermented pliek u 0 h; II= fermented pliek u 24 h; III= fermented pliek u 48 h; IV= fermented pliek u 72 h.
The formation of compounds that plays a role in flavours during fermentation can occur through the metabolism of flavour precursor compounds or flavour compounds themselves by microorganisms [22]. In general, the compounds that play a role in flavour formation can come from groups of amino acids, phenols, and ketones [23]. Amino acids have a vital role in the formation of flavour. Each amino acid contributes to a different taste; serine has a combination of sour and umami flavours, arginine tastes bitter but slightly sweet and glutamic acid gives umami or savoury flavours [24]. The amino acid arginine and glutamic acid are the most dominant compared to the other amino acids found in the coconut endosperm. The predominance of umami, bitter, and slightly sweet taste in pliek u was suspected from these amino acids.
3.5. Predominant Bacterial in Pliek u Fermentation
The bacteria involved in pliek u fermentation were determined by isolating the bacteria from the BIOLOGTM EcoPlate well, which showed positive results. There were five isolated bacterial isolates (Figure 6). The macroscopic characterization showed that EC1, EC3, and EC4 isolates had the same characteristics: round-shaped, convex-elevation, entire-margin, and white opaque colonies. The EC2 isolate was round-shaped, raised-elevation, entire-margin, creamcolored, and large-sized. Then, the EC5 isolate was roundshaped, convex-elevation, entire-margin, and yellowish.
EC1 isolate was present from the 0 h to 72 h pliek u fermentation and was found to utilize tween 80, α-
Cyclodextrin, pyruvic acid methyl ester, itaconic acid, dglucosaminic acid, N-Acetyl-d-glucosamine, β- Methyl-dglucoside, and d-Cellobiose, which were from substrate groups polymer, carboxylic acid, and carbohydrate. EC2 isolate was present at 0 h and 48 h of fermentation and capable to utilize β-Methyl-d-glucoside, d-Mannitol, α-d-Lactose, and glycyl-l-glutamic acid, which were from substrate groups carbohydrate and amino acid. Then, there were only three isolates present at 72 h of pliek u fermentation, namely EC3, EC4, and EC5. EC3 isolate was the most dominant compared to the other isolates at 72 h fermentation and was found to utilize tween 40, tween 80, β-Methyl-d-glucoside, d-Xylose, 4-Hydroxy benzoic acid, γ-Amino butyric acid, d- glucosaminic acid, glucose-1 phosphate, glycyl-l-glutamic acid, l-threonine, l-asparagine, l-serine, and l-phenylalanine, which were from substrate groups polymer, carbohydrate, carboxylic acid, phosphate carbon and amino acid. EC4 was capable to utilize dgalactonic acid γ-lactone, d-galacturonic acid, and d, l-αglycerol phosphate, which were from substrate groups carboxylic acid. Finally, EC5 was found to utilize the amino acid substrate l-arginine. From this result, it was strongly suggested that EC1 and EC3 had an important role in pliek u fermentation process.
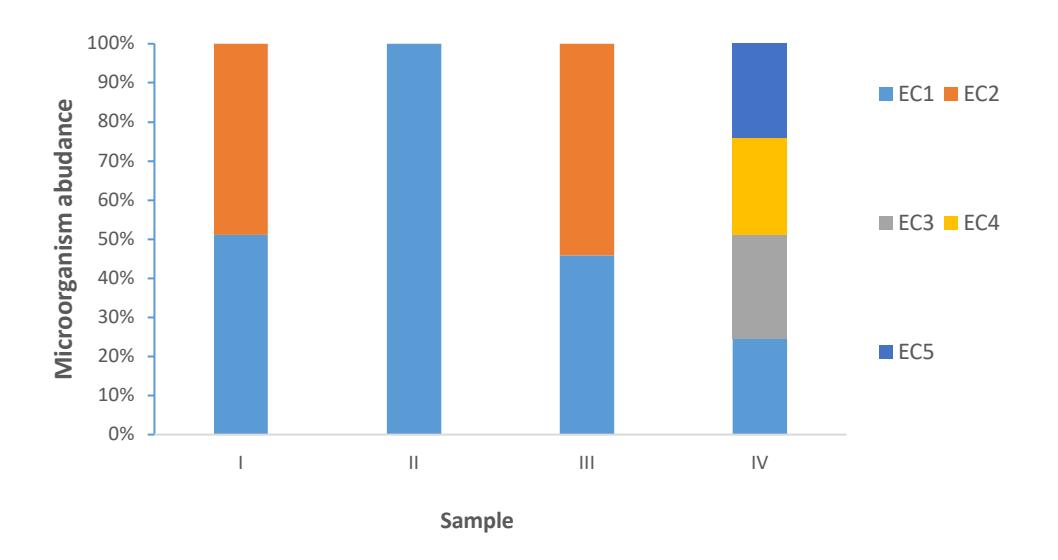
Figure 6. Microorganism abundance during pliek u fermentation from samples in BIOLOGTM EcoPlate after 120 h incubation.
The BLAST results of the EC1 sequence on the NCBI gene bank showed that the EC1 had 92.06% ident with Pseudomonas lactis strain DSM 29167 and 91.90% ident Pseudomonas azotoformans strain NBRC 12693. Then, the results of phylogenetic analysis showed that EC1 isolate had a close relation with the Pseudomonas azotoformans strain NBRC 12693 with a bootstrap value of 62 (Figure 7A). P. azotoformans has previously been reported in foods such as milk and meat [25]. P. azotoformans can hydrolyse compounds, such as citrate, malate, mannitol and mannose, which are a group of organic acids, carboxylic acids and carbohydrates [26]. Furthermore, P. azotoformans is also classified as proteolytic and lipolytic bacteria because it can hydrolyse proteins and lipids [27].
The BLAST results of the EC3 sequence on the NCBI showed that the EC3 had 94.25% ident with Pseudomonas lundensis strain ATCC 49968 and 93.76% ident with Pseudomonas helmanticensis strain OHA11. Based on the phylogenetic analysis results, EC3 isolate had a close relation with Pseudomonas lundensis strain ATCC 49968 with a bootstrap value of 94 (Figure 7B). P. lundensis was psychotropics bacteria commonly found in foods such as meat and milk [28]. The main extracellular enzymes secreted by P. lundensis were the peptidase and lipase enzymes [29]. P. lundensis could produce acids from carbohydrate class
compounds such as L-arabinose, D-galactose, D-glucose, Dmannose, D-ribose, maltose, melibiose, and D-xylose. The ability of acid production varied depending on the P. lundensis strain [30].
The traditional food fermentation that involves Pseudomonas bacteria has been widely reported. This includes fermentation of castor seed oil from Africa, semayi (coconut dregs) from Indonesia, ngapi (ground fish) from Myanmar, Ogiri-Nsiko (crab) from Nigeria. The bacteria is also involved in the fermentation of fish sauce, which is a widespread process in Asia [19]. In the pliek u fermentation, the predominant isolates that were isolated from the pliek u fermentation process were both bacteria belonging to the genus Pseudomonas. This is the first time that Pseudomonas presence has been identified in pliek u fermentation.
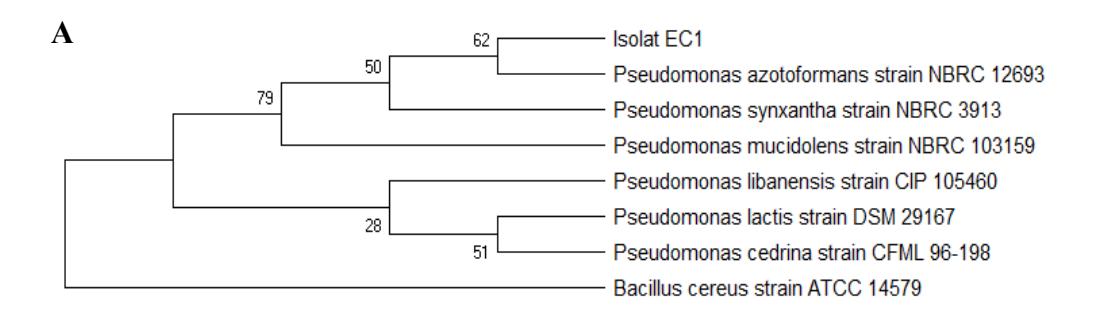
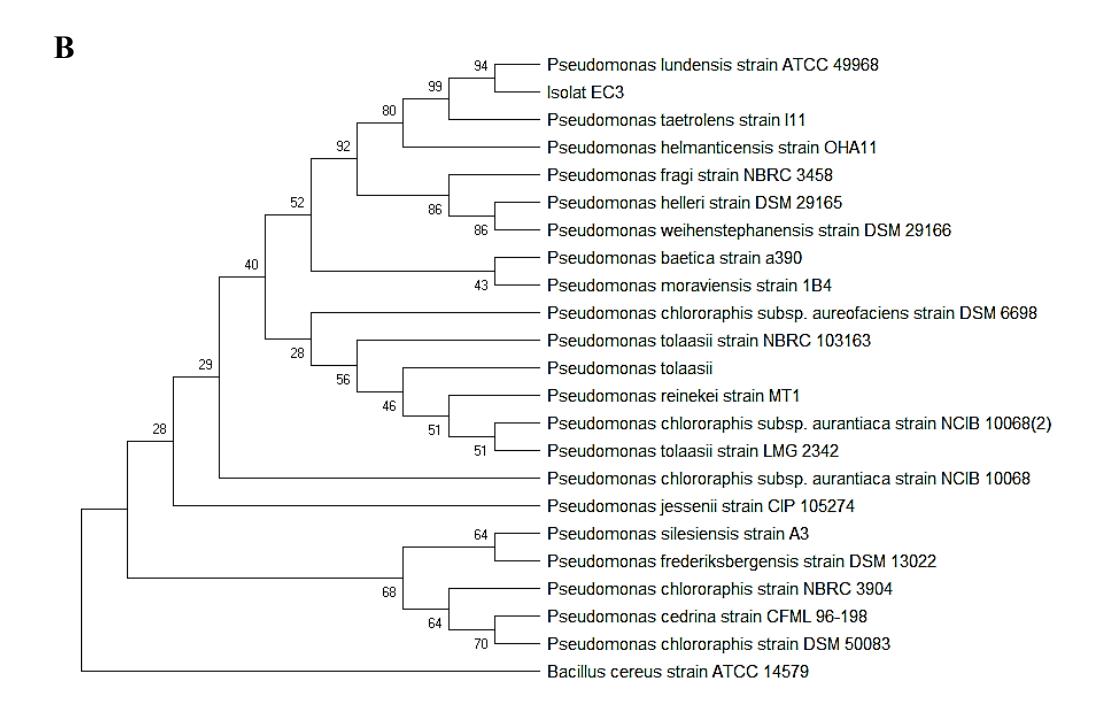
Figure 7. Phylogenetic tree was constructed using neighbor-joining algorithm of nucleotides sequence of 16S rRNA gene (a) EC1 Isolate (b) EC3 Isolate
4. Conclusion
The significance of this study showed that there was an alteration in using substrate EcoPlate and the activities of the bacterial community during the process of pliek u fermentation. At the beginning of the fermentation, the substrate used was the carbohydrates and polymers substrate group, while at the end of the fermentation it shifted to the amino acids and carbohydrates substrate group. The biological activity of the bacterial community was higher at the end of pliek u fermentation. Furthermore, the predominant bacteria isolate EC1 and EC3 can be a candidate inoculum in controlled pliek u fermentation.