
1. Introduction
The population of Bandung City in 2018 reached 2.5 million people [1] with a population growth rate of 0.72%, making this city a metropolitan. Based on data from the Ministry of Home Affairs of the Republic of Indonesia in 2015, Bandung is the 4th most populated city in Indonesia. The annual increase in urbanization activities caused population expansion in this capital city of West Java province. Indeed, West Java province has experienced urbanization since 2000 [2]. Bandung is known as the city of education, which is one reason for urbanization. It happens both from rural to the city and outside Java to the city.
Population expansion in Bandung caused an increase in population activity and an increasing need for land area. Those activities from industrial, transportation, Liquefied Petroleum Gas (LPG), household, and livestock sectors
could change the economy, industrial structure, and also the consumption pattern of the local community. Advances in technology, economic factors, and the human desire to improve their standard of living have caused this [3]. These activities produced byproduct wastes, which increases CO2 emissions [4]. The vegetation must immediately absorb these CO2 emissions. But in substance, the increasing need for land as housing area has led to a decrease in green open space. The area of green open space functions as a CO2 absorber is an imbalance with the CO2 emission rate, which causes the environmental quality of Bandung to decline.
This study offers a program called the CO2 Emission Rate Reduction Simulation (CERRS). CERRS consists of four scenario steps, namely: (1) substitution of motorized vehicle fuel and application of smart driving techniques, (2) optimization of waste processing at Integrated Waste Processing Site (IWPS), (3) processing 90% of livestock
waste into biogas, and (4) construction of 30% green open spaces of Bandung area. This research predicts CO2 emissions and emission absorptions in Bandung City without applying CERRS, to predict CO2 emission and emission absorptions in Bandung City by applying CERRS and CO2 emission from five CO2 emitting sectors in the Bandung city.
2. Methodology
2.1. Study Area and Sampling Time
This research was conducted from October 2019 to December 2019. Research activities were carried out in Bandung City, West Java (Figure 1).
2.2. Tools and Materials
This research used ArcMap 10.4.1 software to quantify vegetation greenness, Stella 9.0.2 to simulate a dynamic model of CO2 emission and absorption in Bandung. The research material used is in the form of secondary data as presented in Table 1.
Figure 1. Bandung city map (Source: google earth)
Table 1 Research materials
| Type of Data | Source |
|---|---|
| Landsat ETM 8 imagery for Bandung City 2009 & | earthexplorer.usgs.gov and eos.com |
| 2018 and Sentinel-2 in 2018 | |
| Number of industrial sectors in Bandung City | Badan Pusat Statistik, Neraca Energi Indonesia |
| Number of vehicles in Bandung City | Badan Pusat Statistik |
| The amount of LPG consumption in Bandung City | Badan Pusat Statistik |
| Total population of Bandung City | Badan Pusat Statistik |
| Number of livestock in Bandung City | Badan Pusat Statistik |
2.3. Model concept
This study uses the concept of loss-gain emission from urban population activities. CO2 emissions resulting from the industrial, transportation, LPG, household, and livestock sectors. Then search for information between these components to get a prediction. The conceptualization model is depicted as a causal loop diagram as shown in Figure 2.
2.4. Specific Model
We run the model simulation in Stella 9.0.2 which is divided into six submodels, then map them out as a model.
2.4.1.CO2 Emission and Absorption Model
The CO<sub>2</sub> emission and absorption model describes the entire dynamic system of the resulting emission and CO<sub>2</sub> absorption capacity of Bandung city. "Bandung CO<sub>2</sub>
emissions" is the accumulation of emissions from industry, transportation, LPG, household, and livestock. These emissions will affect the city's CO<sub>2</sub> according to the amount and rate of each sector. Accumulated CO<sub>2</sub> emissions in Bandung City will be reduced by "Bandung CO<sub>2</sub> absorptions" originating from vegetation and resulting in remaining unabsorbed CO<sub>2</sub> emissions, marked with "Unabsorbed CO<sub>2</sub> emissions". The CO<sub>2</sub> emission and absorption model could be seen in Figure 3.
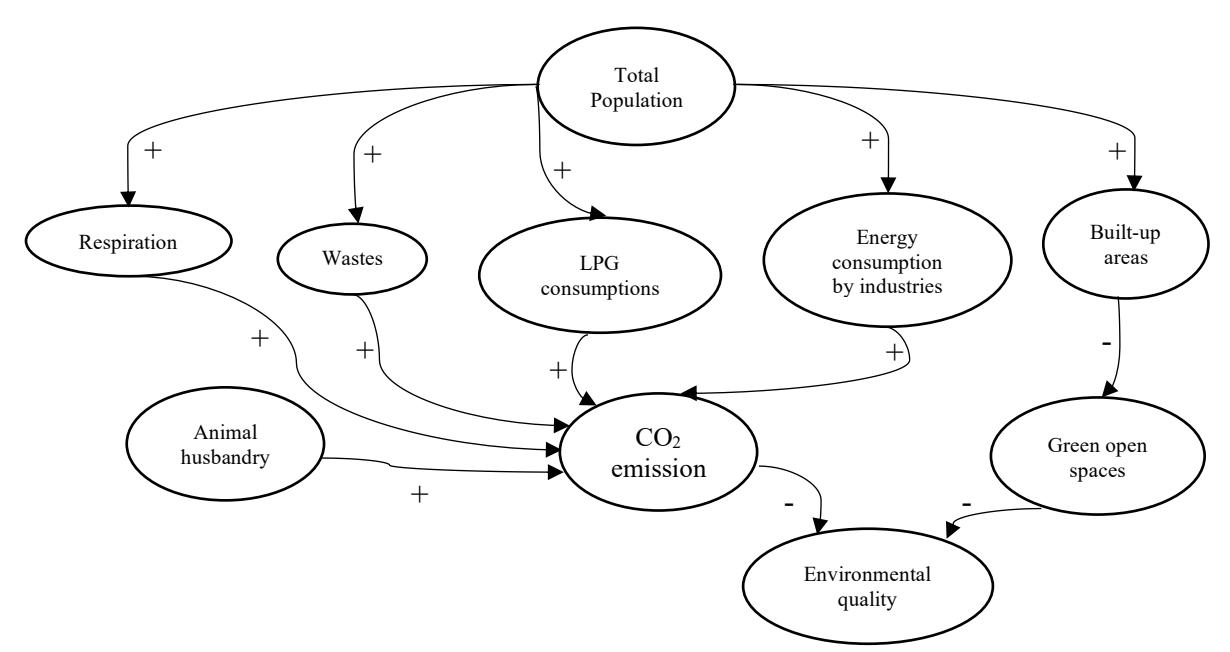
Figure 2. The concept of a model in the form of a causal loop diagram
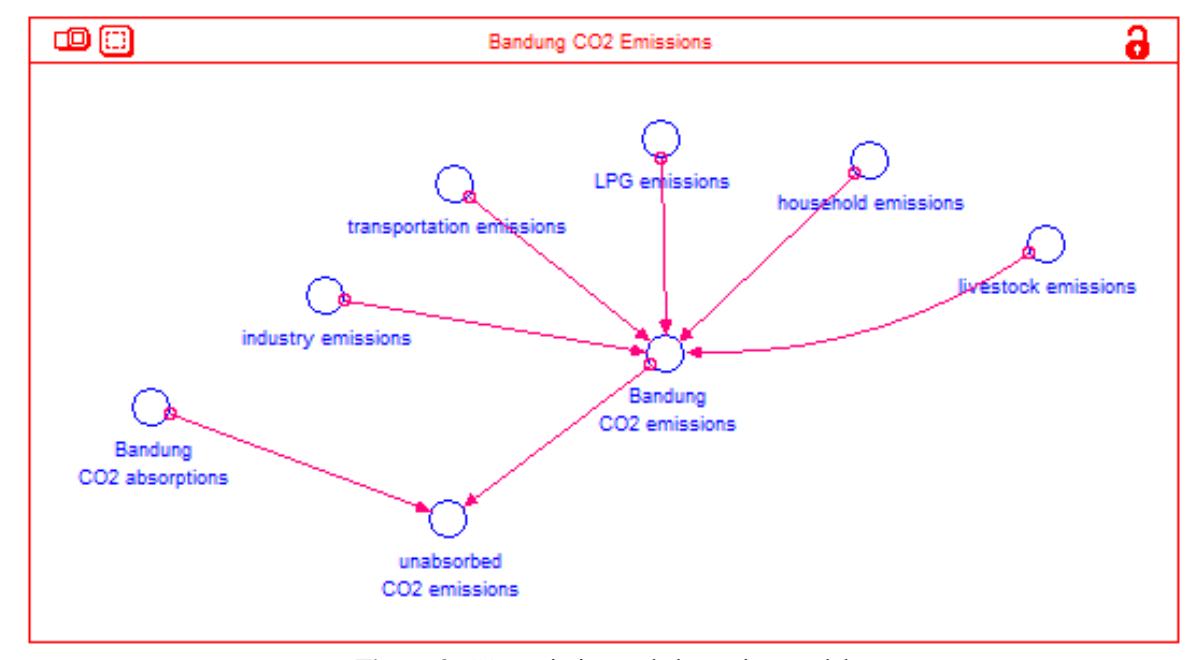
Figure 3. CO<sub>2</sub> emission and absorption model
2.4.2.CO2 Absorption Submodel
The CO2 absorption submodel describes the amount of CO2 absorption based on the greenness of the land through NDVI quantification, which is equivalent to the absorption capacity of land cover [6] (Table 3). NDVI is calculated through the NDVI algorithm, as seen from Eq. (1). The map is obtained from 2018 Bandung Sentinel-2A imagery downloaded from the eos.com website. The rate of change in the area of land greenness is calculated through the changes in the results of the NDVI images of the Landsat ETM 8 Bandung City in 2009 and 2018.
\[NDVI = \frac{NIR - RED}{NIR + RED}\]
(1)
Where:
NIR = reflection in the near-infrared spectrum
RED = reflection in the red range of the spectrum
NDVI results are classified based on the level of greenness of the land according to Permenhut R.I. No: P.12 / Menhut-II / 2012 [5] (Table 2).
The results of NDVI scores were reclassified into five classes [5], where NDVI values ranging from -1 to 1 were converted to 0-100. The rate of increase in green land is assumed to come from the rate of change in the area of greenish land from 2009 to 2018, amounting to 0,00303% per year, and is assumed to have the same rate every year. In the model, each area of green land is multiplied by the respective CO2 absorption capacity and accumulated into Bandung City's CO2 absorption. Data and information on the CO2 absorption submodel could be seen in Table 4 and the CO2 absorption submodel in the Stella could be seen in Figure 4.
Table 3. CO2 Absorption Equivalence
| Greenness Level of Land | Type of Land Cover (Equivalence) | CO2 Absorption (t/ha/yr) |
|---|---|---|
| No vegetation | Built-up areas | 6.12 |
| Very low greenness | Rice fields | 12 |
| Low greenness | Grassland | 12 |
| Medium greenness | Shrubs | 55 |
| High greenness | Trees | 569.07 |
Sources: [5] and [6]
Table 4. Data and information on CO2 absorption submodel in Bandung City
| Greenness Level of Land | Type of Land Cover (Equivalence) | Areas (ha) | CO2 Absorption (t / ha / yr) |
|---|---|---|---|
| No vegetation | Built-up areas | 3,621.27 | 6.12 |
| Very low greenness | Rice fields | 8,968.48 | 12 |
| Low greenness | Grassland | 1,939.53 | 12 |
| Medium greenness | Shrubs | 471.24 | 55 |
| High greenness | Trees | 61.88 | 569.07 |
Sources: [5] and [6]
2.4.3.Industry Submodel
The industrial submodel is only based on the amount of natural gas and coal energy used by the industrial sector. The industrial sector that is used is the processing industry, specifically economic activities which include changes both chemically and physically from materials, elements, or components to new products. Processing industry raw materials could come from agricultural, forestry, fishery, mining or quarrying products, and other processing industry activities. In short, the processing industry is a major renewal or change of an item. The industries that are considered are medium and large-scale industries, amounting to 321 units in 2018 [1]. The rate of consumption of natural gas and coal is calculated by reducing the number of processing industries in Bandung, which is 8.86% per year and is assumed to have the same rate every year. CO2 emissions are obtained through the conversion of data on the amount of energy consumption in the industrial then multiplied by the calorific value and CO2 emission factor. Data and information on CO2 emissions from the industrial sector in Bandung could be seen in Table 5. The industrial submodel in Stella could be seen in Figure 5.
2.4.4.Transportation Submodel
The transportation submodel presents four types of motorized vehicles as CO2 emitters, namely motorbikes, gasoline cars, diesel cars, and buses. CO2 emissions are obtained through the conversion of data on the amount of energy consumption in the transportation sector then multiplied by the calorific value and CO2 emission factor. Each type of vehicle has own CO2 emission factor, as seen in Table 6. The transportation submodel in Stella could be seen in Figure 6.
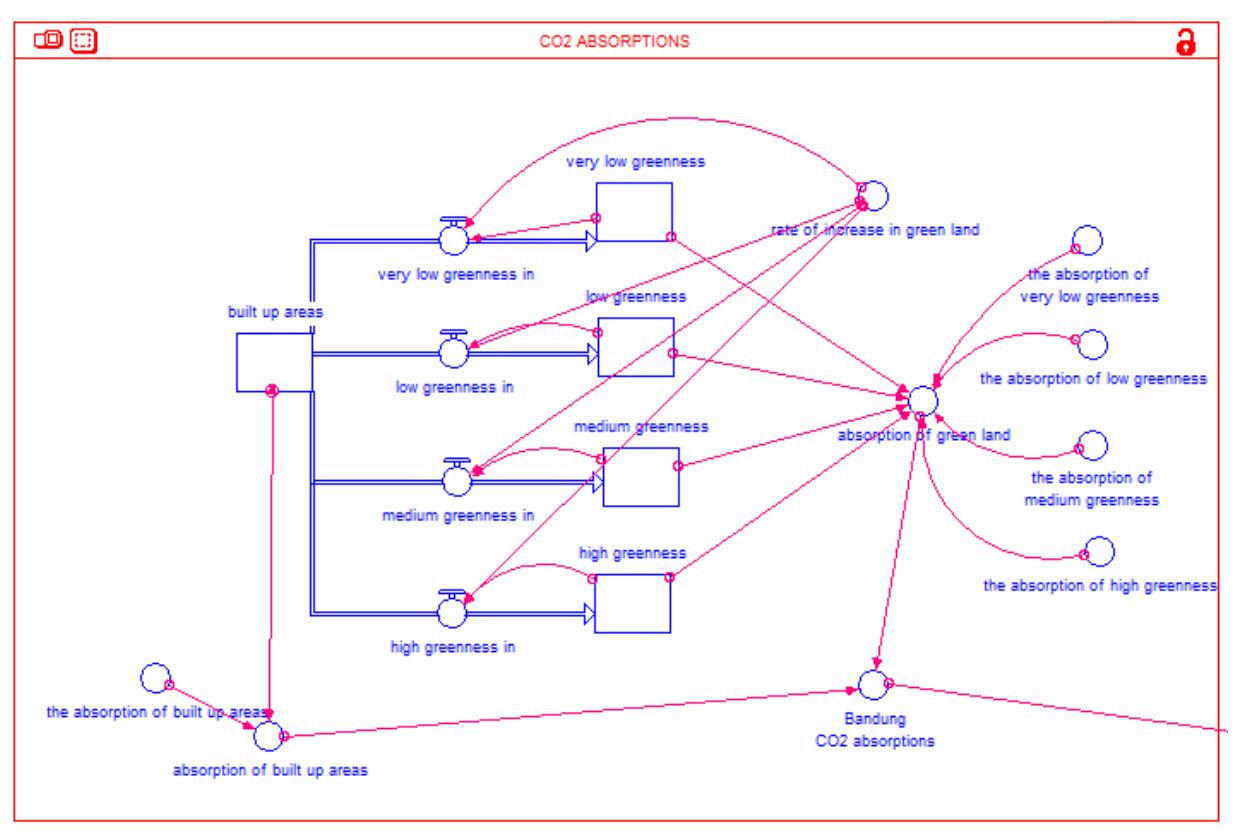
Figure 4. CO2 absorption submodel
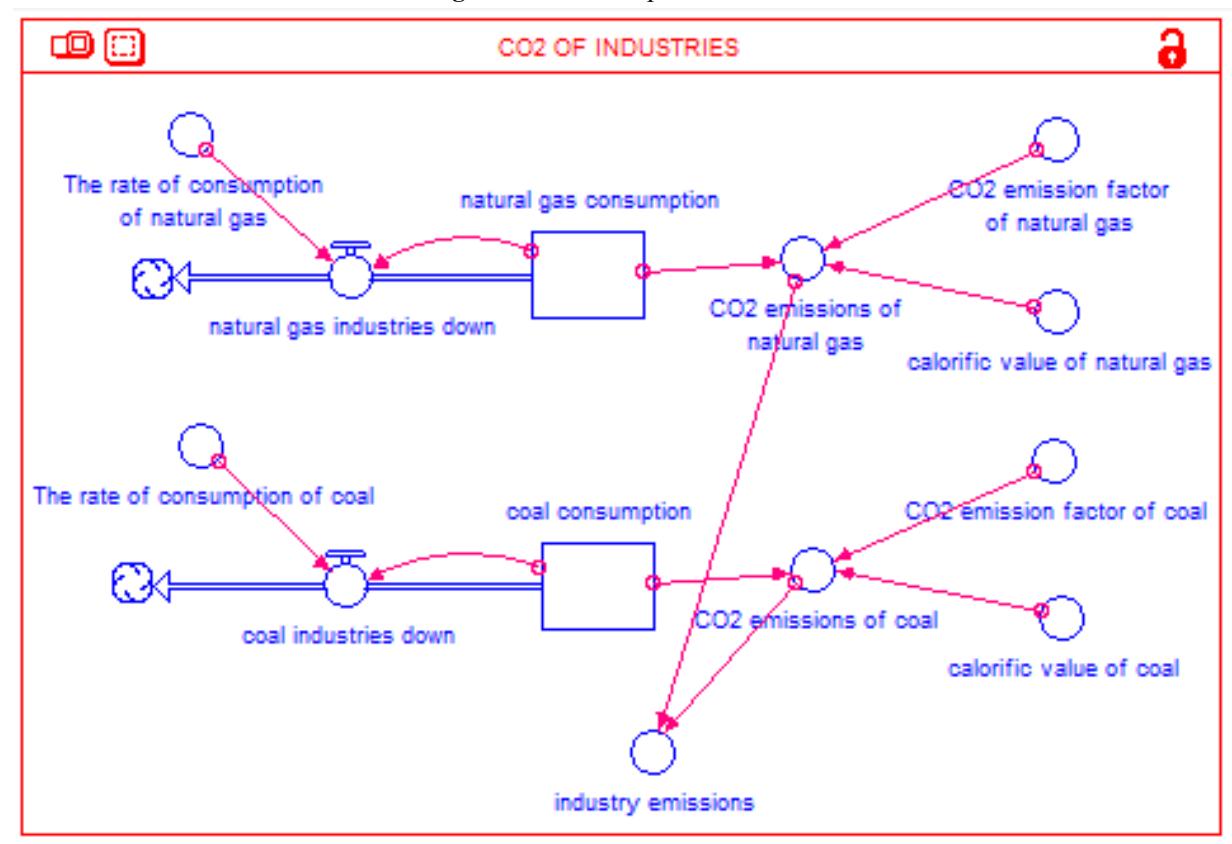
Figure 5. Industry Submodel
Table 5. Data and information on industry CO2 emissions submodel in Bandung City
| No | Energy types | Energy consumptions (t) | Calorific value (TJ / t) | CO2 emission factors (t / TJ) |
|---|---|---|---|---|
| 1 | Natural gas | 7,675,329.32 | 38.5x10⁻³ | 63.1 |
| 2 | Coal | 9,893,000 | 18.9x10⁻³ | 96.1 |
| Source: [7] | ||||
Table 6. Data and information on transportation CO2 emissions submodel in Bandung City
| Vehicle types | Number of | The rate of the | Energy | Calorific value | CO2 emission |
| units | number of vehicles | consumption (lt | (TJ / L) | factors (t / TJ) | |
| (% per yr) | / yr / unit) | ||||
| Motorcycle | 1,256,057 | 8.96 | 550.8 | 33x10-6 | 69,300 |
| Gasoline car | 402,649 | 5.99 | 2320.7 | 33x10-6 | 69,300 |
| Diesel car | 73,576 | 3.92 | 1813.2 | 36x10-6 | 74,100 |
| Bus | 6,390 | 4.2 | 4263.6 | 36x10-6 | 74,100 |
Sources: [7] and [8]
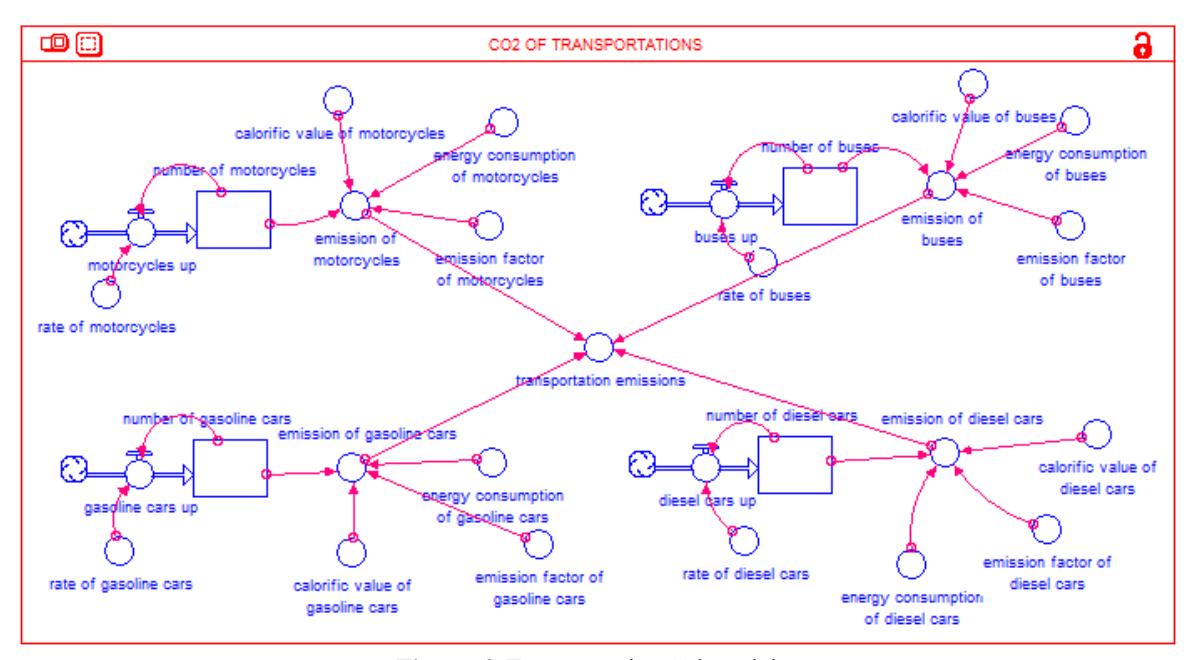
Figure 6. Transportation Submodel
2.4.5.Liquid Petroleum Gasses Consumption Submodel
This submodel calculates Liquid Petroleum Gasses (LPG) which is assumed to be used by all households in Bandung City, with 955,550 heads of households (HH) in 2018 [11]. The city of Bandung experienced an increase in the rate of LPG consumption by 21.92% with an emission factor of 63.1 tons / TJ and a heating value of 0.0461 TJ / ton [8]. CO2 emissions are obtained through the conversion of data on the amount of energy from LPG consumption in the household then multiplied by the heating value and CO2 emission factor. LPG consumption submodel in Stella could be seen in Figure 7.
2.4.6.Household Submodel
The household submodel is the amount of CO2 emissions from respiration and waste generated by residents in Bandung City. The total population of Bandung in 2018 was 2,503,708 people, assuming the amount of waste produced by each person is 0.1825 tonnes/year [10]. A higher population means a higher amount of waste. Bandung City is assumed to experience the same population growth rate every year of 0.72% with a respiration CO2 emission factor of 0.34 tons/person/year and CO2 emission factor per tonne of waste is 2.56 tons [10]. CO2 emissions are obtained through the conversion of data by multiplying the amount of population and waste to each of the CO2 emission factors. The household submodel in Stella could be seen in Figure 8.
Figure 7. LPG Consumption Submodel
Figure 8. Household Submodel
2.4.7.Livestock Submodel
The livestock submodel is quantified from the emission of enteric fermentation and manure management. The rate of increase and decrease in the number of livestock in Bandung is assumed to be the same every year. CO2 emissions are obtained through the conversion of data by multiplying the amount of each type of livestock to the CO2 emission factor. Data and information on the livestock sector could be seen in Table 7. The livestock submodel in Stella could be seen in Figure 9.
Types of livestock Total The rate of the number of livestock (%) CO2 emission factors (t / head / yr) Goat 582 4.19 0.12 Sheep 34,684 6.41 0.12 Dairy cows 721 -5.3 2.12 Beef cattle 1,640 19.48 1.1 Buffalo 122 -0.88 1.31 Horse 168 2.68 0.46 Free-range chicken 498,307 22.18 0.00046 Broiler chicken 369,345 18.87 0.00046 Duck 60,647 10.38 0.00046
Table 7. Data and information on livestock CO2 emissions submodel in Bandung City
Sources: [7] and [10]
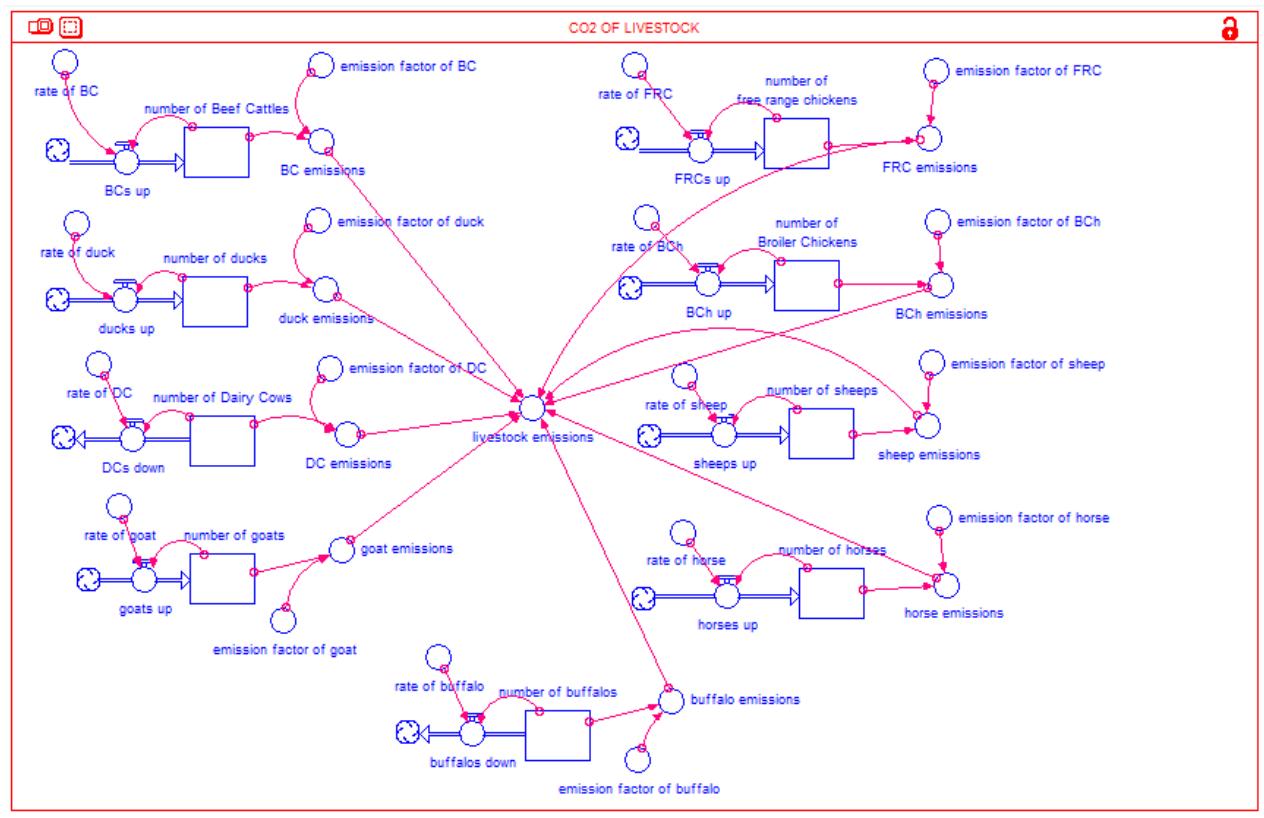
Figure 9. Livestock Submodel
2.5. Assumptions and Research Limitations
The assumptions and limitations used in this study are:
- 1. The model uses a closed approach system, meaning that the calculated CO2 emission only comes from the Bandung City area, CO2 outside the Bandung City area is ignored, including the influence of the wind.
- 2. CO2 is only absorbed by vegetation in Bandung city.
The rate of increase or decrease in energy from the industrial, LPG, household, transportation, and livestock sector is constant every year.
3. Results and discussion
3.1. Model Simulation
Models are applied to estimate CO2 emissions and absorptions from 2021 to 2030. 2030 is a year that is following the Nationally Determined Contribution (NDC) document related to the Paris Agreement. Indonesia has an ambitious commitment to reduce greenhouse gas (GHG)
emissions by 29% below the level of business as usual (BaU) by 2030 [12]. Estimation of CO2 emissions and absorptions divided into two categories, namely without CERRS intervention and with CERRS intervention. Simulation of CO2 emission and absorption in Bandung City without CERRS intervention results from Business as Usual, while the simulation of CO2 emission and absorption with CERRS intervention consists of four scenario stages, namely (1) substitution of motorized vehicle fuel and application of smart driving techniques, (2) optimization of waste processing at IWPS, (3) processing 90% of livestock waste into biogas and (4) building green open space covering 30% of the area of Bandung City.
3.1.1.Estimation of Emissions, Absorptions and Unabsorbed CO2 Emissions without CERRS Simulation Package in Bandung City
Based on the results of the estimation model, the amount of CO2 emission in Bandung City had a much greater value than its absorption. In 2021, CO2 emissions in Bandung were 6,958,801.58 tons and would continue to increase to reach 10,983,666.82 tons in 2030, while CO2 absorption in Bandung City in 2021 was only 214,201.83 tons and increased slightly to become 214,235.11 tons in 2030. Graph and result of CO2 emission, absorption, and unabsorbed emissions estimate in Bandung City in 2021 and 2030 presented in Table 8 and Figure 10.
Table 8. Estimation using Stella
| Year | CO2 Emissions (t) | CO2 Absorptions (t) | Unabsorbed CO2 Emissions (t) |
|---|---|---|---|
| 2021 | 6,958,801.58 | 214,201.83 | 6,744,599.75 |
| 2030 | 10,983,666.82 | 214,235.11 | 10,769,431.71 |
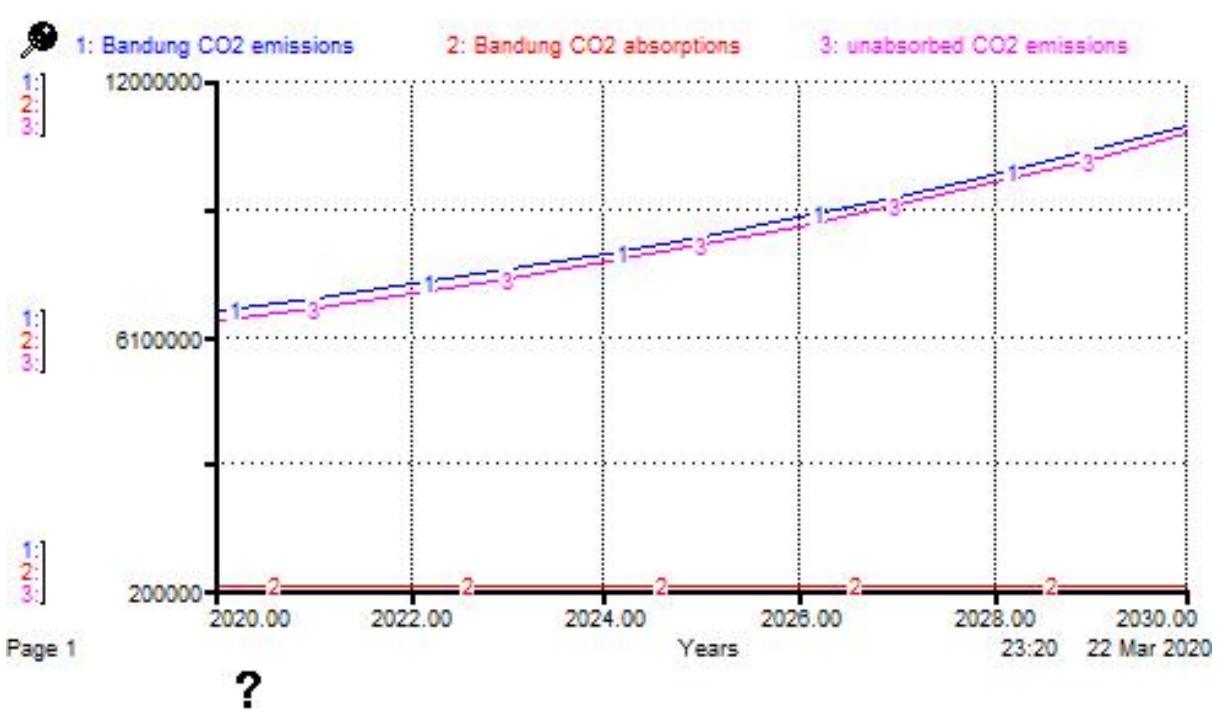
Figure 10. Graph of emissions, absorptions, and unabsorbed CO2 emissions in Bandung City without CERRS simulation package
3.1.2. Estimation of Emissions, Absorptions and Unabsorbed CO2 Emissions by Applying the Phase I Scenarios: Vehicle Fuel Substitution and Smart Driving Techniques
In this scenario, the substitution of diesel fuel to B30 fuel and gasoline fuel to Gas Fuel (BBG) was carried out. B30 fuel is a mixture of 70% diesel fuel and 30% Fatty Acid Methyl Esther (FAME) which is obtained from palm oil. The application of B30 could reduce the composition of diesel use by 30%. FAME is biodiesel that has a higher flash point than diesel so that it affects its low combustibility. Biodiesel is also a cleaner fuel than diesel because it does not contain sulfur and benzene compounds [13]. In the application of BBG as a substitute for gasoline, the resulting emissions are only 10%. This data was obtained based on the results of a trial conducted by the Committee for the Elimination of Lead
Gasoline on Euro-2, Euro-3, and Euro-4 vehicles, namely that emissions from BBG are 90% lower than fuel [14].
Smart driving is a driving technique that combines ecodriving, safe driving, and defensive driving. The smart driving technique is simply an efficient, environmentally friendly, safe, comfortable, ethical, and dignified driving method. Some steps in implementing this method are using the highest gear position with low engine speed (2000-2500 rpm), reducing the frequency of acceleration and braking, adjusting tire pressure to those recommended by the vehicle
manufacturer, using the hand brake when stopping, and maintaining the vehicle periodically. The results of the training in smart driving techniques that have been carried out in Semarang, Tegal, and Bandung cities have shown a decrease in the level of fuel consumption, which varies from 0 to 40% [15]. In this scenario, 40% applied a reduction in fuel consumption, so that the CO2 emission reduction in Bandung was 70% and unabsorbed CO2 emission in Bandung was 71%. The estimation results of this scenario is presented in Figure 11 and Table 9.
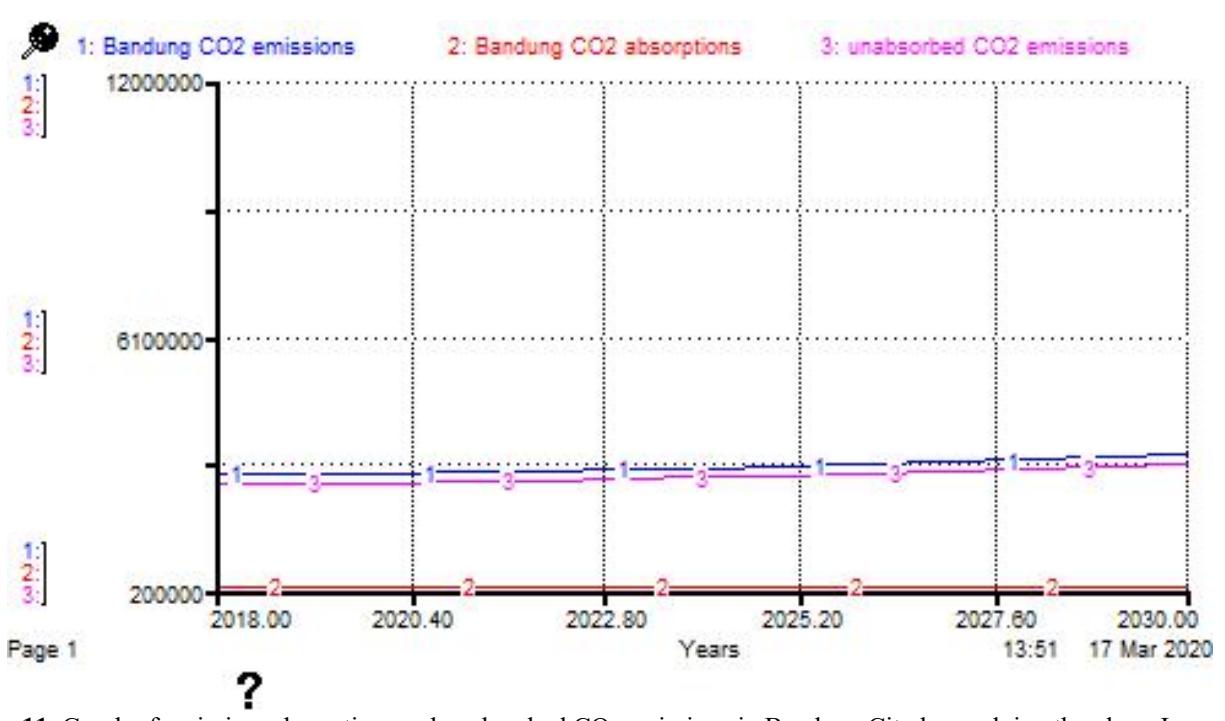
Figure 11. Graph of emission, absorption, and unabsorbed CO2 emissions in Bandung City by applying the phase I scenarios
Table 9. Estimation using Stella
| Year | CO2 Emissions (t) | CO2 Absorptions (t) | Unabsorbed CO2 Emissions (t) |
|---|---|---|---|
| 2021 | 2,901,338.81 | 214,201.83 | 2,687,136.98 |
| 2030 | 3,332,409.68 | 214,235.11 | 3,118,174.57 |
3.1.3.Estimation of Emissions, Absorptions and Unabsorbed CO2 Emissions by Applying the Phase II Scenario: Scenario I + Optimization of Waste Management at IWPS
Integrated Waste Processing Site (IWPS) is a place where activities are followed through, sorting, reusing, recycling, reprocessing, processing, and possibly the end [16]. Research at IWPS Janti Village, Waru District, Sidoarjo Regency
shows that IWPS in Janti Village has a waste reduction potential of 75%. This is done by processing organic waste into compost, reusing inorganic waste, and recycling inorganic waste into flakes [17]. The second stage scenario could reduce CO2 emissions in Bandung City by 78% and the unabsorbed CO2 emissions in Bandung City by 80%. The estimation from this scenario is presented in Figure 12 and Table 10.
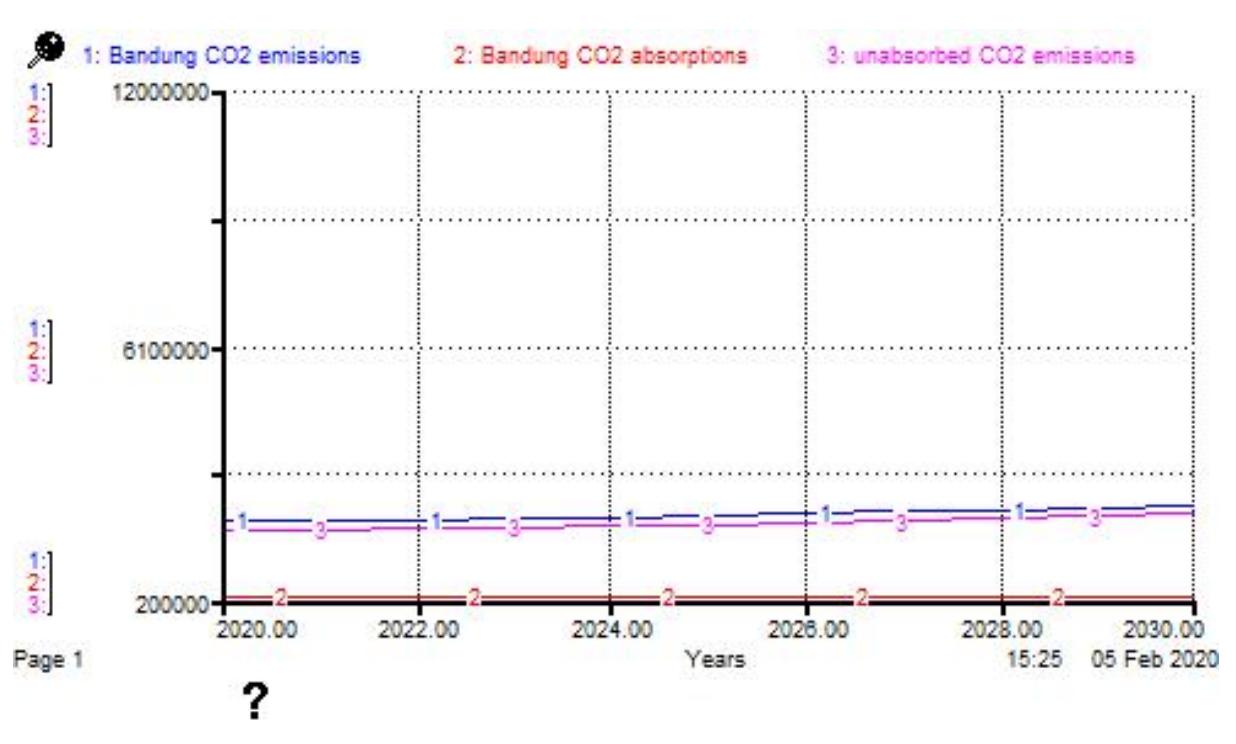
Figure 12. Graph of emission, absorption, and unabsorbed CO2 emissions in Bandung City by applying the phase II scenarios
Table 10. Estimation using Stella
| Year | CO2 Emissions (t) | CO2 Absorptions (t) | Unabsorbed CO2 Emissions (t) |
|---|---|---|---|
| 2021 | 2,007,625.75 | 214,201.83 | 1,793,423.92 |
| 2030 | 2,379,604.09 | 214,235.11 | 2,165,368.98 |
3.1.4. Estimation of Emissions, Absorptions, and Unabsorbed CO2 Emissions by Applying the Phase III Scenario: Scenario I + II + Processing 90% of Livestock Waste into Biogas
Biogas comes from decomposing organic matter carried out by microorganisms under anaerobic conditions. The main organic material as a source of biogas production is livestock manure such as cattle, buffalo, pigs, horses, and poultry. Compost from two cows or six pigs could produce biogas in less than two m3 . In addition, one m3 of biogas is also equivalent to 0.46 kg of LPG or 0.62 liters of kerosene [18]. Scenario stage III could reduce CO2 emissions in Bandung City by 78.5% and the unabsorbed CO2 emissions in Bandung City by 80%. The estimation results from this scenario is presented in Figure 13 and Table 11.
3.1.5.Estimation of Emissions, Absorptions and Unabsorbed CO2 Emissions by Applying the Phase IV Scenario: Scenario I + II + III + Development of green open spaces covering an area of 30% of the Bandung City Area
The results of estimating CO2 emissions in scenario I-IV showed that CO2 emissions in Bandung City were still not
fully absorbed, so efforts still need to be made to achieve carbon neutrality. Carbon-neutral is a state when CO2 emissions could be absorbed so that emissions are zero. Green Open Space (GOS) in Bandung City has only reached 12% of the area of Bandung City [19], whereas based on Law Number 26 of 2007 concerning Spatial Planning Article 29 paragraph 2 provides that reporting of green open space in the city area is at least 30% of the total area of the city. The proportion of 30% green open space from the area of Bandung City is 5.019,3 Ha. In this scenario, a 30% green open space was built with CO2 absorption increasing every 4 years. The stage IV scenario was able to increase the absorption of CO2 emissions in Bandung City by 1,200.3% and reduced the remaining CO2 emissions in Bandung City by 103,9%. Through the application of stage IV, carbonneutral could be achieved by 2029. The estimation results of this scenario is presented in Figure 14 and Table 12.
3.1.6.Estimation of CO2 Emissions in Bandung City
After going through stages I-IV, an estimate of the amount of CO2 emissions in Bandung was obtained based on the five sectors that are provided in Table 13 (sorted from the least contributing sector to the largest).
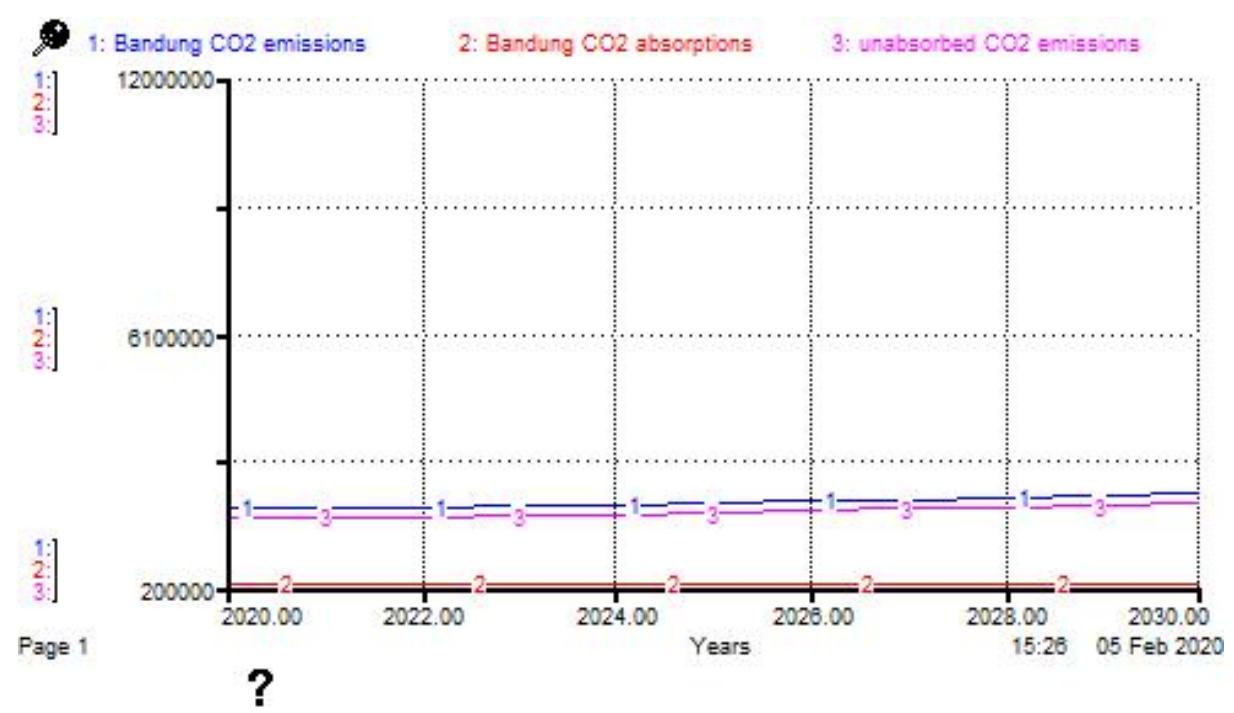
Figure 13. Graph of emission, absorption, and unabsorbed CO2 emissions in Bandung City by applying the phase III scenarios
Table 11. Estimation using Stella
| Year | CO2 Emissions (t) | CO2 Absorptions (t) | Unabsorbed CO2 Emissions (t) |
|---|---|---|---|
| 2021 | 1,996,609.84 | 214,201.83 | 1,782,408.01 |
| 2030 | 2,361,721.30 | 214,235.11 | 2,147,486.19 |
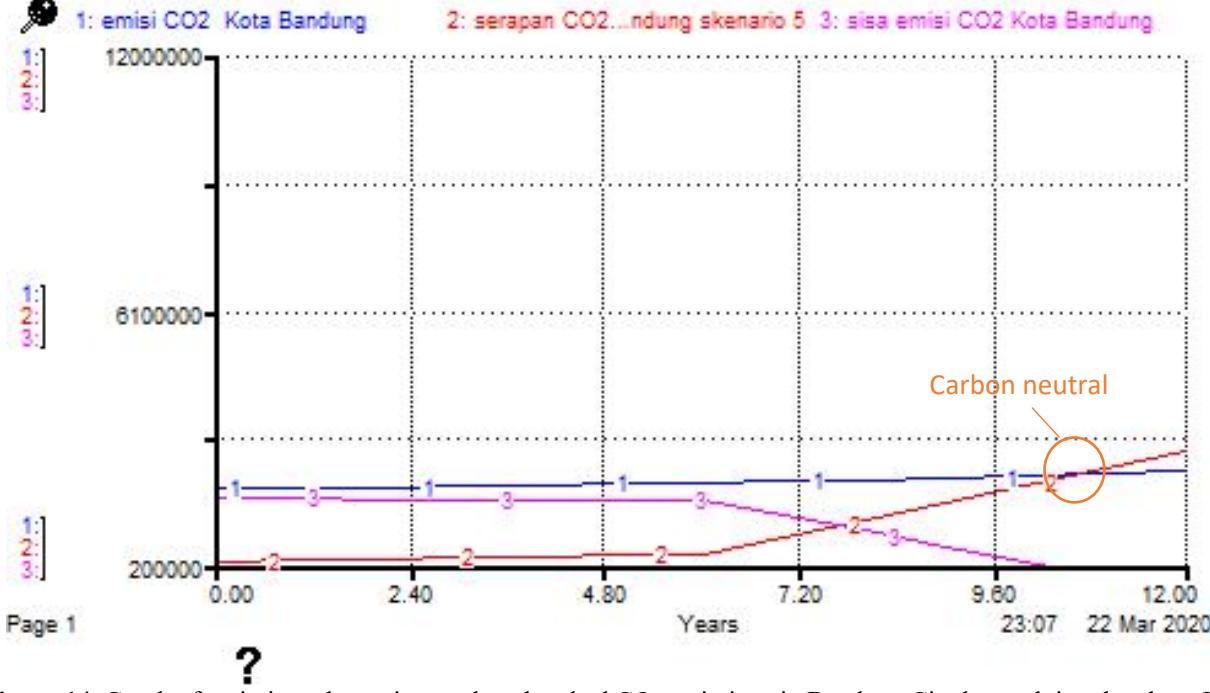
Figure 14. Graph of emission, absorption, and unabsorbed CO2 emissions in Bandung City by applying the phase IV scenarios
Table 12. Estimation using Stella
| Year | CO2 Emissions (t) | CO2 Absorptions (t) | Unabsorbed CO2 Emissions (t) |
|---|---|---|---|
| 2021 | 1,996,609.84 | 1,667,174.97 | 329,434.87 |
| 2030 | 2,361,721.30 | 2,785,703.11 | -423,981.81 |
Table 13. Estimated CO2 emissions in Bandung City based on five sectors
| Estimation of CO2 Emissions (t) |
| 1,612.84 |
| 3,730.73 |
| 109,794.84 |
| 1,000,065.41 |
| 1,246,317.49 |
The effects of estimating CO2 emissions showed that the application of the CERRS package could reduce CO2 emissions in the household sector by 43.4%, the transportation sector by 88.44%, and the livestock sector by 90%. Since the present study provides useful information about the benefit of increasing green open space in a city as well as applying some programs for reducing CO2 emissions, the study suggests it is necessary to make policies that could give the best result and convenient implementation for the community. The dynamic simulation model of CO2 emissions and absorptions like this study did have to be established and improved as soon as possible. It could help the decision-maker have complete data for the program which gives the emission highest.
4. Conclusion
Based on the results, several points can be concluded, i.e.,
- 1. The number of CO2 emissions in Bandung without CERRS intervention was estimated to be 6,958,801.58 tons in 2021 and 10,983,666.82 tons in 2030, the number of CO2 absorption in Bandung without CERRS intervention was estimated to be 214,201.83 tons in 2021 and 214,235.11 tons in 2030.
- 2. The number of CO2 emission in Bandung without CERRS intervention was estimated to be 1,996,609.84 tons (down 71.3%) in 2021 and 2,361,721.30 tons (down 78.5%) in 2030, the number of CO2 absorption in Bandung with CERRS intervention was estimated to be 1,667,174.97 tons (up 678%) in 2021 and 2,785,703.11 tons (up 1,200.3%) in 2030.
- 3. CO2 emissions in 2030 with CERRS intervention are thought to come from the household sector (1,246,517.49 tons), followed by the transportation sector (1,000,065.41 tons), the industrial sector
(109,794.84 tons), LPG consumption (3,730.73 tons), and the livestock sector (1,612.84 tons).