
1. Introduction
Humans need a variety of ecosystem services provided by nature, both in the function of provision, regulatory, culture, and support [2]. Humans need to connect and affiliate with nature [7]. Forests are one of the most abundant ecosystems that provide various essential services for human lives and other living things. They may provide habitat for various animals, food, and clean water sources, or even support recreation and spirituality for the community. Forest ecosystems can create a healthy environment because the air contains abundant negative ions, phytoncides, and oxygen. Moreover, they provide acoustic sound sources, natural radiation levels, biodiversity, and create a comfortable climate within the area[8].
Healing services are provided by forests, which are ecosystems that bring numerous advantages to human health. Forest treatment has been shown in multiple studies to have a soothing impact and reduce stress levels as evaluated by psychological and physiological reactions in humans [1]. In terms of psychology, the forest environment can boost happy emotions, reduce negative emotions, improve attention concentration ability, and help people recover from attention fatigue. Several studies have indicated that walking in nature can help persons with depression and anxiety disorders enhance their cognitive performance[1]. This is due to the restorative
influence of nature, which can bring relaxation to the psychological and physiological conditions of the body through flowers, trees, and water [1,3].
The forest environment has been demonstrated to lower blood pressure, pulse rate, heart rate, stress hormones, and strengthen the immune system on a physiological level. Physiological relaxation is marked by a drop in blood pressure, as demonstrated [1.3], which found a significant decrease in blood pressure in hypertensive individuals after exposure to a forest setting. Furthermore, physiological relaxation can be shown in the body's endocrine system, dramatically dropping by cortisol, adrenaline, norepinephrine, and dopamine [9]. The forest environment also affects the immune system by breathing phytoncides released by plants. Increased NK cell activity was also seen when compared to the urban environment [3]
Healing forests are forest sites possessing physical qualities that can give healing services. The biophysical attributes of the landscape and the physical elements of the environment that affect the comfort of the five human senses when they are in their ecosystem area are used to identify healing forest sites. The biophysical structure and processes of land have a significant impact on the provision of healing services; hence biophysical forest characteristics must be examined. The first step in creating an ecosystem for this health nature therapy is suitable sites within the forest.
2. Methodology
The research location is in Kampung Pasundan Cisamaya (KPC) Mount Ciremai National Park, Kuningan Regency, West Java Province. The research period is 4 (four) months, from December 2020 to March 2021. The KPC area is located in the National Park Utilization Zone at 6⁰48'36.2" South Latitude and 108⁰26'05" East Longitude.
The research stages are: (a) determining the suitability of the KPC site with the standard of site suitability for healing forest, and (b) determining invitation by nature activities at selected location spots. The site standard for healing forests in Indonesia refers to the Draft Indonesian National Standard Number 9006:2021 concerning Forest tourism for health therapy (healing forest). The site standard for healing forests in Indonesia refers to the Draft Indonesian National Standard Number 9006:2021 concerning Forest tourism for health
therapy (healing forest). This Draft is a new SNI with the scope of establishing principles, orientation, location determination, and components as a guide in determining tourist sites in the forest and developing forest tourism programs for health therapy [6]. This forest healing program is a series of tourism activities in a forest ecosystem unit whose site and facilities and management are designed objectively and measurably to create a series of benefits in various health aspects from tourists for promotive, preventive, curative, rehabilitative, preservative and palliative. Physical environment parameters for healing forest locations consist of 6 (six) parameters: vegetation density, temperature and relative humidity, slope level, noise, wind speed, and the negative ion content of the air, as shown in Table 1.
Table 1 Healing Forest Environmental Parameters
| HF Environmental Parameters | Description | |||
|---|---|---|---|---|
| Vegetation Density | Medium to dense vegetation density | |||
| Temperature & Relative Humidity | Provides a comforting effect for the body | |||
| Example: The comfort level in a mountain ecosystem is at a temperature of 20 C to 26 o C and relative humidity of 40% to 80% | ||||
| Slope | 0% to 15% (flat to gentle) | |||
| Noise | < 50 dB | |||
| Wind Velocity | <1 m/second | |||
Source: Draft Indonesian National Standard Number 9006:2021 concerning Forest tourism for health therapy (healing forest)
This research uses drone technology and spatial mapping analysis using a geographic information system (GIS). The prospective locations candidates were obtained from the spatial analysis of the physical environment properties during the comprehensive survey phase. Aerial photo acquisition is collected from a UAV equipped with an RGB camera. The UAV was flown at 09.00-11.00 WIB with clear sky conditions through the Drone Deploy flight mission with an altitude of 250 meters and an 85% overlap. Initial aerial photos were processed using Agisoft Methashape to obtain Orthophoto and Digital Terrain Model (DTM).The physical environmental parameters (i.e., air temperature, relative humidity, light intensity, wind speed, and noise level) were measured at two times (08.00 WIB and 13.00 WIB) for five repetitions using a purposive sampling technique on spatial analysis. Measurements were made using the ET-965 IN 1 Environment Meter. Meanwhile, the recording, documentation, and recording of the GPS position during
observations were carried out using the ODK Collect application.
3. Results and discussion
3.1. Biophysical characteristics of the site
The results of aerial photography using a UAV that has been processed into a Digital Terrain Model (DTM) and aerial photos are used to interpret the slope of the land and the density of the area's vegetation canopy. Drone technology is utilized in spatial mapping to create clearer and more realtime photos than satellite images [13]. The reason for this is because aerial photography is not affected by weather and is not affected by cloud cover. The aerial photo reveals that the location is composed of a heterogeneous forest with a spring in the eastern part (Figure 1). Before established as a conservation area, Kampung Pasundan Cisamaya was an agroforestry area managed by Perum Perhutani. Therefore, tree stands in the area grew naturally or were cultivated, e.g., Macaranga rhizinoides, Pangium edule, Gnetum gnemon, Durio zibethinus, Pinus merkusii, Ceiba pentandra,
Baccaurea racemosa, Pterocarpus indicus, and Artocarpus integra.
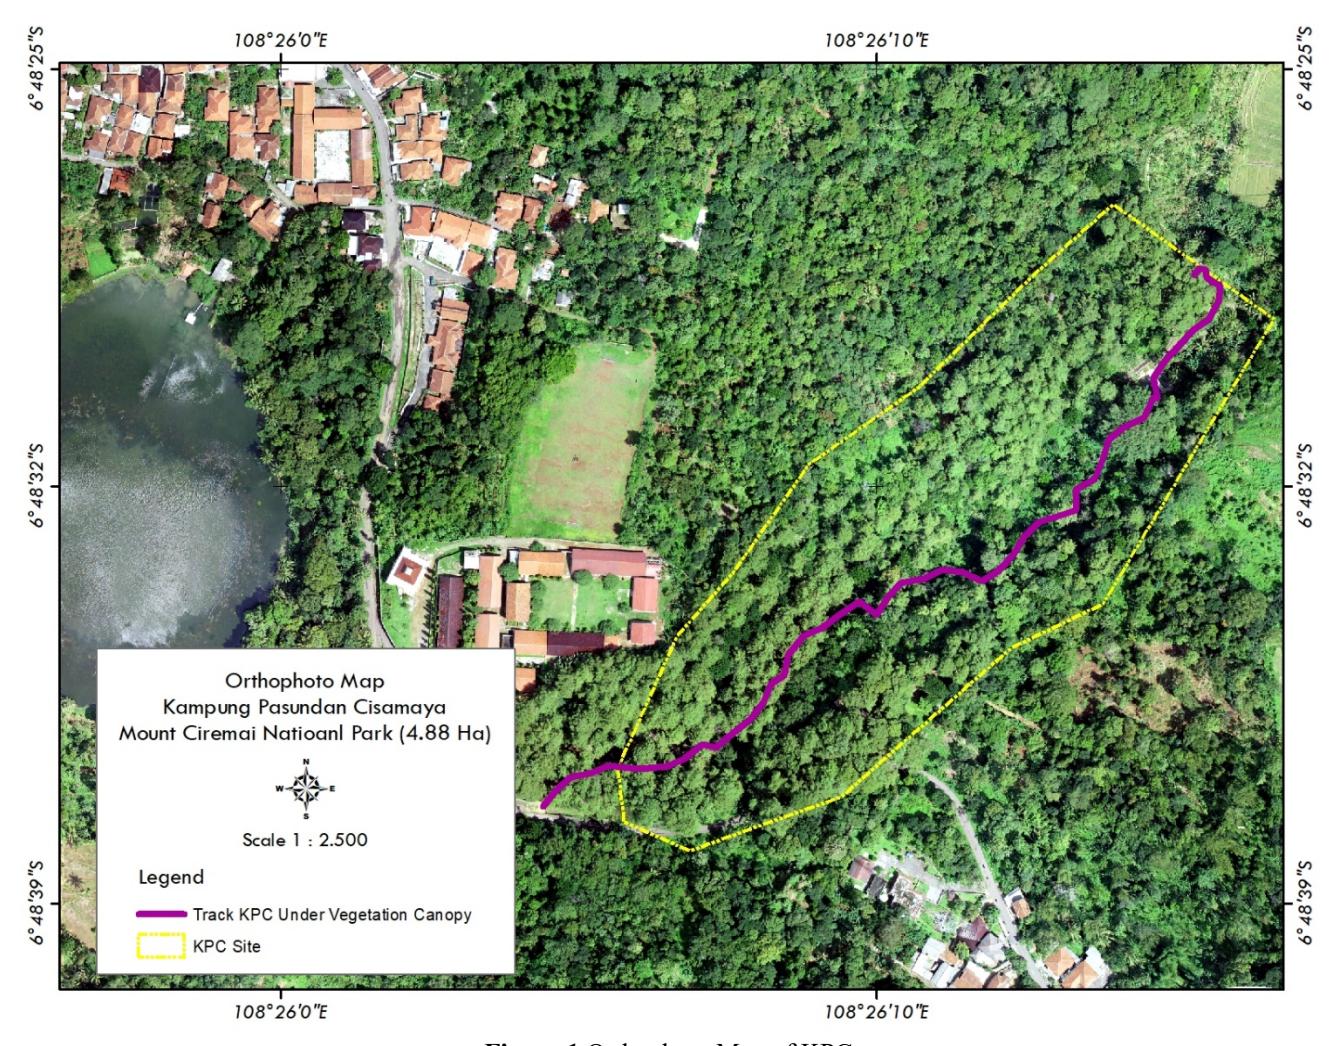
Figure 1 Orthophoto Map of KPC
The aerial photo is used to create a slope and vegetation canopy density map. Based on the land slope obtained from DTM data processing, Kampung Pasundan Cisamaya has a convex topography with a gradient ranging from 0% to 85% with an elevation ranging from 354-414 meters above sea level. The slope in the Kampung Pasundan Cisamaya area can be seen in Figure 2. Based on the classification of slope class in Minister of Public Works Regulation No.41/Prt/M/2007 concerning Guidelines for Technical Criteria for Cultivation Areas, this area is dominated by sloping, steep, to slightly steep land with the acquisition of land percentages of 24.3%, 27.6%, and 29.4% of the total land area, respectively (Figure 2). Meanwhile, land topography with very steep grades was only found in 1.7% of the total land area. An increase in elevation within a certain
limit can have a positive effect on mental health, while land that is too steep will provide physiological stress [10].
Vegetation canopy density is carried out by processing the vegetation index transformation on aerial photographs using the Green-Red Vegetation Index (GRVI) method. The results obtained are vegetation index values in the range of -0.31 to 1, divided into three classes of canopy density, namely rare, medium, and dense classes (Figure 1.c). The GRVI value can discriminate between vegetation (value > 0), water bodies (value = 0), and soil (value <0), according to [15].When detecting grass, the value will be negative. The GRVI value will grow to positive as the measured vegetation density increases. The land in the Kampung Pasundan Cisamaya area is dominated by dense canopy density with a range of vegetation index values between 0.1 and 1 which reaches 88.8% of the total area. The proportion of medium and sparse canopy density with a vegetation index value of -0.31 to 0.1 covered 10.7% and 0.5 percent of the total land area, respectively. The presence of tree stands with high canopy density has more potential to block sunlight and reduce the air temperature in the shade to be cooler than areas with sparse canopy (Sulistyana and Pratiwi, 2011).
3.2. Physical Characteristics of Healing Forestsin KPC
The characteristics of the healing forest ecosystem which are considered to have a relaxing effect on the psychological and physiological conditions of the body are the slope of the land that is not steep, covered with vegetation. It has to provide a comfortable stimulus for the body's five senses (i.e., temperature, humidity, light intensity, wind speed, and noise level) [6]. Meanwhile, the optimal conditions for the parameters of temperature, humidity, noise level, and light intensity use the recovery/treatment room condition approach as stipulated in the Regulation of the Minister of Health of the Republic of Indonesia Number 7 of 2019 concerning Hospital Environmental Health, and Indonesian National
Standard Number 9006:2021 concerning Forest tourism for health therapy (healing forest) [6].
Based on the overlay analysis, three forest sites along the trekking route were thought to provide healing benefits (Figure 3). This location is further investigated by measuring microclimate and noise levels that affect healing services (Table 2). In the morning, the average air temperature is 25.8°C, and in the afternoon, it is 27.8°C. However, the air temperature measurements in the morning and afternoon show an increase and decrease in temperature that is not constant at each site. Because it is surrounded by vegetation, spot A has cooler morning temperatures than spots B and C, with more open landscape structures. At the three locations, the midday temperatures are nearly identical. The relative humidity in the morning and evening at each measurement point does not reveal a noticeable trend in the average relative humidity measurement. Spot C has a lower relative air humidity than the other sites, while spot A has a higher relative air humidity than the rest. This is because spot C is a more open area, where spot A is surrounded by vegetation. Therefore, spot C receives more sunshine, indicating a better evaporation process [12].
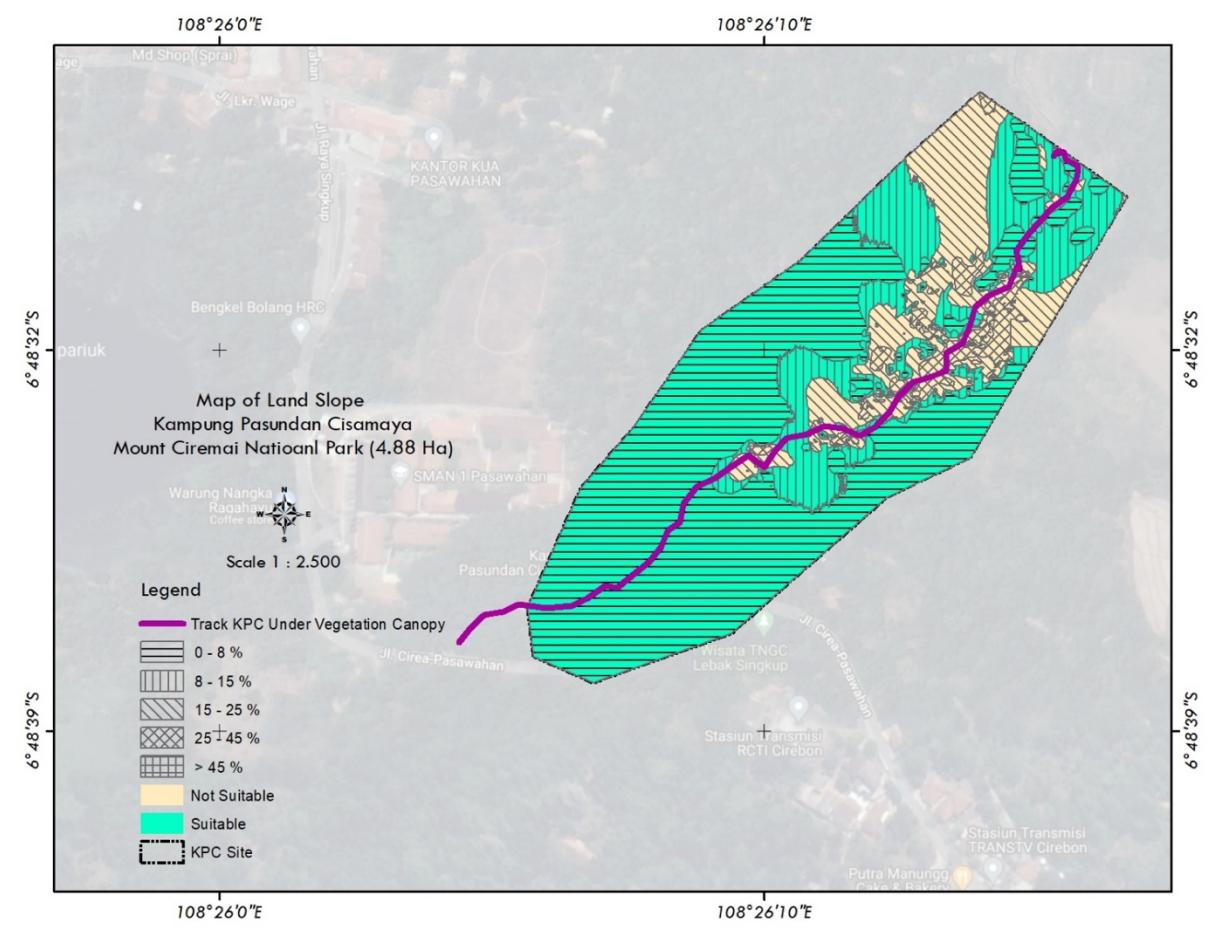
Figure 2 Map of Land Slope of KPC
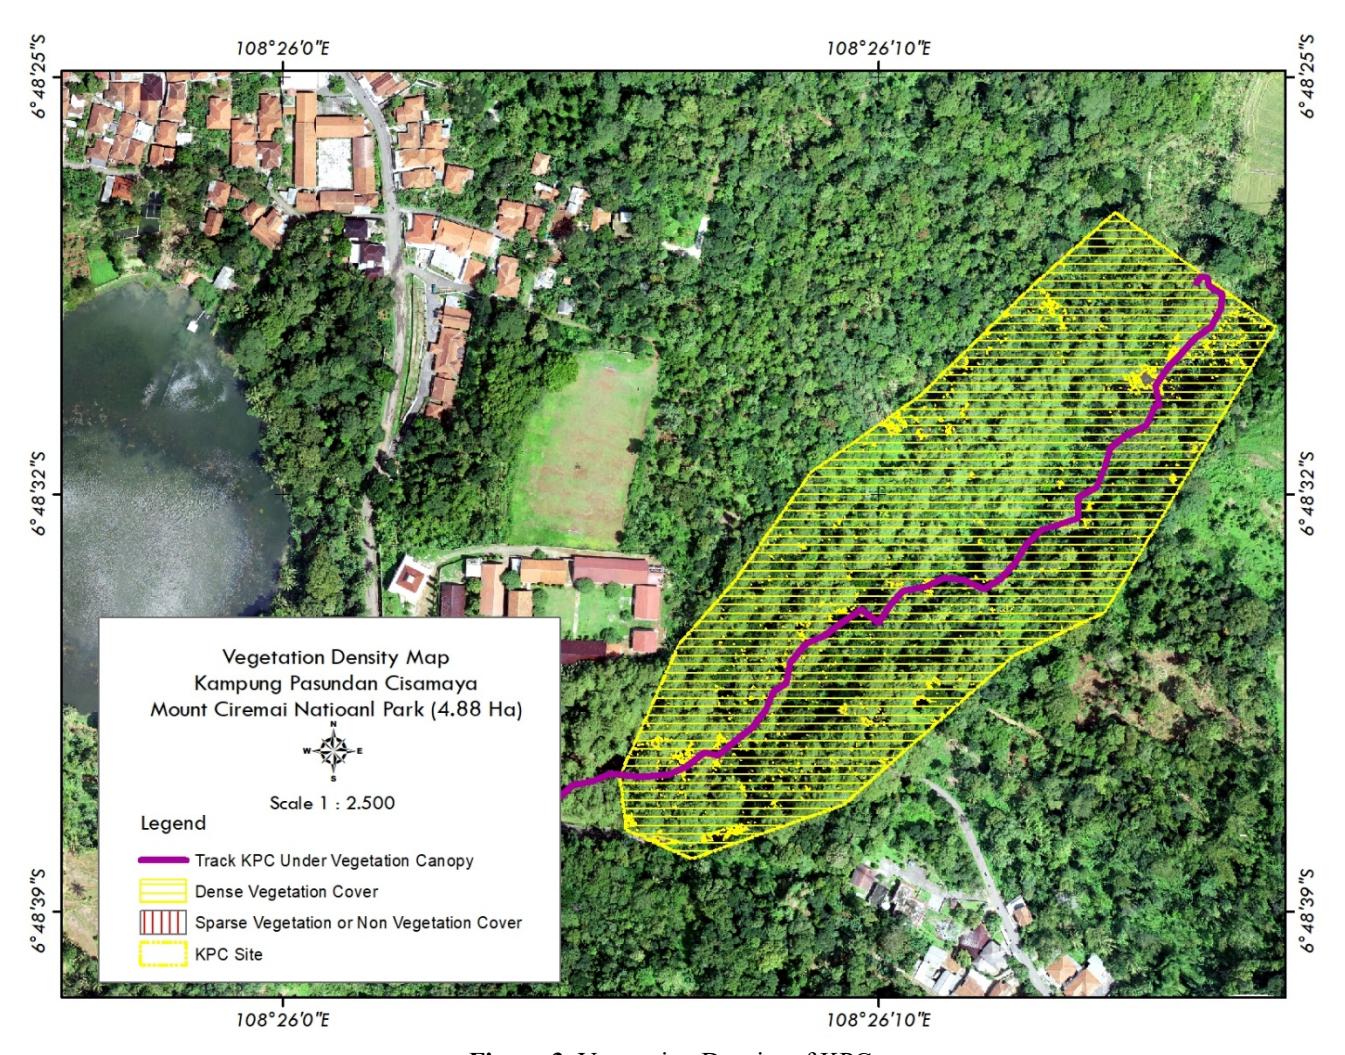
Figure 3. Vegetation Density of KPC
Table 2 Results of the sites' physical characteristics measurements
| Time | Physical Characteristics | |||||
|---|---|---|---|---|---|---|
| Spots | Air Temperature (℃) | Relative Humidity (%) | Light Intensity (Lux) | Wind Speed (m/s) | Noise Level (dB) | |
| Morning | A | 24.61 | 83.41 | 3919.20 | 0.29 | 46.55 |
| (08.00-10.00) | B | 2668 | 74.06 | 3467.00 | 0.20 | 49.60 |
| C | 26.21 | 78.68 | 9506.80 | 0.74 | 59.15 | |
| Afternoon | A | 28.04 | 79.14 | 3960.40 | 0.52 | 48.54 |
| (12.00-15.00) | B | 27.27 | 81.71 | 7588.00 | 0.20 | 41.72 |
| C | 28.17 | 75.38 | 9893.20 | 0.49 | 57.81 | |
The average light intensity was 5,631 Lux in the morning and 7,147 Lux in the afternoon in two time zones. Because the light intensity is direct sunshine, which can approach 10,000 lux, Spot C receives more than 9,000 lux in the morning and afternoon. The existence of vegetation is one of the variables in establishing a microclimate of air
temperature, humidity, and light intensity; the denser the vegetation, the more stable the microclimate (Fitrani et al., 2016). Nonetheless, sun exposure at a particular time is critical for physical and mental wellness in people of all ages. For example, a few hours of morning exposure to 2,500 lux sunshine can boost a person's cognitive ability, attention, performance, and mood[4]. Spot B has a low average wind speed, which is 0.2 m/s, while spot C and A have an average wind speed that is quite felt to be more comfortable than spot B. Wind speed can also affect the concentration of negative ions in the air[15]. Low noise levels and natural sounds are important factors in health tourism and forest bathing activities [2,9.10]. Spot A and B have a pleasant noise level; however, spot C has a noise level of 59.15 dB due to its proximity to a water spring, which is considered tolerable.
3.3. Healing Activities in The KPC Site
The activities in the healing forest site are fun and mindful, relaxing activities. The activities in the healing forest site are fun and mindful, relaxing activities. In some countries, this activity was called forest bathing. People in suitable healing forests will feel comfortable and positively affect health (physical and psychological). Here are some examples [1]: (a) a peaceful mind can reduce stress. Many diseases begin with a stressful mind. The more often a person stay in the forest to heal the tension will reduce the disease symptoms; (b) the clean forest air is good for breathing, as well as inhaling natural aromatherapy from trees in the form of phytoncides which have an impact on immunity; (c) when walking leisurely under the trees (forest), the positive hormone endorphins is released; (d) digital detox against everyday technology that affects health; (e) connect with relaxing nature; (f) natural sounds as nature sound therapy; and (g) boosts a positive mood. To accelerate health effects at the healing forest site, reconnection with nature is established through nature activities. Healing activities at healing forest sites are known as invitations by nature. There are five invitations by nature, i.e., air, vegetation, land, water, and release emotion [rsni, amos]. In one track of the healing forest, there are several spots for the invitation by nature activities. Invitation by air is carried out during healing activities by breathing fresh air from forest ecosystems that are not polluted. Walking barefoot is one of the invitation by nature techniques. As for the invitation by vegetation, water, and release emotion, the site conditions must be analyzed. Figure 4 shows the invitation by nature spots at KPC. There are three spots, i.e., spots for invitation by vegetation, release emotions, and invitation by water.
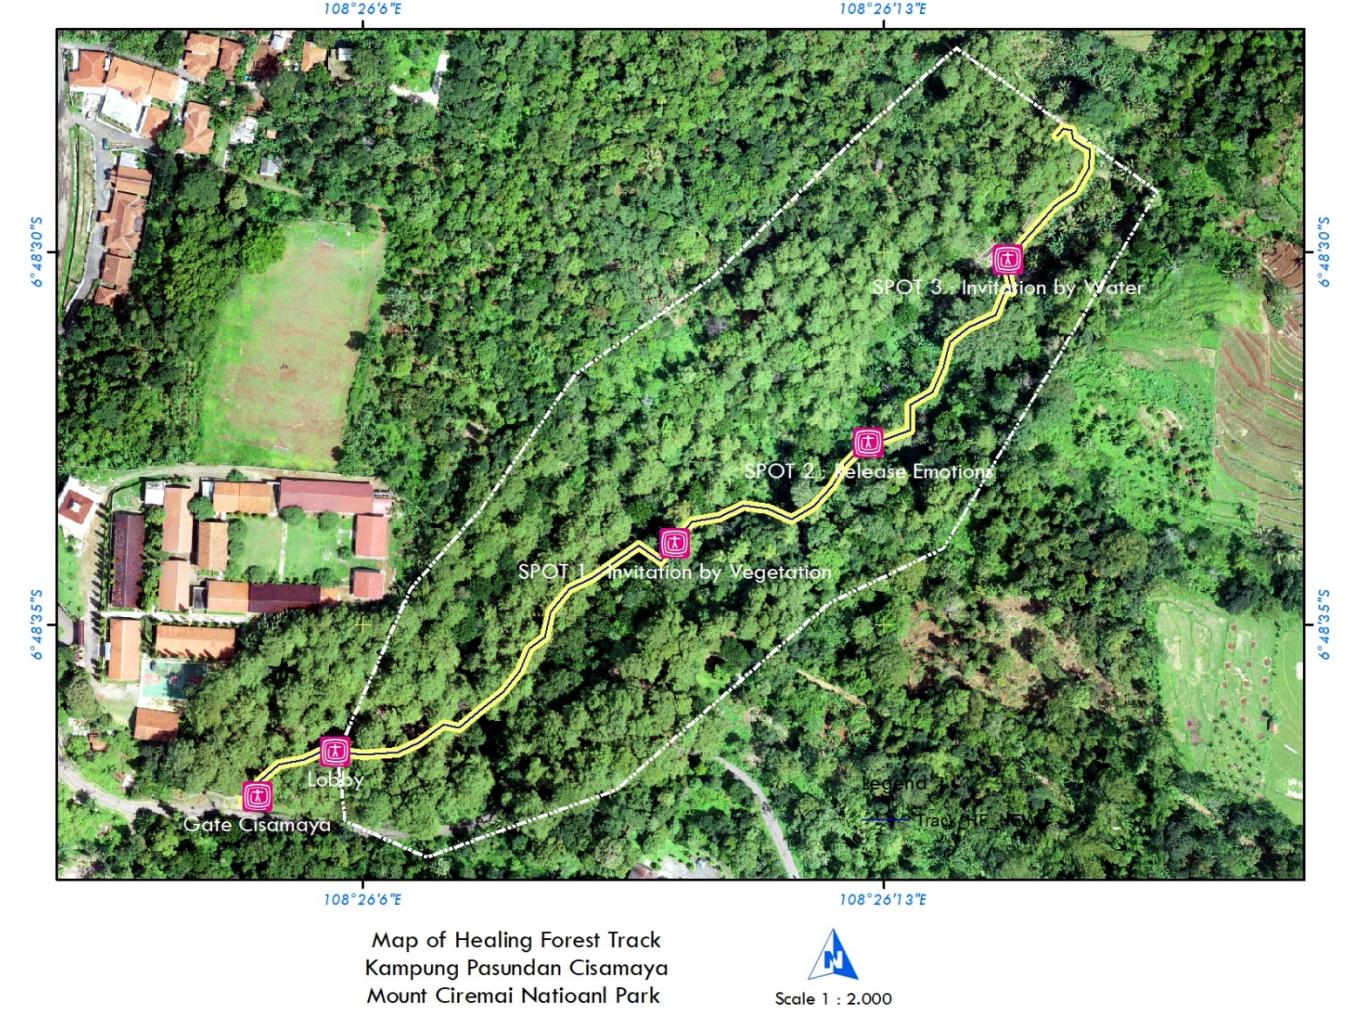
Figure 4. Map of Healing Forest Track in KPC
Invitation by vegetation activities is connecting the body with vegetation as natural elements. Focusing the eyes on the leaves of the trees enhances the relaxation of the eyes. Being near trees that release phytochemicals in the form of inhaled phytoncides also relaxes the body. The relaxation effect is more potent when we hug the tree slowly while breathing well and having mindful thoughts. In the spot to release emotions, we can scream. The spot for emotion release is a spot that is at an elevation lower than the standing point, for example, a valley full of vegetation. The valley absorbs the sound released, so no sound bounces back to the person screaming. Invitation of water is carried out at the water flow spot. We immerse our feet into the water slowly and feel the water calm our feelings.
Invitation by nature activities in forest ecosystems relax the body and reduce stress. By reducing stress, the body will feel fitter and healthier.
4. Conclusion
Kampung Pasundan Cisamaya (KPC) located in the Utilization Zone of Mount Ciremai National Park, is suitable for a healing forest site. Five activities from invitations by nature, namely invitation by air, land, vegetation, water, and emotion release, can be carried out at the KPC site during the healing forest activity. Healing forest activities regularly and adequately have a positive impact on health.
Acknowledgements
Thank you to the manager of Kampung Pasundan Cisamaya (KPC) Kuningan, Gunung Ciremai National Park, for supporting the facilities during the research.