
1. Introduction
North Bandung Area (NBA) is well-known for its natural resources. Its mountain view and cool air make NBA as tourist destination [1,2]. Besides, NBA is also famous for its potential in agriculture. This area has soil and climate that support the development of agricultural business. Some districts in the NBA, such as Lembang, Parongpong, and Cisarua, produce vegetables, fruits, and flowers [3].
Furthermore, NBA is also a protected area based on the Regulation of the Province of West Java Number 2 of 2016 about Guidelines for Controlling the North Bandung Area as a Strategic Area for West Java Province [4]. Adharani and Nurzaman [5] state that NBA has a considerable influence on water management in the area below. Based on the Directorate of Geology and Environmental Management data, 60% of 108,000,000 m3 groundwater flows into the Bandung Basin from the NBA [6]. In addition, NBA is a basin-shaped highland [7]. This area also has several tributaries that flow into the Citarum River [8]. This landscape makes NBA vulnerable to various natural disasters
such as floods, landslides, and erosion [7]. Thus, land utilization in the NBA must be carried out in a controlled manner to maintain the function of water absorption and natural disasters prevention in the NBA and the area below it.
Since 1982, the Government of West Java Province has issued several regulations about the designation of NBA as a protected area. Regulation of West Java Province Number 2 of 2016 stated about Guidelines for Controlling the North Bandung Area as a Strategic Area for West Java Province [4]. These regulations are made in response to the rapid development of settlements and tourism facilities that decrease the function of water system protection and preservation in NBA [2,5,9–11]. However, development permit violations still occur in NBA [12].
The most prominent change in land cover in NBA is the conversion of vegetation into built-up areas, resulting in a decrease in water absorption in this area. Furthermore, it causes various environmental problems in Bandung Basin area, such as disturbances in groundwater reserves and supplies in Bandung City, Cimahi City, Bandung Regency, and West Bandung Regency. As an impact of this environmental problem is drought in dry season [5,13,14]. Moreover, land cover change in NBA can increase runoff that lead land erosion, river sedimentation, flood, and landslide [15–17].
Another environmental problem as a result from escalation of built-up areas in the NBA is increasing Land Surface Temperature (LST) which is defined as temperature of land surface area measured radiometrically, including various land surface components such as vegetation and soil [18]. Man-made structures like buildings and roads usually have low albedo and high heat storage that contribute to rise LST [19]. The negative impact of this phenomenon is reducing human health and comfort [19–21]. Therefore, this study was conducted to describe LST distribution based on land cover types in specific years of 2010, 2014, and 2018.
2. Materials and Method
2.1. Study Area
North Bandung Area (NBA) is about ±485 km2 with altitude varies from 454-2,206 m. This area covers four cities and regencies: Bandung City, Cimahi City, Bandung Regency, and West Bandung Regency. In the northern part of NBA is adjacent with Purwakarta and Subang Regency, in the eastern part with Sumedang Regency, in western part with West Bandung Regency and Cimahi City, and in southern part with Bandung City and Bandung Regency (Figure 1).
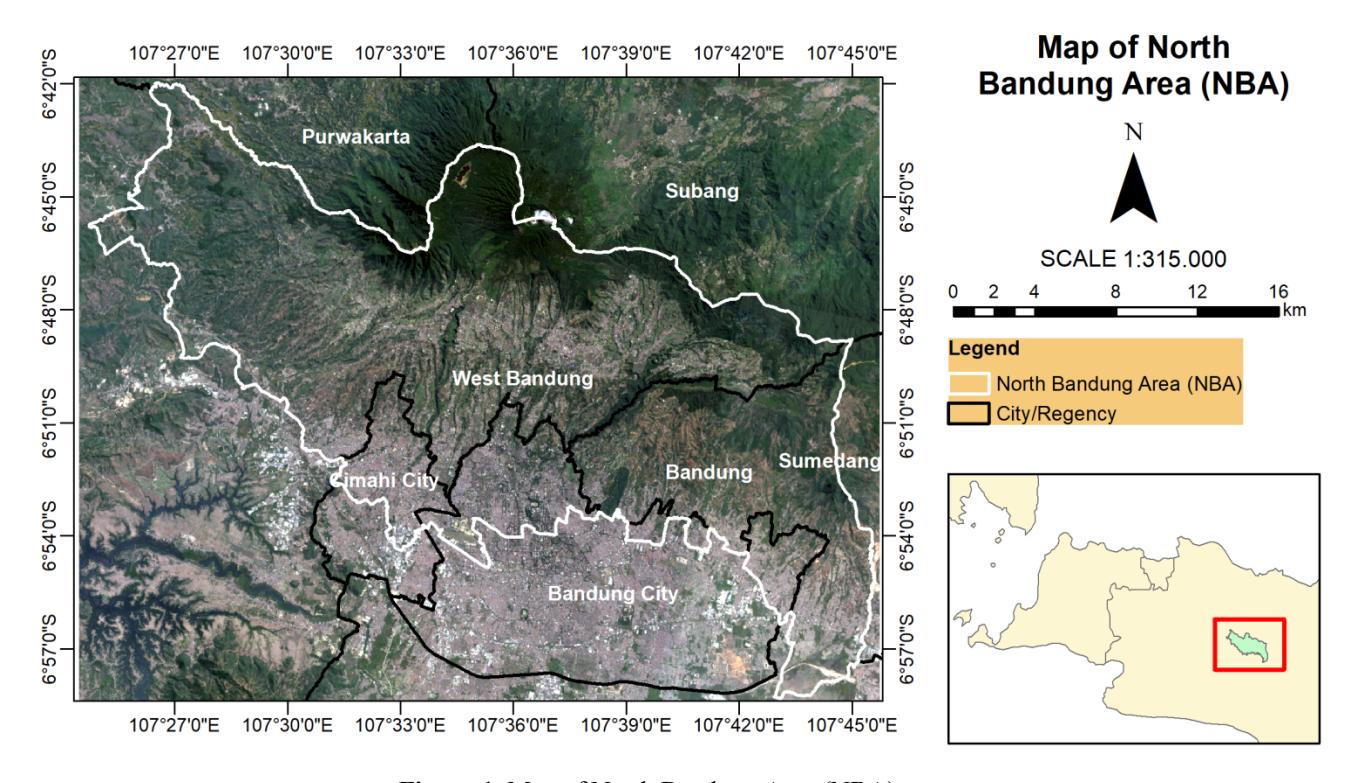
Figure 1. Map of North Bandung Area (NBA)
2.1. Data
Information of this study was obtained from Landsat 5 and 8 Surface Reflectance (SR) Tier 1 imagery data, Peta Rupa Bumi Indonesia or Indonesian Topography RBI administration maps at a scale of 1:25,000, and West Java land cover maps in 2010, 2014, and 2018 at a scale of 1:250,000 developed by Badan Perencanaan Pembangunan
Daerah or Development Planning Agency at Sub-National Level (BAPPEDA) in West Java. Map of NBA was extracted from RBI administration maps, then overlaid with West Java land cover maps from ArcGIS Service Directory BAPPEDA of West Java Province. The acquisition time for Landsat imagery data was based on Phan et al. [22]. Information about Landsat imagery data acquisition time is shown in Table 1.
Type of Landsat Imagery Data Acquisition Time Data Number Use of Data Landsat 5 SR Tier 1 1 June-30 September 2009 and 2010 Landsat 8 SR Tier 1 1 June-30 September 2013 and 2014 1 June-30 September 2017 and 2018 17 LST mapping in 2018
Table 1. Time and Numbers of Acquired Landsat Imagery Data.
2.2. Methods
2.2.1.Classification of Land Cover Classes
The NBA map is classified using ArcMap 10.4.1 into four classes, i.e., built-up areas, vegetation, water bodies, and open areas [23] (Table 2). According to Saha et al. [23], these four land cover classes were based on the sensitivity of an object on the earth's surface to certain wavelengths of electromagnetic radiation that were detected by a specific band on the satellite sensor.
2.2.2.Land Surface Temperature (LST) Calculation
Method from Sultana and Satyanarayana [24] is used to calculate LST. The calculation was carried out by using Google Earth Engine. First, the cloud covers in the obtained Landsat image collection were masked using cloud masking. The Landsat image collection was then merged into one Landsat median composite image. Later, this image was clipped by RBI administration maps of NBA to obtain Landsat median composite image. Then, LST was calculated from Landsat median composite image.
Four variables are needed to calculate LST. The first variable is the Normalized Difference Vegetation Index (NDVI). This variable was calculated by using Equation 1.
\[NDVI = \frac{NIR - R}{NIR + R} \tag{1}\]
NIR in Equation 1 is a value of surface reflectance of the NIR band, and R is a value of surface reflectance of the red band. In Landsat 5, NIR and red bands are found in bands 4 and 3, respectively. In Landsat 8, NIR and red bands are found in band 5 and 4, respectively.
The second variable is fractional vegetation (PV). PV value was calculated by using Equation 2.
\[P_{V} = \left[\frac{NDVI - NDVI_{\min}}{NDVI_{\max} - NDVI_{\min}}\right]^{2} \tag{2}\]
NDVImax is a maximum value of NDVI, while NDVImin is a minimum value of NDVI. After the PV value was obtained, the value of variable \(\epsilon\) (emissivity) can be calculated by using Equation 3.
\[\varepsilon = 0.004 \times P_V + 0.986\] (3)
The value of the brightness temperature (TB) is then calculated. In Landsat 5 dan 8 SR Tier 1, the value of brightness temperature is found in the thermal band. Hence, the TB value can be calculated by using Equation 4.
\[T_B = Thermal \times 0.1_{(4)}\]
The thermal band in Landsat 5 is found in band 6, and the thermal band in Landsat 8 is found in bands 10 dan 11. Due to the stray light issue in band 11 [25], this study only used band 10 in Landsat 8. In Equation 4, the value of 0.1 is a scale factor of the thermal band. TB value in Equation 4 is obtained in units of Kelvin.
After the values of the four variables are obtained, LST can be calculated. LST is calculated by using Equation 5.
\[LST = \frac{T_B}{(1 + w\frac{T_B}{p}\ln[\varepsilon])} - 273.15\] (5)
In Equation 5, w is the wavelength of emitted radiance. The w value for Landsat 5 band 6 is 11.5 \(\mu\)m, while the w value for Landsat 8 band 10 is 10.8 \(\mu\)m [26]. The p constant has a value of 1.438 X 10⁻²m · K. This value is obtained from Equation 6.
\[p = h \times \frac{c}{\sigma} \tag{6}\]
In Equation 6, h is Planck constant with a value of 6.626 X 10⁻³⁴ J\(\cdot\)s. Variable c is the velocity of light with a value of 2.988 X 10⁸ m/s. Variable \(\sigma\) is Boltzmann constant with a value of 1.38 X 10⁻²³ J/K.
Table 2. New Land Cover Classes that Included Old Land Cover Classes
| New Land Cover Classes (Saha et. al., 2020) | Old Land Cover Classes from BAPPEDA West Java |
|---|---|
| Built-up areas | Built-up areas (including settlements, industries, and buildings) |
| Vegetation | Forest |
| Water bodies | River/Lake/Reservoir |
| Open areas | Garden/Plantation, Field, Rice Field, Shrubs |
2.2.3.Data Analysis
LST range classes in 2010, 2014, and 2018 was classified from NBA map, then mean LST in each year in different land cover class were analysed to clarify the significance of mean LST of NBA and the mean LST of each land cover class in the three observed years. Classification of LST range classes was carried out by using equal intervals method [27] in ArcMap 10.4.1. LST maps of NBA were classified into five classes based on Sun et al. [28] as shown in Table 3.
Table 3. Classification of LST in NBA
| LST Class Type | Temperature Range (°C) | |
|---|---|---|
| Very Low | 0-15.7 | |
| Low | 15.7-20.3 | |
| Medium | 20.3-24.8 | |
| High | 24.8-29.4 | |
| Very High | 29.4-33.9 | |
Kolmogorov-Smirnov normality test was used to observe LST data distribution both in NBA and in each land cover class. In addition, Kruskal-Wallis and Post Hoc Kruskal-Wallis test was used to observe whether there are significance differences among mean LST of NBA and mean LST of each land cover class in the three observed years.
3. Results and discussion
3.1. Change in Mean LST of NBA and Mean LST of Land Cover Classes
Land surface Temperature in three observed years show significant difference from 2010 (22.53±2.72°Ca ) to 2014 (23.64±2.87°Cb ) and 2018 (23.40±3.06°Cb ), however mean LST from 2014 to 2018 has slightly change as shown in Table 4.
Table 4. Mean LST of NBA in the Three Observed Years
| Year | |||
|---|---|---|---|
| NBA Mean LST±Standard | 2010 | 2014 | 2018 |
| Deviation (°C) | 22.53±2.72 (a) | 23.64±2.87 (b) | 23.40±3.06 (b) |
*Mean LST with the same letter are not significantly different
Mean LST of each land cover class in 2010, 2014, and 2018 can be seen in Table 5. Built-up areas show the highest mean LST (24.98±1.93 in 2010; 26.46±2.09 in 2014, and 26.30±1.96 in 2018) and area with vegetation has the lowest LST (18.29±2.10 in 2010; 19.78±1.87 in 2014, and 19.61±2.15 in 2018). This trend is similar to study conducted by Sun et al. [28], Peng et al. [29] in China, and Saha et al. [23] in India related to calculation of LST in different land cover types.
Table 5. Mean LST of Land Cover Classes in the Three Observed Years
| Land Cover Class | NBA Mean LST±Standard Deviation (°C) | |||
|---|---|---|---|---|
| Year 2010 | Year 2014 | Year 2018 | ||
| Built-up Areas | 24.98±1.93 (a) | 26.46±2.09(b) | 26.30±1.96 (b) | |
| Water Bodies | 22.22±1.97 (a) | 23.70±3.26 (b) | 23.14±2.73 (ab) | |
| Open Areas | 22.30±2.12 (a) | 23.16±2.28 (a) | 22.97±2.35 (a) | |
| Vegetation | 18.29±2.10 (b) | 19.78±1.87 (a) | 19.61±2.15 (a) | |
*Mean LST with the same letter in the same row are not significantly different
3.2. Distribution of Land Cover Area and Temperature Class in NBA
The largest land cover area in NBA is open areas (garden, agricultural land, plantation, field, rice field, and shrubs) which are commonly found in West Bandung Regency and Bandung Regency in the three observed years (Figure 2). Based on the Government of West Bandung and Bandung Regency data, agricultural lands are spread over several districts such as Lembang, Parongpong, Cisarua, Cimenyan, and Cilengkrang. These areas have suitable environmental conditions (cool temperature and volcanic soil) to support agriculture [30]. These areas are classified as medium LST class. The percentage of open areas in NBA is about 67.56%, then 27.73% of built-up areas and 14.70% for vegetation (Figure 3).
Built-up areas which are covered by settlements, industries, and buildings show high and very high LST classes (Figure 2). This land cover class is mostly found in Bandung and Cimahi City. In addition, some built-up areas are also found in Cileunyi, Ngamprah, Cisarua, Parongpong, and Lembang District (Figure 2). The percentage of the built-up regions increased from 2010 (22.84%) to 2018 (27.73%) (Figure 3) due to various factors, such as the nice natural view [2], development of tourism activities [1,31], availability of good infrastructure (road) [6], urban expansion of Bandung City [9,10], and the development of industry and urban areas in West Bandung Regency [3].
Built-up areas are related to high temperatures due to several factors such as waterproof surfaces that decrease evaporation and materials with high thermal diffusivity; thus these physical properties will increase heat storage during the day and slow heat release at night. [23,32]. The components of built-up areas generally have high surface albedo that increases LST in this land cover class [19].
The term vegetation in this study refers to forests found in the northern part of the West Bandung Regency (Figure 2). Forest cover in some areas such as in Cimenyan and Cilengkrang District shows a prominent increase from 2014 (10.29%) to 2018 (14.70%) due to the reforestation program led by Perhutani [33,34]. The result from land cover change data in NBA by Samodoro et al. (2020) also shows similar results; forest cover in this area increased from 2015 (4,400.51 ha) to 2018 (6,669.84 ha) [35]. Forested areas show low and very low LST classes. Vegetation decreases LST by its shading effect, therefore reducing solar energy to the soil surface. These maps cannot determine water bodies because the area is too small (Figure 2).
The percentage area with a medium and low class of LST decreased from 2010 (61.29%; 19.02%) to 2018 (51.68%; 15.99%). Meanwhile, there is a significant change of highclass LST from 2010 (18.67%) to 2018 (30.29%) (Figure 4). Even though the forested area increased due to the reforestation program, a high percentage of the built-up regions negatively impact land surface temperature. Therefore, reforestation or rehabilitation programs should be expanded in open areas to lowering surface temperature. This result aligns with the study conducted by Lin et al. (2018) in Hangzhou, China, from 1990-2010 [36]. This data shows that the increase in heated areas was directly proportional to the rise in urban areas.
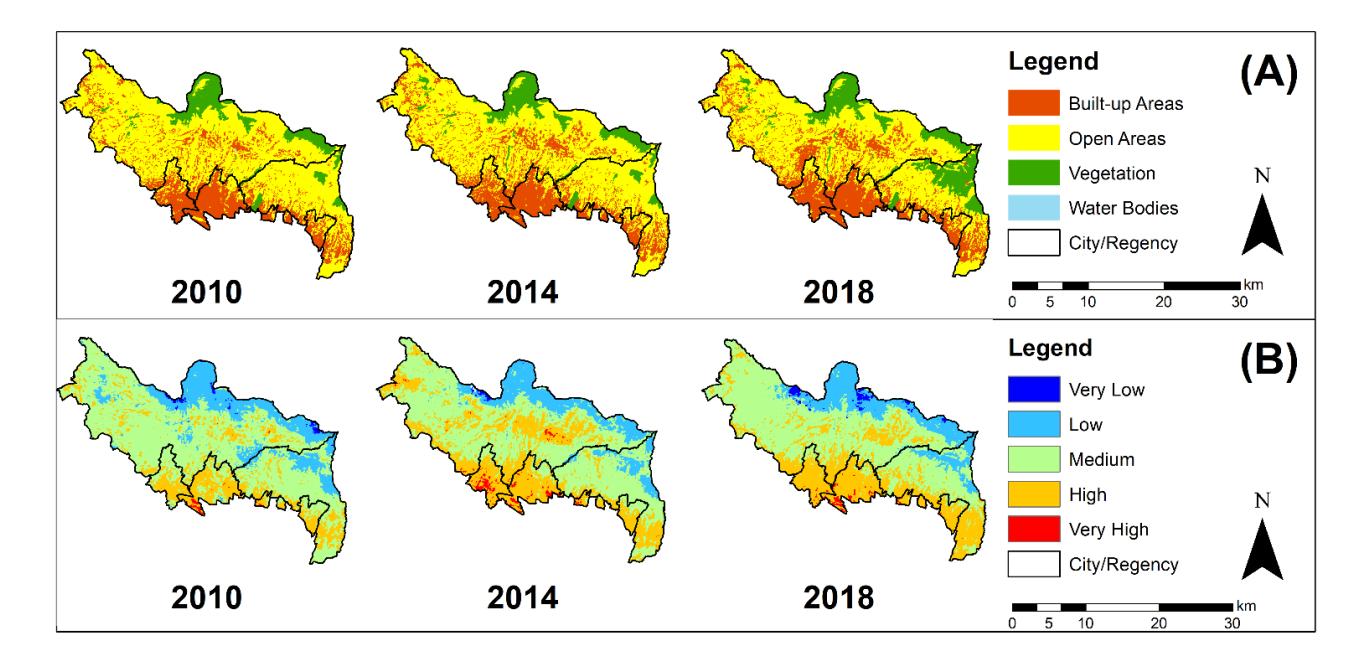
Figure 2. Maps of the Distribution of the Land Cover Class (A) and the LST Class (B) in NBA in the Three Observed Years
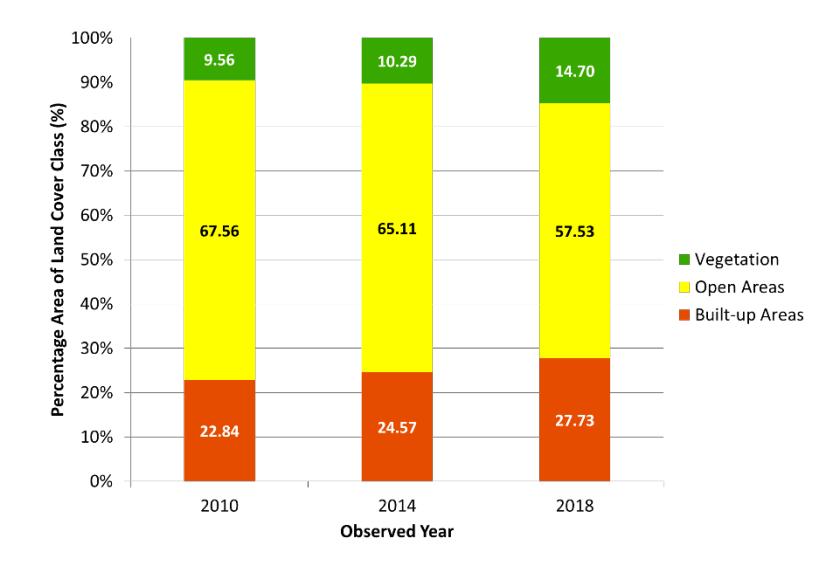
Figure 3. Percentage Area of Land Cover Class in NBA in the Three Observed Years
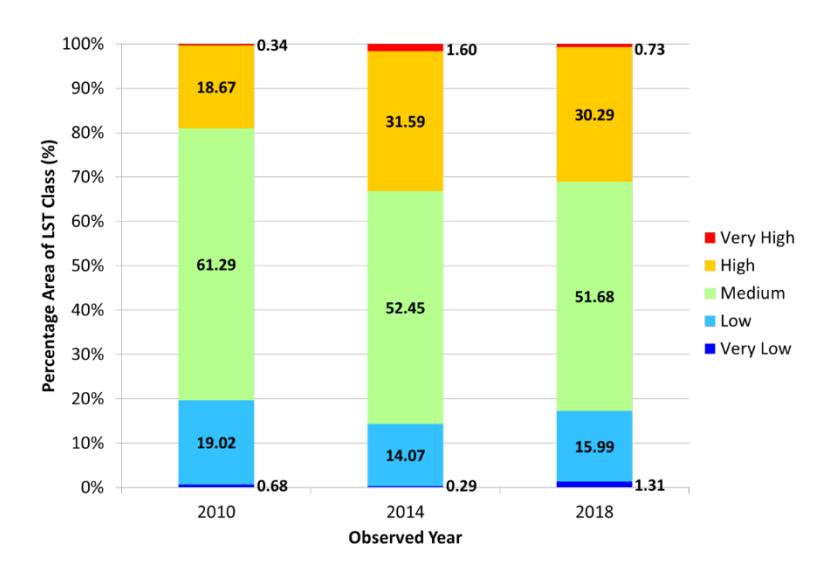
Figure 4. Percentage Area of LST Class in NBA in the Three Observed Years
Land surface temperature is affected by factors, e.g., weather, physical properties of a surface, type of surface material, material structure, surface color, and surface roughness. These material characteristics will affect thermal diffusivity, which indicates how easily heat can penetrate a material [32]. In addition, the water content will affect LST in terms of the cooling process through evapotranspiration. Especially in urban areas, the geometry of the street and Sky View Factor (SVF) also affected LST [37].
3.3. The Implication of Findings
There is a significant change of land cover area in NBA from 2010-2018. Studies related to the land cover change in
NBA showed terrible impacts on the environment. Expansion of the built-up regions in the NBA can decrease the water catchment area, reducing the water reserves and supplies in Bandung City, Cimahi City, Bandung Regency, and West Bandung Regency [5,14]. In addition, NBA has a quite high level of landslide vulnerability. The existence of fields and settlements in this area will exacerbate the level of landslide vulnerability [38]. NBA also has several tributaries that flow into Citarum River [8]. The decrease of vegetation cover in this area will cause an increase of runoff and erosion. Erosion will cause river sedimentation that makes the capacity of the river to decrease. This impact will result in a flood in the upstream area of the river and the area below it [17].
Also, the increase of LST in the NBA negatively impacts human health and comfort [19–21]. According to Arifwidodo et al. [20], negative impacts of high LST on human comfort include sleep deprivation, decrease in daily travel time, and increase in sedentary behavior, which is behaviors with less physical activities. The increasing LST will result in heat stress and other heat-related diseases in humans. Besides, several studies found that an increase in LST will encourage the use of air conditioning in households which causes electrical energy consumption to increase [20]. This impact will increase greenhouse gas emissions that result in global warming [39].
To prevent the negative impacts of land cover change in NBA, several actions should be taken, including limitation of constructed building development, providing a proportional green open space, maintaining forest cover, and expanding vegetated cover as stated in Regulation of the Province of West Java Number 2 of 2016 [4].
4. Conclusion
Land cover change in NBA from 2010 to 2018 caused an increase in LST. The percentage of open areas in the NBA decreased from 67.6% to 57.5%. Meanwhile, vegetation and the built-up regions increased from 9.6% to 14.7% and 22.8% to 27.7%, respectively. Medium class of LST in NBA shifts from 61.3% to 51.7%; low LST class decrease from 19% to 16%; and high LST class increases from 18.7% to 30.3%. Built-up areas are found in high and very high LST because they have material characteristics that decrease evaporation and increase thermal diffusivity. Therefore these physical properties can store heat during the day and slow heat release at night.