
1. Introduction
The Sciaenidae family includes 70 genus and 270 species [1] with geographical distribution, including the Atlantic, Indian, and Pacific oceans. Some sciaenid species can be considered to have a commercial value for aquaculture production, the red drum (Sciaenops ocellatus) [2] and the yellow croaker [3]. In Indonesia, the production of Sciaenidae accounted for 12,404 t, ranked as the second most commercial fish caught [4]. Several Sciaenids are new to aquaculture and have good aquaculture potential worldwide, e.g., Argyrosomus japonicas distributed in Australia, southern Africa, and Taiwan; Sciaena umbra found in Greece and Turkey; S. ocellatus inhabits China, USA, Israel, Mexico, and Taiwan; Umbrina cirrosa distributed in Cyprus, Spain, Greece, Italy, and Turkey; and A. regius inhabits Spain,
Egypt, France, Italy, Morocco and Turkey [5]. Advantages of Sciaenids to be a commercial aquaculture species are due to their relatively easy broodstock management, fast growth rate, and good feed conversion ratios [5].
In Indonesia, Sciaenids have been the dominant species caught from estuaries. Sciaenids are an important stock in Malaka waters besides fishes from Scaridae, Mullidae, and Nemipteridae families. Sciaenids were dominant in waters from Panipahan in Riau Province to Tanjung Balai, Asahan in North Sumatra [6]. Among other Sciaenids, Johnius belangerii is the most caught and consumed species [6]. Besides this species, other Sciaenids that have commercial value is Otolithoides pama. The biomass of O. pama accounted for 0.49% of the total biomass of fish caught in the Barito estuary [7].
O. pama was also caught from Pasuruan water [8]. Another commercial Sciaenid found in the estuary is Panna microdon. In the Mayangan estuary in West Java, P. microdon is among eight Sciaenids inhabiting this estuary [9]. O. pama and P. microdon in estuaries indicate that the estuary is an essential ecosystem for Sciaenids.
One of the important estuaries in Indonesia is the Musi estuary. This estuary located on the east coast of Sumatra Island receives three rivers from the mainland. The river delivering nutrient combined with mangrove covers in the estuary has made this estuary has a high biodiversity of estuarine species, including the commercial species. Previous research [10] in 2006 has caught and recorded 107 fish species, including shrimp species. Sciaenid was recorded as the dominant fish family in one of the rivers in the Musi estuary. Current research in 2021 [10] has confirmed a significant increase of estuarine fish annually in Musi. Even the last record shows there were up to 10 fish families in Musi.
Despite the high diversity of estuarine fish species, Musi estuary has been threatened by pressures ranging from land-use conversion and pollution nearby Musi's intact ecosystem. In an aquatic ecosystem, pollution has significant effects since it can spread poison and hazardous material that can spread rapidly following the river current. One pollution in the aquatic and marine ecosystems is the presence of anthropogenic marine litter (AML) [11, 12, 13], including plastic litters. AML is transported by rivers to the river mouth and estuary and is often eaten by estuarine fishes, concentrating toxic chemicals in fish tissues and filling their stomachs, causing fish to starve. Plastic aquatic debris is much more than a mere aesthetic problem. Despite growing research on fish diversity in the Musi estuary, research on how the plastic litters and water quality affect the Sciaenid's fish population is still limited. Then this study first aims to map the spatial distributions of 2 Sciaenid's species, including P. microdon and O. pama, water quality, chlorophyll a, and anthropogenic marine litter, in this case, is plastic litters Musi estuary. Secondly, the correlations of Sciaenids with the water quality, chlorophyll a, and plastic litters are also assessed. The results of this study will contribute to the conservation of Sciaenids in supporting the sustainability of the estuarine fishery in Musi.
2. Methodology
2.1. Study Area
The study area was an estuary ecosystem located in the Musi river mouth (Figure 1) with a longitude of 104.80 - 104.90 East and a latitude of 2.30 -2.40 South. The studied ecosystem is adjacent to the Bangka Strait in the north and receives water from three rivers in the south, i.e., Banyuasin in the west, Musi in the central, and Upang in the east. The width of Banyuasin is 1,670 m, Musi is 712.7 m, and 926.3 m for Upang. Banyuasin has a water flow rate of 0.344 m/sec [14]. While the debit of Musi river was ranging from 1.08 m3 /sec. to 22.15 m3 /sec. [15, 16]. The depth of the Musi river was 7 m due to the sedimentation. In comparison, Banyuasin depths varied from 0.17 m in the shallowest point downstream to 9.91 m upstream. Shallow parts of Banyuasin were related to the sedimentation [17]. Musi estuary ecosystem was dominated by swamp and wetland. This ecosystem receives average daily rainfall ranging from 65.22 m to 76.81 mm [18]. The sampling locations in the study area consisted of three locations in each river mouth, giving a total of nine locations. Sampling location in Banyuasin covers 162.94 km2 , in Musi 103.6 km2 , and 48.27 km2 in Upang. Sampling locations were located from upstream, central, to downstream. Samplings were done weekly on April 2020, giving a total of four sampling times. The samples were taken in April 2020, considering this month represented a transitional season representing fish species both from dry season ended up in March and wet season started in May.
2.2. Water quality survey
Water quality surveys include in situ chlorophyll-a, dissolved oxygen (DO), salinity, sediment, temperature, and transparency. Those variables were measured in each sampling location with three replications for each location (Table 1). The chlorophyll a was measured using YSI 6025 chlorophyll probe, DO and temperature were measured using multi-parameter (Lutron DO 5510), salinity with a refractometer (Atago), and transparency with a Secchi disk. The geographical locations of samplings were recorded using Etrex Garmin GPS handheld. Sediments were collected from the bottom of the river [19] using Ekman grab sampler and sieved using sediment sieves [20] sizing 0.075 mm [21].
2.3. Fish survey
The fish survey followed methods from previous studies [22, 23]. Fish samples were taken using gillnet with a mesh size of 2 inches [24] and identified using the fish identification guide book [25, 26]. Fish samples then were calculated for a frequency (%) of appearance using the following equation:
frequency = \[\frac{\text{number of fish species i caught}}{\text{Total number of species caught}} \times 100\%\]
2.4. Anthropogenic marine litter (AML) survey
The AML assessment was conducted in situ in the surface water of Musi estuary in designated sampling locations. In each sampling location, the survey was conducted within a 1 m x 1 m grid, and there was a 1 m2 grid
randomly located in each sampling location. Then the collected AML samples were weighed. The litter was defined as numbers of items/m2 and weights of items (gr/m2 ). The AML survey and collection emphasized and included all non-organic discarded materials made of plastic, e.g., bags, bottles, cups, packaging, sheets, and straws [27, 28, 29, 30, 31]. The selection of plastic as AML samples was based on the consideration that plastic has a long degradation time. Then the organic AMLs, including rubber and wood, part of the house, boat, and tree, were excluded from the samples.
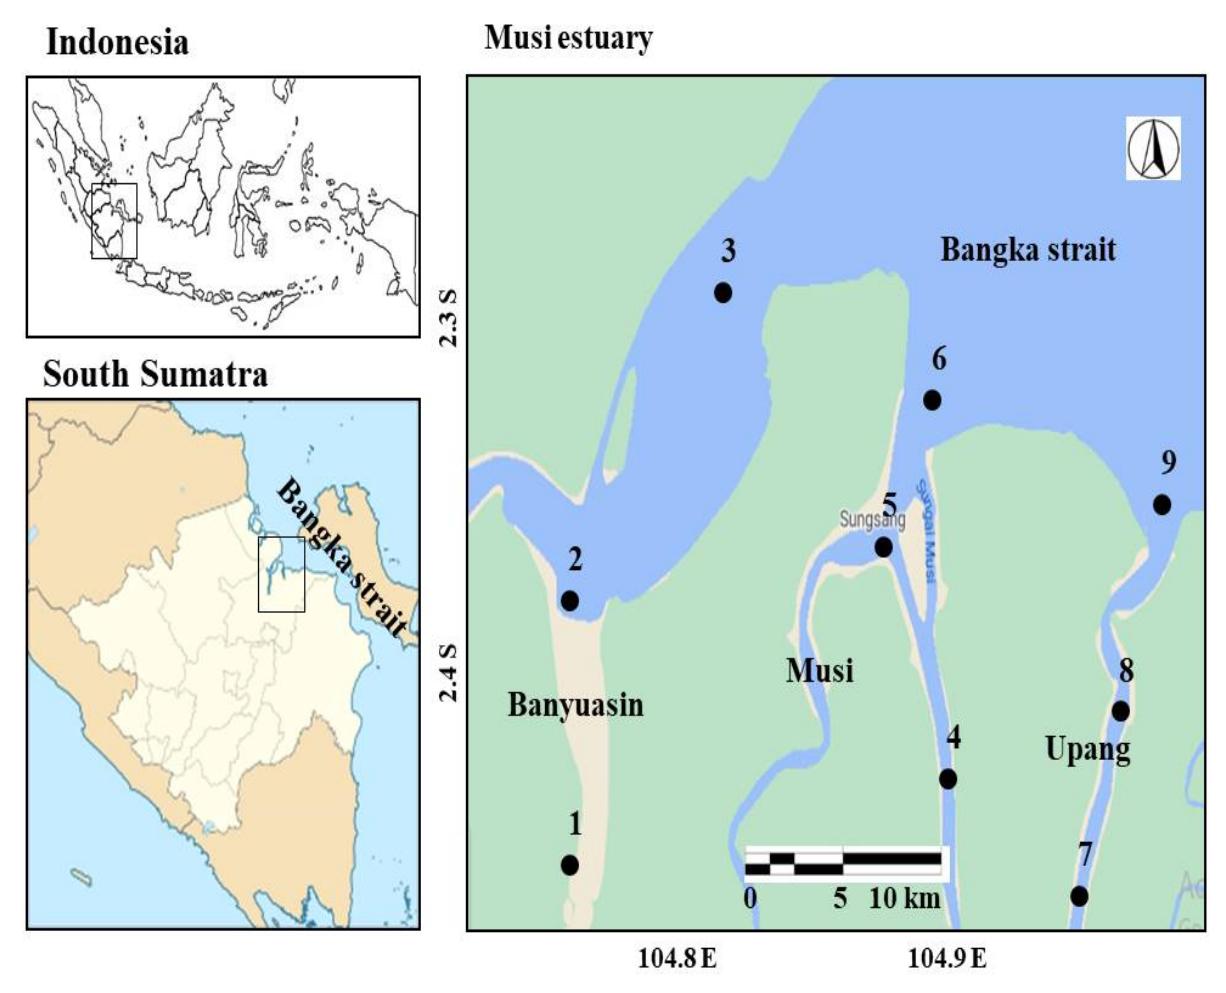
Figure 1 Nine sampling locations (1-9) in 3 river mouths (Banyuasin in west, Musi in central, Upang in east) of Musi estuary, South Sumatra Province
Table 1 Water quality variables
| Variables | Unit | Measurement methods | ||
|---|---|---|---|---|
| Chlorophyll a | mg/m3 | YSI 6025 chlorophyll probe | ||
| Dissolved oxygen (DO) | mg/l | Lutron DO 5510 multi parameter | ||
| Anthropogenic Marine | Item/m2 , gr/m2 | 1 m x 1 m grid survey | ||
| Litters | ||||
| Salinity | ‰ | Atago refractometer | ||
| Sediment | na | Ekman grab, sieve | ||
| Temperature | 0 C | Lutron DO 5510 multi parameter | ||
| Transparency | cm | Secchi disk | ||
| Geocoordinate | Decimal degree | Garmin Etrex GPS handheld | ||
2.5. Mapping and spatial analysis
Mapping and spatial distribution analysis of fish, water quality, chlorophyll a, and AML consisted of developing the presence map of those variables and then interpolating those variables' patterns. First, the recorded geocoordinate of fish, water quality, chlorophyll a, and plastic litter variables in each sampling location were inserted into a table. Then, the recorded data in the table were mapped using Geographical Information System (GIS) with ArcView version 3.2 to pinpoint the geolocations of fish, water quality, chlorophyll a, and plastic litter variables in 3 sampled river mouths in Musi. To create a pattern map, the GIS tables containing fish, water quality, chlorophyll a, and plastic litter variables were interpolated [32, 33, 34].
2.6. AIC data analysis
Sciaenid population correlations with water quality and AML were analyzed using Principal Component Analysis (PCA) and modeled using Akaike Information Criterion (AIC) following Cavada [35]. The AIC was developed using linear regression. The measured parameters included in AIC, residual standard error, R-squared, P and F values, and % contribution of each covariate. To build the model using R version 4.1.1, 5 covariates correlating with Sciaenid population explanatory including salinity, temperature, transparency, AML measured in items/m2 and gram/m2 were included in the analysis to develop the model. The best model was selected based on the model that has the lowest AIC values.
3. Results and discussion
3.1. Sciaenidae spatial distribution
This paper assesses the spatial distribution of two Sciaenid species. Those species are Otolithoides pama and Panna microdon. In 3 river mouths in the Musi estuary (Figure 2), frequency ranges of O. pama (11.1-17.9%) were higher than P.microdon (8.1-11.6%) and indicating O. pama was more dominant. Among 3 river mouths in Musi, the highest O. pama population with a frequency up to 17.9% was observed in the eastern parts of Musi estuary or the Upang river, mainly in the river mouth areas. In the central parts of the estuary or the Musi river mouth, the O. pama population was lower than other populations in Banyuasin and Upang river mouths.
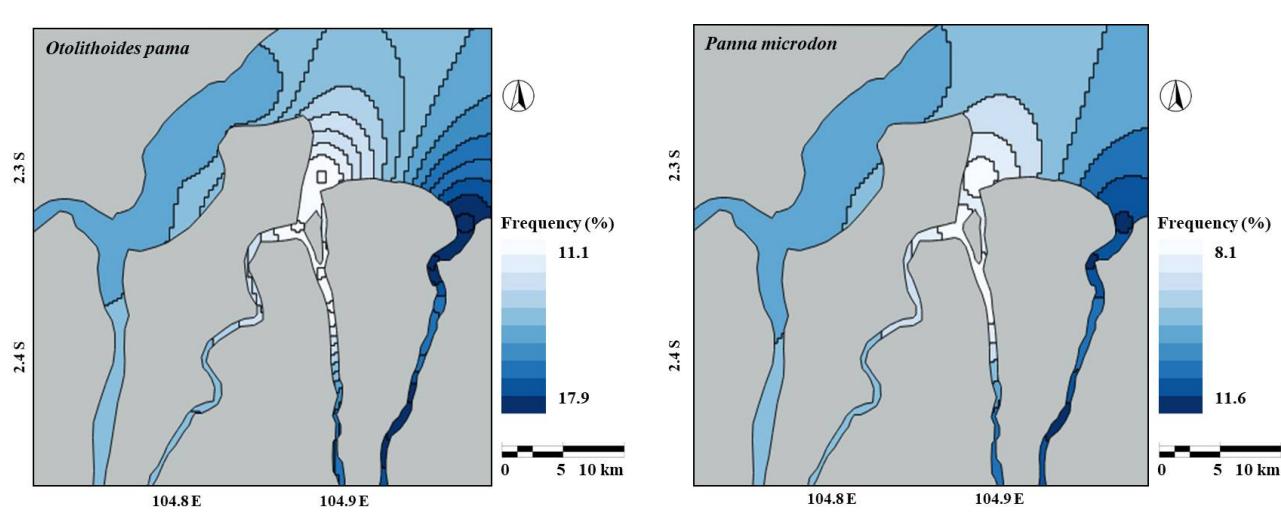
Figure 2. Frequencies (%) of Otolithoides pama (11-17.9%) and Panna microdon (8.1-11.6%) in 3 river mouths of Musi estuary, South Sumatra Province.
A similar spatial distribution was also observed for P. microdon. The lowest P. microdon frequencies were also observed in the Musi river mouth. Then the population increased in the western parts of the Banyuasin river mouth, and the highest population was observed in the Upang river mouth in the east. In this river mouth, the P.microdon frequencies can be high as 11.6%.
3.2. Water quality
The result of comprehensive water quality spatial distributions in the Musi estuary is presented in Figure 3. Musi estuary was receiving freshwater from 3 rivers mixed with saltwater from Bangka strait. The highest salinity (22‰) was recorded in the Banyuasin river mouth in the west, and the lowest salinity was observed in the central Musi river mouth. The water is similar to freshwater in this river mouth since the salinity can be as low as 4‰. A similar spatial distribution was also recorded for water temperature. The lowest temperature was recorded in the central and east parts of the estuary. In the west parts or in the Banyuasin river mouth, the water was warmer than other river mouths since the temperature can be as high as 31 0 C. The water clarity of the Musi estuary was varied. Central and east river mouths of Musi had less clarity.In comparison, clear water was observed in the west part of Musi in the Banyuasin river mouth. Low clarity in the central Musi estuary was related to the land uses along the Musi river. This river was passing settlements and receiving surface runoff from anthropogenic activities that increased the amount of sediment entering the river.
The water transparency in Musi was correlated with the dissolved oxygen (DO) (Figure 3). Banyuasin river mouth has the highest DO (9.9 mg/l) since the water was also clearer. In contrast, murky water with low transparency values in the central estuary has the lowest DO ranged from 3.6 to 6.0 mg/l. Correlations of water transparency with the DO were related to the phytoplankton photosynthesis. Clearwater will allow sunlight penetrations through water and support phytoplankton photosynthesis [36]. As a result of photosynthesis, phytoplankton will release oxygen into the water and increase the DO levels [36]. This also explains high chlorophyll recorded as high as 20 mg/m3 in Banyuasin and Upang river mouths that were characterized by high transparency and DO levels. Chlorophyll is essential to the existence of phytoplankton that can be used as an indicator organism for the health of particular estuary water.
3.3. Anthropogenic marine litter (AML)
The spatial distributions of AML in Musi estuary and river mouth (Figure 4) were varied. Plastic litter was accumulated in the central parts of the estuary near the Musi river mouth. Here the density of plastic litter can be as high as 7.54 items/m2 . The plastic litter density then decreases in west and east river mouths with density as low as 1.84 items/m2 . Similar spatial patterns were also observed for weights of plastic litters. East parts of an estuary or Upang river mouth have the lowest weight of plastic litter. At the same time, the weight of plastic litter was increased almost fourfold in the Musi river mouth or the central estuary. This central area has the highest AML considering that the central estuary received water from 2 Musi river tributaries. Besides that, the land use in upstream areas of the Musi river was dominated by settlements instead of forests that contribute to the discharge of anthropogenic litter to the Musi river [36].
3.4. Model selections for Sciaenidae
Table 2 presents the best model to describe the correlations of O. pama and P.microdon with their environmental covariates. Both species showed a model result similarity based on AIC values. Model selection for O. pama resulted in the best model containing the weight of AML, and other covariates have less significant effects. AIC values describing the correlation significance of O. pama frequency and AML measured in gram/m2 was 28.321. Similarly, the best model for P.microdon retained an effect of AML weight with an AIC value of 22.591. Those AIC values indicate that plastic litter weight as measured AML is the best covariate to predict the correlations of Sciaenids with AML covariates.
Table 2. AIC model selections of Otolithoides pama and Panna microdon frequencies with covariates (water quality variables and plastic litter contents)
| Residual | ||||||
|---|---|---|---|---|---|---|
| Variables | AIC | standard | R-squared | F | P | % contribution |
| error | ||||||
| Otolithoides pama (freq) | ||||||
| Covariates: | ||||||
| ⁓salinity (‰) | 32.357 | 9.14 | 0.055 | 0.117 | 0.56 | 21.54 |
| ⁓temperature (°C) | 32.279 | 9.229 | 0.037 | 0.076 | 0.62 | 17.16 |
| ⁓transparency (cm) | 32.508 | 9.14 | 0.055 | 0.117 | 0.56 | 14.11 |
| ⁓items/m2 | 29.579 | 6.521 | 0.519** | 2.16 | 0.02*** | 23.27**** |
| ⁓gram/m2 | 28.321* | 5.572 | 0.648** | 3.697 | 0.00*** | 23.90**** |
| Panna microdon (freq) | ||||||
| Covariates: | ||||||
| ⁓salinity (‰) | 26.552 | 4.467 | 0.055 | 0.117 | 0.56 | 20.16 |
| ⁓temperature (°C) | 26.629 | 4.51 | 0.037 | 0.076 | 0.62 | 16.54 |
| ⁓transparency (cm) | 26.552 | 4.467 | 0.055 | 0.117 | 0.56 | 14.90 |
| ⁓items/m2 | 23.851 | 3.187 | 0.519** | 2.16 | 0.02*** | 24.27**** |
| ⁓gram/m2 | 22.593* | 2.273 | 0.519** | 3.697 | 0.00*** | 24.11**** |
*selected best model, **significant correlation, ***significant with P<0.05, ****high % contribution
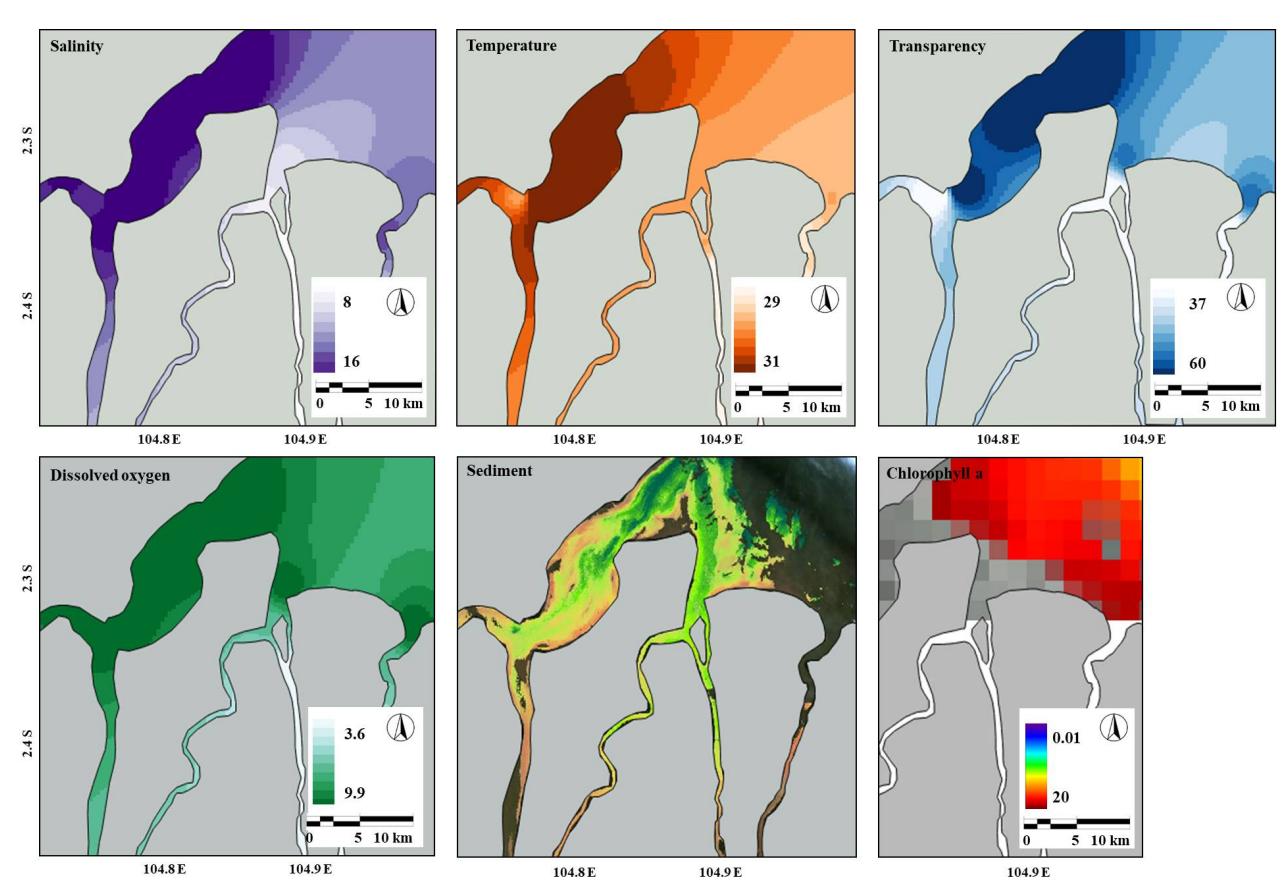
Figure 3. Spatial patterns of water quality variables including salinity (8-16 ‰), temperature (29-31 °C), transparency (37- 60 cm), dissolved oxygen (3.6-9.9 mg/l), sediment (brown color), and chlorophyll a (0.01-20 mg/m3 ) in 3 river mouths of Musi estuary, South Sumatra Province.
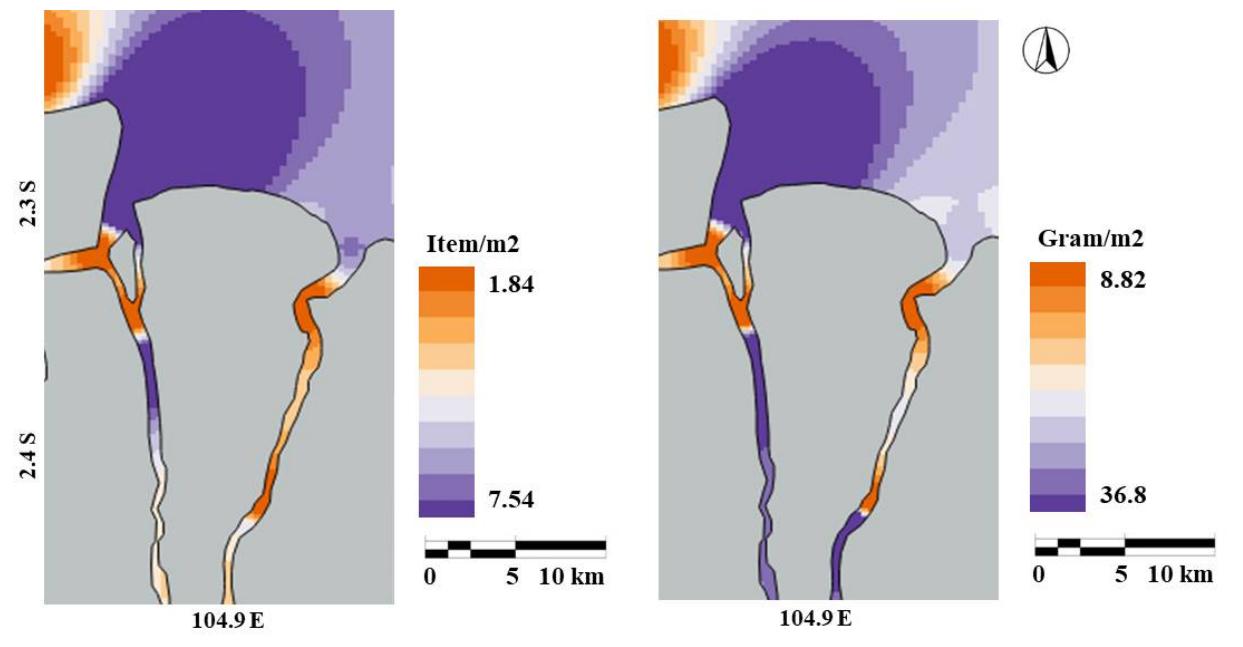
Figure 4. AML contents (1.84-7.54 items/m2 , left and 8.82-36.8 gram/m2 , right) in 3 river mouths of Musi estuary, South Sumatra Province.
3.5. Correlations of Sciaenids with water quality and AML
Both Sciaenid's species populations had either positive or negative correlations with environmental factors (Figure 5, 6). Positive correlations can be seen for high salinity, DO, cholophyll a, and moderate transparency covariates. An increase in salinity was followed by an increase in Sciaenid populations. Sciaenid is a fish that is common in coastal areas. This fish prefers high salinity. Presences of Sciaenid species in the river mouth of Musi estuary are considering that Sciaenid lives inshore over sandy or muddy bottoms and use estuarine environments seasonally as nursery grounds during the juvenile stage and as feeding grounds during the young adult stage [37]. In the Musi estuary, Sciaenids were observed to prefer a river mouth in the east with moderate transparency levels rather than inhabiting clear water in the west. Sciaenid species are known to inhabit water with various transparency levels, from murky to clear water. The transparency tolerance range of Sciaenid was 2.5-60 cm [37], while in Musi, the lowest transparency level was only 20 cm. Estuary water with low transparency can protect against predators and indicate more food availability [23].
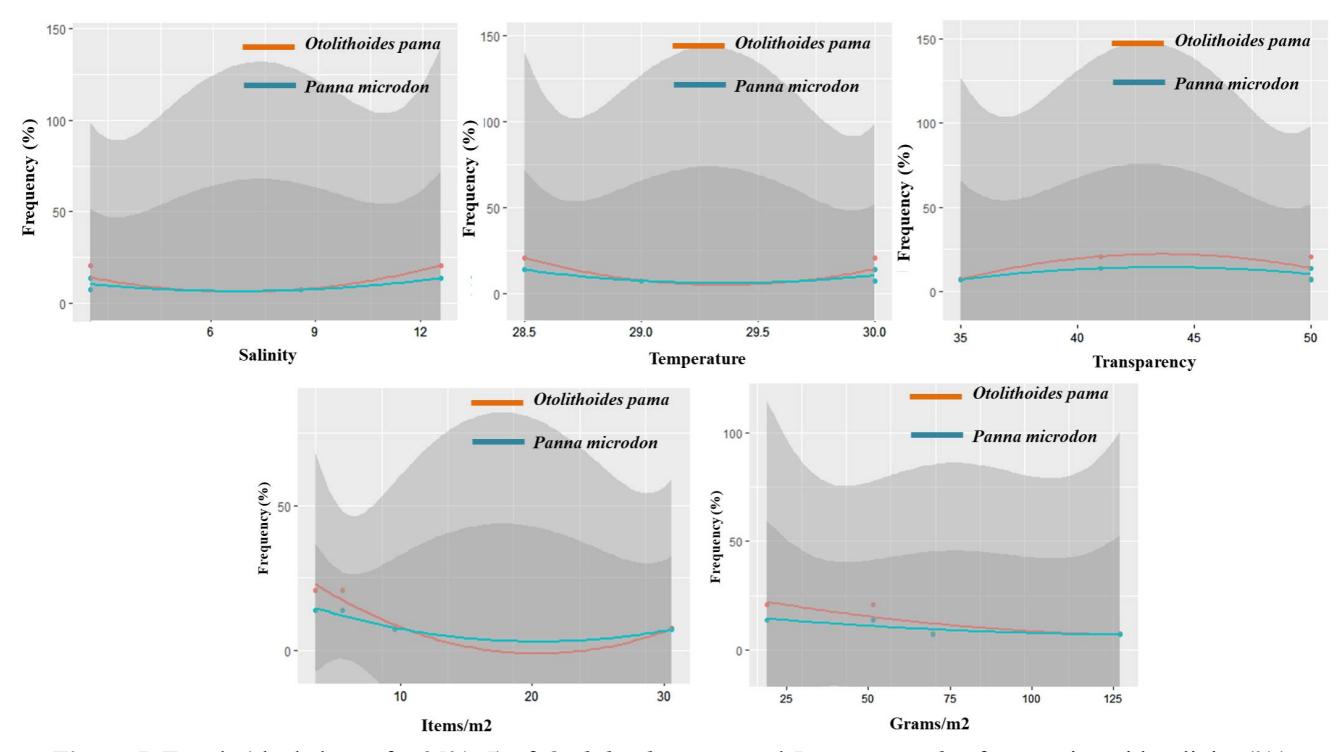
Figure 5. Trends (shaded area for 95%CI) of Otolithoides pama and Panna microdon frequencies with salinity (‰), temperature (°C), transparency (cm), and AML contents (items/m2 , gram/m2 ) in 3 river mouths of Musi estuary, South Sumatra Province.
High chlorophyll a was observed in west and east river mouths, while low in the central river mouth. Similar spatial patterns were observed for O. pama and P. microdon frequencies that were also high in the east river mouth. This finding is similar to other results in coastal areas [38, 39]. On the Coast of the South China Sea [38], chlorophyll a contents of 0.06 mg/m3 was followed by fish density as high as 2,767 individuals. In the Asian tropical sea, fish abundance was dependent on chlorophyll contents [39]. In Indonesia's sea, several fish species were correlated with chlorophyll a abundances, including sardine, fringe scale sardine, [40] and flying fish [41]. In the Musi estuary, high chlorophyll a contents were observed in coastal areas. This finding is comparable to the chlorophyll a contents that mostly dominate the Kendal coast, West Java [42]. Chlorophyll a indicates a presence and abundance of phytoplankton that was a food resource for zooplankton. While zooplankton is a diet of Sciaenids, this explains Sciaenids' correlations with chlorophyll a [42].
In this study, a negative correlation (Figure 6) of the presence of AML in the forms of plastic litters with the estuarine Sciaenid's populations in river mouth has been reported. The finding in this study is comparable to the other studies [43, 44, 45]. Marine litter is a global concern [43] since it can impact fish species at different levels of biological organization and habitats in many ways, namely through entanglement in, or ingestion of, litter items by individuals, resulting in death and/or death or severe suffering. Estuary and river mouth were some of the ecosystems that were vulnerable to plastic litter pollutions. Plastic litter density (Table 3) in Musi can be categorized as moderate.
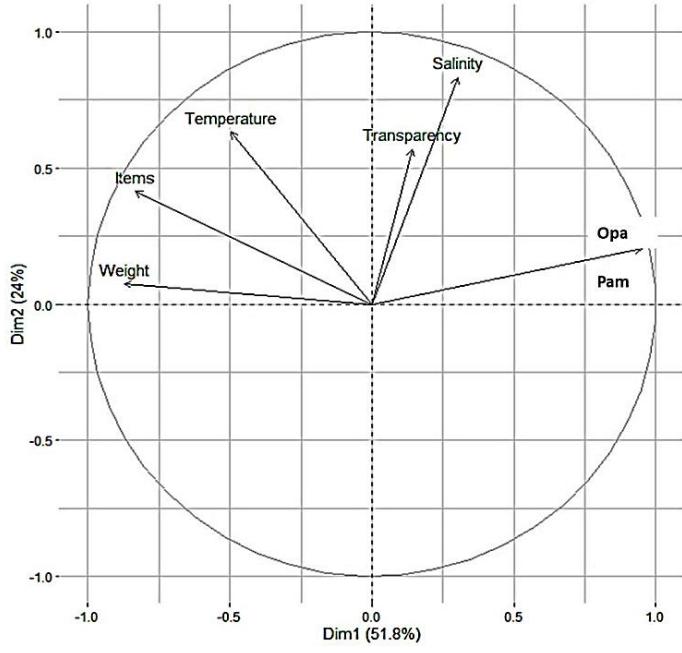
Figure 6. PCA of Otolithoides pama (Opa) and Panna microdon (Pam) frequencies with salinity (‰), temperature (°C), transparency (cm), and AML contents (items/m2 , weight in gram/m2 ) in 3 river mouths of Musi estuary, South Sumatra Province.
Table 3. AML content (1.84-7.54 plastic items/m2 ) comparisons with other estuary and river mouth locations
| Locations | Items/m2 | Source |
|---|---|---|
| Musi | 1.84-7.54 | This study |
| Bandar Lampung | 21.9 | [46] |
| Padang | 3.35 | |
| Pangkal Pinang | 4.18 | |
| Manado | 16.18 | [47] |
In comparison with other coastal ecosystems in Sumatra, plastic litter density in Musi was below the values of plastic litter density recorded in Bandar Lampung. In contrast, plastic litter density in Musi was still larger than Padang and Pangkal Pinang coasts. A high density of plastic litter in Musi might be related to the land use conditions of the Musi river. Settlements and less forested areas dominated the upstream of the Musi river. This condition leads to the increase of surface runoff, including the transport of plastic litter discharged from nearby settlements along river banks. The consequences of plastic litter in the river include accumulations of plastic in river mouths that affect the populations of estuarine. Plastic can indirectly pollute the intact river mouth and estuary ecosystems [44] also plastic litter can directly ingested by fish and reduce the fish populations [45]. The AIC model confirmed that weight (AIC: 22.593-28.321) followed by density (AIC: 23.85129.579) of plastic litters were the primary covariates that were best describing the Sciaenid population in the river mouth of Musi estuary. Since Sciaenid fish [48] in this study has a commercial value, then plastic litters management aiming to reduce the weight of plastic litters should be implemented in the future.
4. Conclusion
Two commercial Sciaenid species populations in Musi estuary were distributed spatially in east parts of estuary in Upang river mouth. Spatial presences of these Sciaenid species were strongly correlated with AML covariates rather than with salinity, DO, chlorophyll a, transparency, and temperature covariates. Low Sciaenid species populations were observed in areas with high loads of anthropogenic
marine litter, in this case, plastic litter. To conclude, weight followed by the density of plastic litter in estuary water was the main factor limiting Sciaenid population spatial distributions in Musi.
Acknowledgements
We are deeply indebted to the many stakeholders, including students and fishermen community of the sampled locations, that have contributed to the survey and collection of data.