
1. Introduction
Indonesia is known as the third largest coffee producer globally after Brazil and Vietnam [1,2,3,4]. The region of Coffee production exists in almost all parts of Indonesia, including West Java. Based on the Regional Rule of the Province of West Java concerning Guidelines for the Implementation of Cultivation, coffee is a commodity that has an essential role in building the economy of the society of West Java [5,6,7].
Coffee in West Java consists of two types, i.e., Arabica and Robusta coffee. Arabica coffee is more suitable for being grown at high altitude, while Robusta coffee can be grown at lower altitudes. The average productivity of Robusta coffee is 784 kg/Ha. The area cultivation of the Robusta coffee in West Java is around 15.750 Ha [35]. West Java Robusta coffee has been marketed to local and international markets. Robusta coffee from Ciamis,
Sumedang, Tasikmalaya, and Bogor has been locally marketed to other provinces in Indonesia. In contrast, Robusta coffee from Cianjur and Kuningan has been internationally marketed to other countries such as Saudi Arabia, Morocco, Singapore, Turkey, and France.
In general, Robusta coffee from various regions in West Java has different flavors, such as sweetness and acidity [30]. Many factors influence the differences in Robusta coffee flavors, such as natural and artificial factors [35]. Natural factors include geographical conditions, genetics or varieties/species, microclimates conditions, and fruit maturity. Artificial factors such as post-harvest processing include preparation, grinding, drying, washing, and roasting temperature [8,9,26,35].
The demand for West Java Robusta coffee generally is related to the coffee quality, especially the taste of coffee. The taste of coffee is influenced by the composition of the metabolites in the beans [13,14]. Some coffee beans'
metabolites, e.g. sugar, caffeine, theobromine, theophylline, trigonelline, and chlorogenic acid, can significantly affect the taste [27,28,29]. Two of them were caffeine and chlorogenic acid [15,16,17]. Caffeine plays a role in determining the bitter taste of coffee, and chlorogenic acid in coffee's sour taste [18,19,20,21,22,36]. An increase in caffeine concentration in the coffee beans indicates a good quality of coffee. In contrast, the rise of CGA concentration in the coffee beans indicates poor quality [8].
According to previous studies, environmental factors such as altitude and microclimate (i.e., temperature, humidity and rainfall) correlate with caffeine and CGA concentration [10,11,12,17]. However, the concentration of caffeine and CGA negatively correlates with altitude [37]. In addition, lower temperatures and low intensity delay the coffee maturity, thus, inhibiting some metabolites' accumulation in coffee beans [11,23]. Moreover, no significant effect was found between CGA concentration and rainfall, but the temperature positively correlates with the caffeine concentration and CGA [23,24].
Research on the analysis of caffeine and CGA concentrations in coffee has been done previously by Jeszka et al. [34], Awwad et al. [36], Girma et al. [37], and Hagos et al. [38]. None of those researches analyzed caffeine and CGA concentration of Robusta coffee beans from West Java. Therefore, the objective of this study was to analyze the caffeine and CGA of Robusta coffee from West Java and to determine the correlation between microclimates with the concentrations of caffeine and CGA. Cultivation area of Robusta coffee in West Java selected which has area more than 1000 Ha, including the areas of Bogor, Ciamis, Cianjur, Kuningan, Sumedang, and Tasikmalaya.
In this study, High-Performance Liquid Chromatography (HPLC) was used to analyze caffeine and CGA as HPLC is an effective method for analyzing caffeine and chlorogenic acids in the coffee bean and roasted bean [32,33]. The concentration of caffeine and CGA were correlated to the microclimate (temperature, rainfall, and humidity) and altitude using a multivariate statistical. The Principal Component Analysis (PCA) in this study was used to determine the correlation between each variable and the concentration of caffeine and CGA.
2. Methodology
The sample of six green and six roasted coffee beans were obtained from six different areas in West Java (Bogor, Ciamis, Cianjur, Kuningan, Sumedang, and Tasikmalaya). Robusta Coffee from those cultivation areas was subjected to caffeine and CGA analysis using HPLC. The concentration of caffeine and CGA was correlated to microclimates
(temperature, rainfall, and humidity) and the altitude of where the coffee originated. Multivariate statistical analysis was used to interpret the data through Principal Component Analysis (PCA).
2.1. Samples preparation
Green beans Robusta coffee were obtained from smallholder farmers from six different cultivation areas in West Java (i.e., Ciamis, Tasikmalaya, Sumedang, Kuningan, Cianjur, and Bogor). Roasted samples of Robusta coffee were prepared using a coffee roaster machine. The samples of coffee beans were ground using a coffee grinder, Cyprus grinder GR0063. The ground green bean coffee was put quickly into a 30 ml dark glass bottle to avoid the evaporation of volatile compounds. Bottles containing samples of roasted and green bean coffee were stored at room temperature before further processing.
2.2. Extraction
0.25 g of green beans and roasted beans from each location were separately extracted with 30 mL of methanol/water (70:30 v/v) for caffeine analysis and ethyl acetate for chlorogenic acid analysis. The extracts were sonicated at 65°C for 10 minutes and centrifuged at 1372 xg for 3 minutes. This procedure was repeated three times, and the supernatant was collected at the end of each centrifugation cycle. The supernatant from each sample was evaporated using a vacuum evaporator to obtain a crude extract. Then, it was filtered using a polytetrafluoroethylene (PTFE) syringe filter with a size of 0.22µm, according to the method of Ceylan et al. [3].
2.3. Caffeine and CGA analysis
The analysis of caffeine and chlorogenic acid in the green and roasted bean samples was conducted by Shimadzu Prominence type 20A HPLC. Twenty µL of each sample was applied to the HPLC using Shimpack C18 gist shimadzu column (5 μm particles, 4.6 mm internal diameter, and 25 cm length). The analysis was carried out at 27 °C using isocratic elution of methanol:water (50:50) with a flow rate of 1 mL/min. A UV detector was used at λ272 nm and λ324 nm to detect the caffeine and chlorogenic acid peaks, respectively.
Standard solutions of caffeine ad CGA were prepared in separate flask by appropriate dilution of 0.1 mg/mL (100ppm) stock solutions with the same solvent to contain 0.5,0.25,0.125, and 0. 0625 mg/ml final concentration. Each standard solution was injected into HPLC in triplicate. Calibration curves were obtained by plotting the peak areas of each standard solution versus the concentration of the injected standard solution.
2.4. Microclimate
Data of temperature, humidity, and rainfall were average per year obtained from the data center of the National Statistics Agency on the website (https://www.bps.go.id/), and data on altitude was obtained from Google Earth 2021.
2.5. Statistical analysis
The data were processed by Minitab version 17 followed by principal component analysis (PCA) using Minitab version 17 to evaluate the correlation between microclimate with caffeine and chlorogenic acid.
3. Results and discussion
3.1. Caffeine and CGA concentration
Results showed that the caffeine concentration in green beans and roasted beans from six coffee plantation areas ranged from 7.67–16.52% in green beans and 10.79-15.56% in roasted beans, respectively (Table 1.). The lowest caffeine concentration was found in coffee samples from Ciamis, both for green bean coffee (7.67%) and roasted bean coffee (10.79%). The highest caffeine concentration was found in the green bean coffee sample from Cianjur (16.52%) and the roasted bean coffee sample from Bogor (15.46%). In this study, the Robusta coffee has a high concentration of caffeine. This finding was in line with the study by Cheng et al. [17] and Sunarhanum et al. [8], who mentioned that the concentration of caffeine in Robusta coffee was higher than in Arabica coffee. The study also showed that the concentration of caffeine in coffee beans before and after the roasting process was not much different. This result was correlated with a previous study by Cheng et al.[17] and Jeszka et al. [34] and supported by the theory that caffeine has thermostable characteristics [17].
Chlorogenic acid concentration ranged from 0.74-3.03% in green bean coffee and 0.25-0.77% in roasted bean coffee, respectively (Table 1.). The lowest concentration of chlorogenic acid was found in the green bean coffee sample from Cianjur (0.74%) and the roasted bean coffee sample from Tasikmalaya (0.25%). The highest concentration of chlorogenic acid was found in the green bean coffee sample from Sumedang (3.03%) and in the roasted bean coffee sample from Kuningan (0.77%). The study also showed that the concentration of chlorogenic acid in coffee beans before and after the roasting process is not much different. This result agrees with the study of Cheng et al. [17] and is supported by the theory that chlorogenic acid has thermostable characteristics [17].
Caffeine concentration increased after the roasting process, while CGA concentration decreased (Table 1.). The change in caffeine and chlorogenic acid concentration after roasting was affected by high temperatures during the roasting process, as reported by Sunarharum et al. [8]. The temperature and duration of the roasting process affect caffeine concentration and a drop of chlorogenic acid [8]. The roasting process plays a role in determining the taste and quality of brew coffee. Several volatile and nonvolatile compounds were formed during the roasting process and contribute significantly to the sensory characteristics of coffee drinks. Certain compounds' intensity varies depending on the temperature of roasting processed, particularly caffeine and chlorogenic acid. During the roasting process, chlorogenic acid was degraded into lactone, which caused the quantity of CGA to decrease [25]. On the other hand, caffeine acid releases caffeine during the roasting process, increasing the total caffeine concentration [31].
3.2. Correlation of caffeine and CGA with altitude and microclimates
The PCA analysis reveals that the caffeine and chlorogenic acid concentrations were affected by different microclimatic conditions. Caffeine concentration was positively correlated with humidity, altitude, and temperature. On the other hand, caffeine does not correlate with rainfall. The chlorogenic acid concentration was not correlated with the microclimate. PCA results showed that the most influential microclimatic variable to caffeine concentration was the humidity, altitude, and temperature, with a variance value of 47.8% (PC1) and 28.5% (PC2), or 76.3% in total (Figure 1).
The microclimate variables, altitude, temperature, rainfall, and humidity were not correlated with the concentration of CGA, with a variance of 37.2% (PC1) and 34.1 (PC2) or a total of 71.3% (Figure 2.). Caffeine concentration was positively correlated with humidity, altitude, and temperature, while CGA concentrations were not correlated with microclimatic variables (humidity, temperature, and rainfall) and altitude. Altitude was negatively correlated with CGA concentration [17,37,38]. Indeed, the coffee from Cianjur with the highest altitude (713 masl) showed the lowest concentration of CGA (0.74%). A similar result was also reported by Girma et al. [37] and Hagos et al. [38].
According to Odeny et al. [10], environmental factors influence caffeine accumulation [10]. For example, lower temperatures, high altitude, and high humidity delay coffee maturity for about one month and cause the biochemical composition to variate significantly at the stage of bean development. Delay coffee maturity causes the accumulation of caffeine and CGA [23,11]. However, no relationship was found between caffeine and CGA concentration and rainfall (Figure 2.). A similar result was also reported in another study by Joet et al. [23].
Table 1. The concentration of caffeine and chlorogenic acid in the green bean and roasted bean Robusta coffee samples from six areas of West Java.
| Sample coffee | Region | Concentration (%) (v/v) | water content (%) | Microclimates* | Altitude (masl**) | |||
|---|---|---|---|---|---|---|---|---|
| CGA (%) | Caffeine (%) | Temp . (ºC) | Humidity (%) | Rainfall (mm/year) | ||||
| Green | Bogor | 1,86 | 11,69 | 8,13 | 25,5 | 83 | 3930 | 700 |
| Bean | Ciamis | 3,0 | 7,67 | 4,28 | 25 | 74,8 | 1309 | 607 |
| Kuningan | 3,03 | 11,07 | 4,99 | 27 | 74 | 1682 | 657,5 | |
| Sumedang | 2,28 | 12,13 | 4,85 | 24,7 | 69 | 2570 | 551 | |
| Tasikmalaya | 1,77 | 10,14 | 3,31 | 25,7 | 67 | 2750 | 398,5 | |
| Cianjur | 0,74 | 16,52 | 4,04 | 26,5 | 88 | 1250 | 713 | |
| Roaste | Bogor | 0,27 | 15,46 | 1,81 | 25,5 | 83 | 3930 | 700 |
| d Bean | Ciamis | 0,32 | 10,79 | 0,92 | 25 | 74,8 | 1309 | 607 |
| Kuningan | 0,77 | 12,62 | 3,10 | 27 | 74 | 1682 | 657,5 | |
| Sumedang | 0,32 | 11,09 | 1,57 | 24,7 | 69 | 2570 | 551 | |
| Tasikmalaya | 0,25 | 11,43 | 1,10 | 25,7 | 67 | 2750 | 398,5 | |
| Cianjur | 0,49 | 10,82 | 3,53 | 26,5 | 88 | 1250 | 713 | |
*Data of microclimates were obtained from the data center of the National Statistics Agency on the website (https://www.bps.go.id/), while data on altitude was obtained from google earth 2021.
**Above the sea level
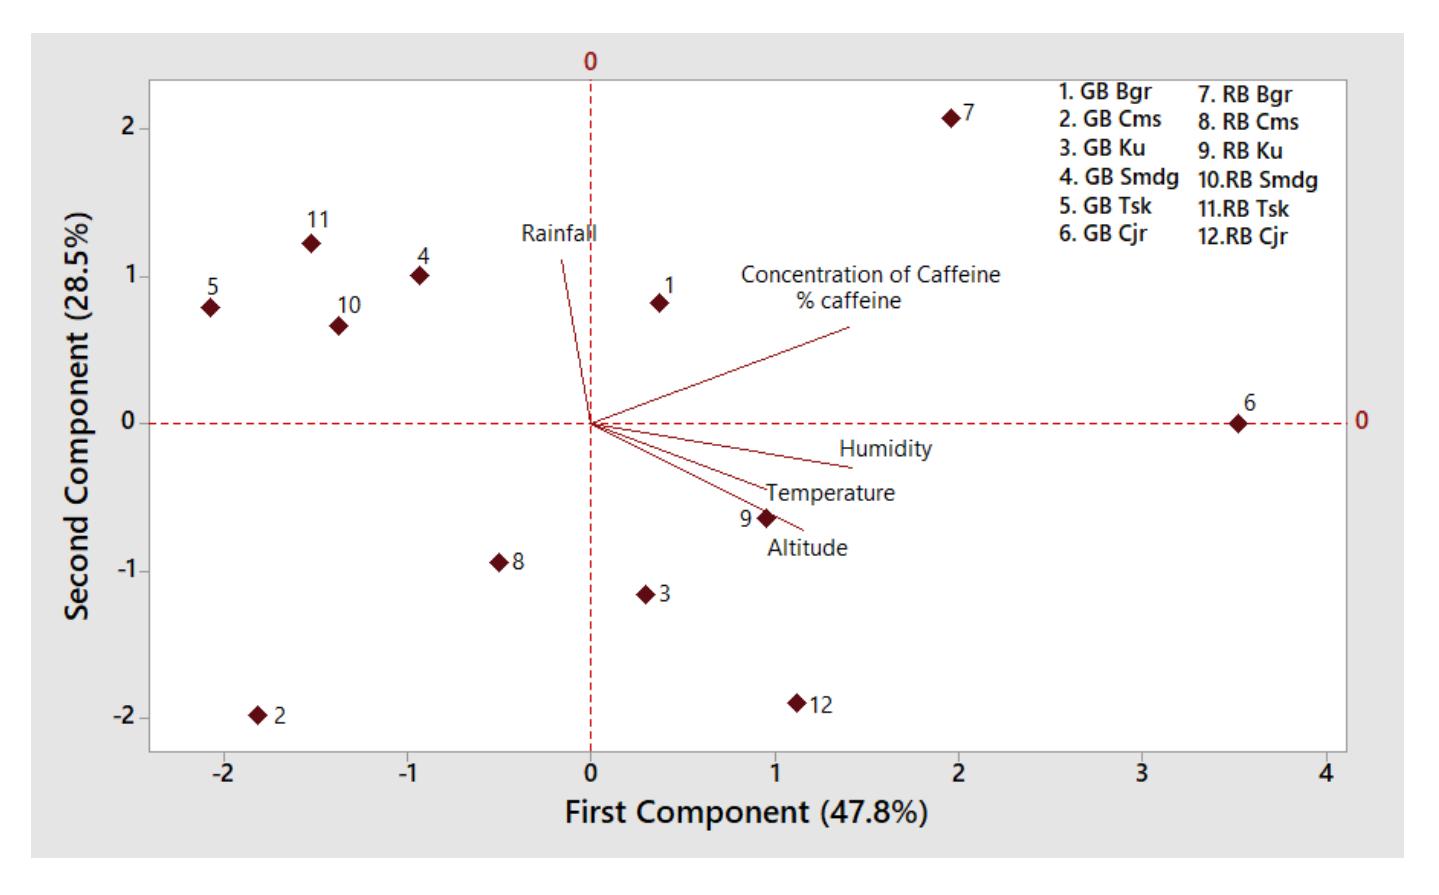
Figure 1. PCA biplot of microclimatic (altitude, humidity, rainfall, temperature) on caffeine concentration (GB = green beans, RB = roasted beans, Bgr = Bogor coffee samples, Cms = Ciamwas coffee samples, Ku = Kuningan coffee samples, Smdg = sample of Sumedang coffee, Tsk = sample of Tasik coffee and Cjr = sample of Cianjur coffee).
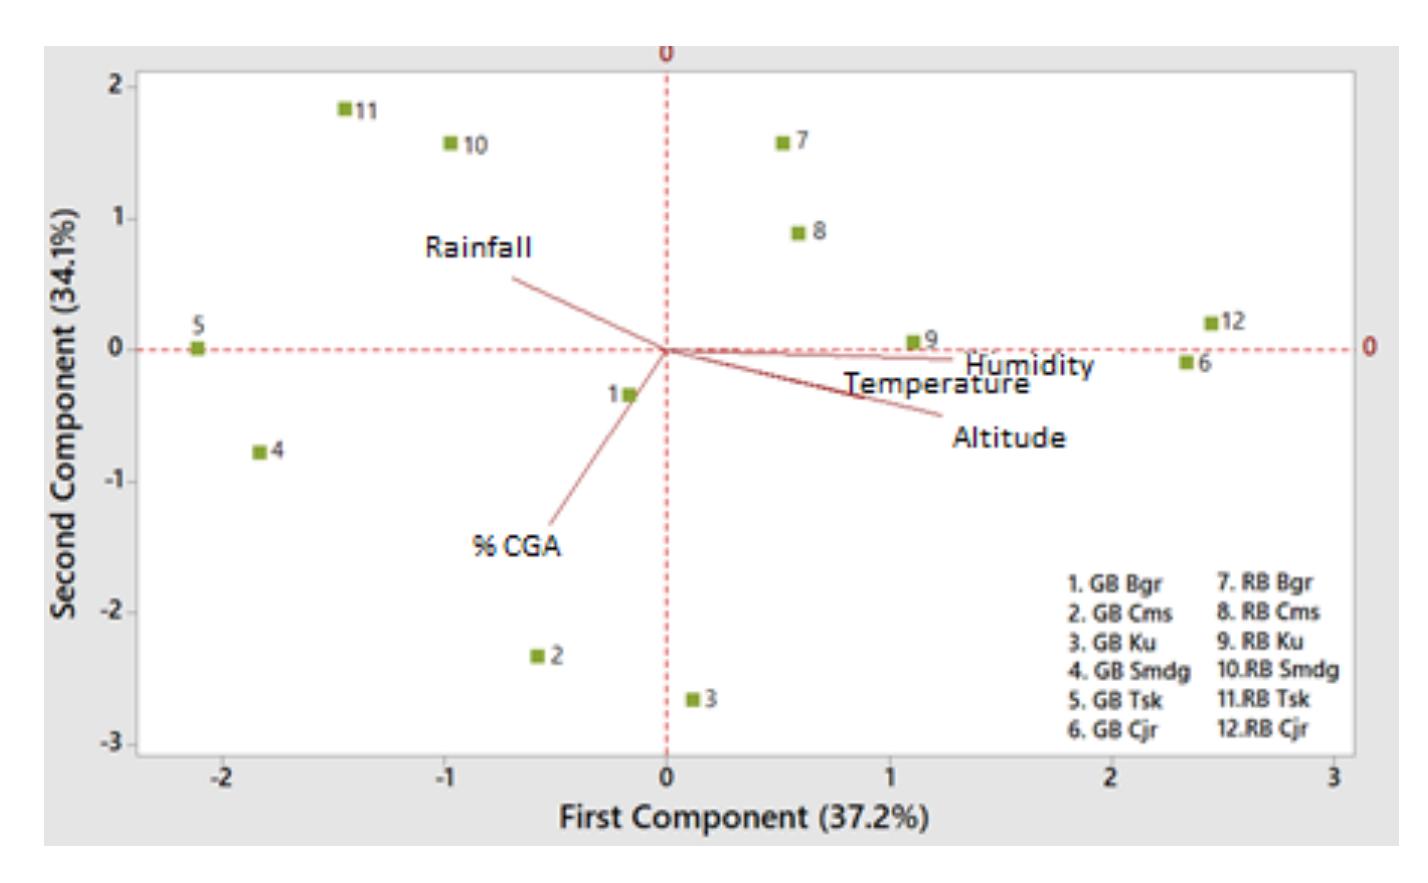
Figure 2. PCA biplot of microclimatic (altitude, humidity, rainfall, temperature) on CGA concentration (GB = green beans, RB = roasted beans, Bgr = Bogor coffee samples, Cms = Ciamwas coffee samples, Ku = Kuningan coffee samples, Smdg = sample of Sumedang coffee, Tsk = sample of Tasik coffee and Cjr = sample of Cianjur coffee).
4. Conclusion
There is a positive correlation between humidity, temperature, altitude, and caffeine concentration. However, no correlation between the microclimate with the concentration of CGA.
Acknowledgments
The authors acknowledge financial grants provided by P2MI Institut Teknologi Bandung, Indonesia to Erly Marwani. We also acknowledge to Lembaga Pengelola Dana Pendidikan (LPDP) who gave Master degree program scholarship to Suci Awaliyah.