
1. Introduction
The long-tailed macaque (Macaca fasscicularis, hereafter LTMs) is a widely distributed primate in Java [1]. This animal can live in various habitats, from the coastal area to primary forests. In Southeast Asia, mostly LTMs are commensal animals (i.e., animals that live with and benefit from humans), and few are still living wild and undisturbed by humans [2]. The human activity area provided new food sources for LTMs, such as fruit, food scrap, and garbage. When food sources are concentrated in an area, these animals will tend to be concentrated in that food source area, and there is an overlap between human activity areas [3]. In several locations in Indonesia, these animals live overlapping areas of human activity, such as in Pangandaran Nature Reserve and Nature Park, Kreo Cave Tourism Area in Semarang, Grojogan Sewu Nature Tourism Park, Tawangmangu Karanganyar, and several other natural attractions area [4].
Commensal conditions cause interactions that occur between humans and LTMs. This interaction can cause various impacts given and received by each party. Areas of human activity provide more food sources and become a dietary supplement for LTMs. In addition, LTMs will be more active around the area to minimize travel costs and maximize forage exploration [5]. However, this LTMs behavior causes losses to humans because there are mostly damaged crops and disturb the community in the settlement area [6]. LTMs provide a distraction by chasing, grabbing, and attacking for food in nature tourism areas. Their behavior is because LTMs are accustomed to being given food by visitors, causing them to adapt and know that humans bring the food they want [7].
LTMs population size influences the intensity of the disturbance. As the population size increases, the frequency of tension, fighting, and aggression within and between groups will increase. Some groups will increasingly disturb visitors to ask for food, or leave the area to damage agricultural land and plantations, also settlement areas [8]. On the other hand, LTMs are an intermediary for transmitting several diseases such as SFV (Simian Foamy Virus), Herpes B, Flu A and B, and Measles through direct contact [9]. This condition causes disturbances that occur not only to provide material losses to humans but also in the form of disease transmission carried by these animals.
One area that has interaction between these two parties is Ir. H. Djuanda Grand Forest Park (hereafter GFP). Ir. H Juanda GFP is a nature conservation area that is also used as a nature tourism area. The tourism activities that occur here present interactions between visitors and LTMs. In addition, the land around the area consists of fields and residential areas. These two conditions attract LTMs and cause wildlife disturbance. For example, in 2019 LTMs damaged settlements and crops areas located in Mekarwangi Village, Lembang District, which is located on the Ir. H. Djuanda GFP border. On the inside of the area, especially on weekends, tourist activity becomes very crowded, especially along the main track that divides the area. This causes LTMs to come to the crowd to get food brought by visitors by asking for or even pursuing and stealing. Furthermore, based on data collection conducted in 2020, it is known that the total population of LTM in this area is around 376 individuals, while the carrying capacity of the area is only 129 individuals [10]. This causes an increase in the intensity of disturbances that occur inside and outside the area by LTMs.
To minimize potential disturbances occurring at Ir. H. Djuanda GFP, it is necessary to carry out population control measures. Population control can be done in the form of relocation and harvesting activities to balance the population size in its natural ecosystem. Harvesting actions that will be carried out need to consider policies on the use of wildlife, the sustainability of the remaining population, and the legal status and protection of the animals whose populations will be controlled [11].
Population control measures require specific references to maintain the existence of the remaining population in the area. One of the references that can be used is the size of the minimum viable population (MVP). MVP is the smallest measure of an isolated population in a particular habitat, which has a 99% chance of survival for 100 years amid various disaster risks caused by certain factors [11]. In determining the MVP, demographic parameter data and growth population models are needed to estimate the number of individuals from LTMs utilized and ensure the remaining population remains stable in the future [12]. This study aims to determine the MVP size of the LTMs in the Ir. Djuanda GFP. The MVP will then be used to determine the population control scheme by considering the dynamic conditions of the LTMs population in the area.
2. Methodology
2.1. Time and Location
This research was conducted from April to December 2021 in Ir. H. Djuanda GFP Area, Jl. Ir. H. Djuanda No.99, Ciburial, Cimenyan District, Bandung City, West Java (Figure 1). This area has an altitude of 770 - 1330 meters above sea level, with a basin-shaped landscape from the Cikapundung river flanked by two steep slopes. Based on the climate classification of Ferguson and Schmidt (1951), this area has a B climate type (9 wet months, 3 dry months) and a type C climate (8 wet months, 4 dry months). The land cover in this area is secondary dryland forest, with dominant species such as Pinus merkusii, Caliandra callothrysus, Swietenia sp., and Bambusa sp [13]. This research was conducted in three stages, i.e. preliminary survey, data collection on LTMs population dynamics, and data analysis. The preliminary survey was carried out from April to August 2021, while data collection on LTM encounters was carried out from September to October 2021.
2.2. Data collection
Primary data consists of information on population dynamics of LTMs and the perception of Ir. H. Djuanda GFP area manager related to LTMs issues. Secondary data consists of various regulations related to the management and use of wild animals.
Population dynamics data were obtained through the collection of LTMs population demographic data. Population demographics were obtained through field observations using the point count method at 6 points in the area (Figure 2) [14]. The method of counting points selected topographical characters that do not allow the transect method. On the other hand, the selection of observation points was carried out purposively, referring to the preliminary survey results. The selected point is the point most visited by LTMs, but not visited by the same group. Observations were carried out in the morning (8 – 11 am) and afternoon (1– 4 pm), which is 2 days at each point and takes the maximum recorded group size. The data collected were the number of individuals grouped by sex and age class. Age class grouping data collection was carried out qualitatively, considering the difficulty of determining the age of individual animals in the wild and since no historical data on the population of LTMs owned by the manager. Age classes are grouped as infants (0-1.5 years), juveniles (1.5 – 4 years), sub-adults (4 – 9 years), and adults (9 – 21 years) [15]. The population demographic data were used to observe the LTMs population's growth and determine the MVP size of each age class and colony.
The perception of Ir. H. Djuanda GFP manager was obtained through interviews that were conducted in a semistructured method. The information collected included opinions of area managers regarding LTMs problems, such as causes of disturbance and overpopulation, losses received, and LTMs management actions.
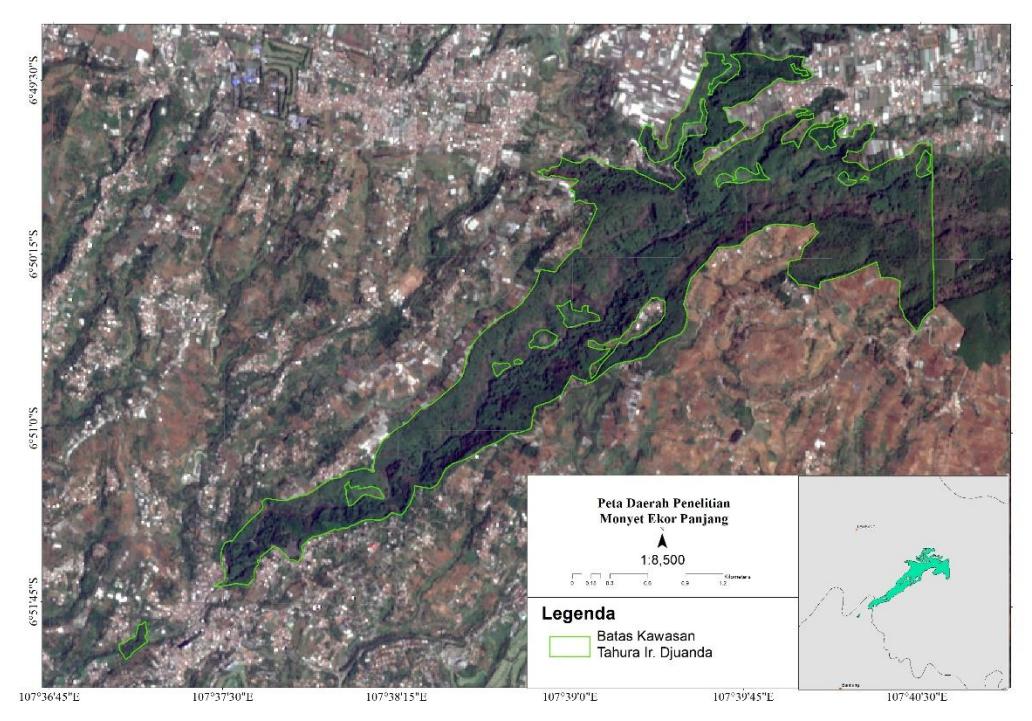
Figure 1. Research Study Area
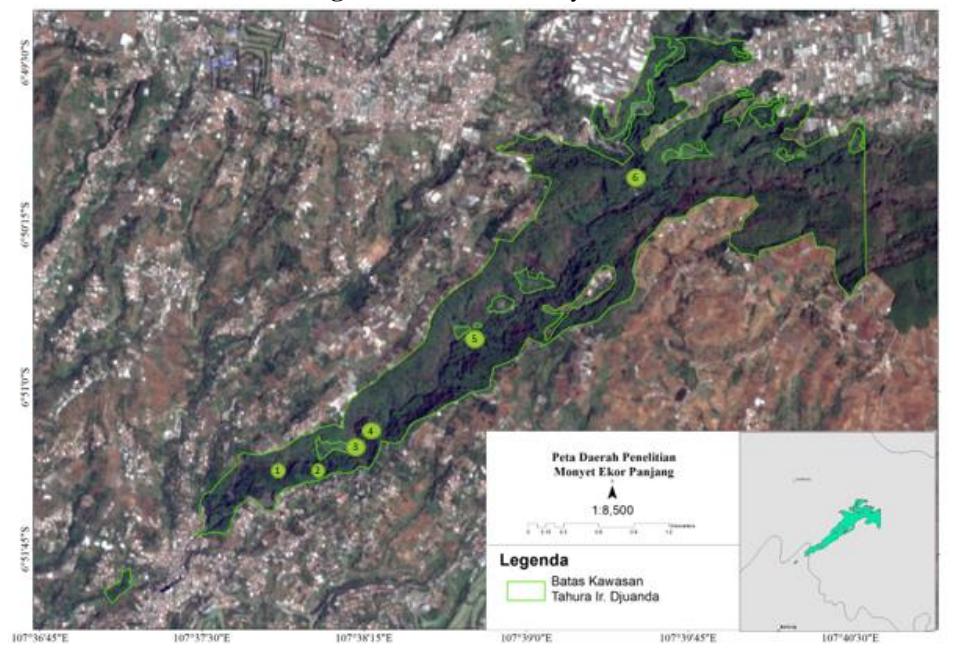
Figure 2. The observation points of LTMs
2.3. Data Analysis
2.3.1.Long-tailed Macaques's Dynamics Population
LTMs population growth was analyzed by using Lefkovitch Matrix. The Lefkovitch matrix is a growth model developed from the Leslie matrix. The Leslie matrix is a growth model that uses a discrete age structure. However, it will be challenging to determine the individuals' age in population studies that are not using cohort (observations are made from birth to death of all populations), such as those carried out in nature. The Lefkovitch matrix is an advanced development model that refers to the stage-class of an individual, so it can be used on species of unknown age as long as the life stage can be determined qualitatively [16].
The assumptions used in the Lefkovitch model include:
- 1. There was no population migration during the observation
- 2. The population growth model is density-independent
- LTMs are classified as a birth flow model, where births can occur every year because these animals do not have a mating season.
This matrix was simulated in a Microsoft Excel application. The simulation duration used was 25 years, referring to the maximum age of LTMs in the wild. The form of the Lefkovitch matrix is a simple transition matrix that is formulated as follows
\[\begin{aligned} & M_L \times N_t = N_{t+1} \\ \begin{bmatrix} \delta_I & 0 & F_{SA} & F_A \\ Px_I & \delta_J & 0 & 0 \\ 0 & Px_J & \delta_{SA} & 0 \\ 0 & 0 & Px_{SA} & \delta_A \end{bmatrix} \times \begin{bmatrix} X_{I,t} \\ X_{J,t} \\ X_{SA,t} \\ X_{A,t} \end{bmatrix} = \begin{bmatrix} X_{I,t+1} \\ X_{J,t+1} \\ X_{SA,t+1} \\ X_{A,t+1} \end{bmatrix} \end{aligned}\]
\(F_{SA}\) = Sub-adult class fecundity
\(F_A\) = Adult class fecundity
Px<sub>I</sub> = Survival probability of infant class
\(Px_J = Survival probability of juvenile class\)
\(Px_{SA}\) = Survival probability of sub-adult class
\(\delta_{\rm I}\) = Proportion of remaining infant class
\(\delta_{\tau}\) = Proportion of remaining juvenile class
\(\delta_{SA}\) = Proportion of remaining sub-adult class
\(\delta_A\) = Proportion of remaining adult class, with a birth age limit of 12 years
\(X_{Lt}\) = Number of infant class when t-years
\(X_{J,t}\) = Number of juveniles class when t-years
\(X_{SA,t}\) = Number of sub-adult class when t-years
\(X_{A,t}\) = Number of adult class when t-years, with a birth age limit of 12 years
\(X_{I_{t+1}}\) = Number of infant class when t+1 years
\(X_{J,t+1}\) = Number of juveniles class when t+1 -years
\(X_{SA,t+1}\) = Number of sub-adult class when t+1-years
\(X_{A,t+1}\) = Number of sub-adult class when t+1 years, with a birth age limit of 12 years
2.3.2.Estimation of Minimum Viable Population
MVP size refers to the basic condition \(N_0\) =\(N_t\) [17]. Population \(N_o\) contains information related to the ability to increase and decrease the population in each age class, such as the number of births produced by productive female groups and deaths in each age class (equation i). The \(N_T\) population describes the population growth derived from the Lefkovitch matrix, which occurs during the period of t-years (equation ii). MVP value of each age class can be determined by finding the intersection between the population \(N_0\) and \(N_T\). The algebraic calculations performed can be seen in the following formulation:
Equation (i):
\[0 = (F_{SA} \times X_{SA}) + (F_A \times X_A) - ((M_A \times X_A) + (M_{SA} \times X_{SA}) + (M_J \times X_J) + (M_I \times X_J))\]
Equation (ii):
\[0 = N_t - ((F_{SA} \times X_{SA} + F_A \times X_A) + (Px_I \times X_I + Px_J \times X_J + Px_{SA} \times X_{SA}) + (\delta x_I \times X_I + \delta x_J \times X_J + \delta x_{SA} \times X_{SA} + \delta x_A \times X_A))\]
Since equations (iii) and (iv) are comparable,
\[(F_{SA} \times X_{SA}) + (F_A \times X_A)\] \(((M_A \times X_A) + (M_{SA} \times X_SA) + (M_J \times X_J) + (M_I \times X_I))\)
\[N_{t}-((F_{SA} \times X_{SA} + F_{A} \times X_{A}) + (Px_{I} \times X_{I} + Px_{J} \times X_{J} + Px_{SA} \times X_{SA}) + (\delta x_{I} \times X_{I} + \delta x_{J} \times X_{J} + \delta x_{SA} \times X_{SA} + \delta x_{A} \times X_{A}))\]
2.3.3. Formulation of Population Control Scheme
The population control scheme was formulated based on considerations obtained from the study of regulations on the management and use of wildlife, the perspective of Ir. H. Djuanda GFP manager, the ability of population growth, and the MVP. Regulatory considerations and managers' perspectives will later produce alternative objectives for population control activities. Furthermore, the scheme of population control was reviewed through the effect of applying MVP by age class (control is only carried out on age classes that have a size above the age class MVP) and groups (control will be carried out when all age class sizes in a group have passed the MVP) on population growth.
This study also considered the current regulation on the use of wildlife. In addition, this study analyzed the potential
costs and revenues of LTMs population control and additional recommendations to overcome the problem of LTMs in the Ir. H. Djuanda GFP area.
3. Results and discussion
3.1. Long-tailed Macaques' Population Dynamics
Population Structure
This study found that each LTM group in six observation points has a different population structure, both in terms of age class and gender (Table 1). The total population from all observation points is 229 individuals, with an average of 38 individuals/point. Each point has 1 group because at each point it is known to have one group due to rejection and fights by the group that has occupied a point against the new group that has just arrived.
The population size of LTMs varies based on the type of habitat. The primary forest in Peucang Island, Ujung Kulon National Park, has an average LTM population of 21 individuals/group [12]. In Lampung Province, the average LTM population is 20 individuals/group in primary forest, 39 individuals/group in secondary forest, 32 individuals/group in coastal forest, and 47 individuals/group in mixed farmland [18]. Compared to the habitat type of Ir. H. Djuanda GFP, i.e., secondary dryland forest, the LTMs population in Lampung Province is quite similar to the one in Ir. H. Djuanda GFP. This condition happened because they have the same land cover type. Furthermore, it is not stated with certainty whether the study area in the province of Lampung has the same conditions for natural and human activities as that of Ir. H. Djuanda GFP. In addition, the population size of a group is also influenced by the rate of birth, death, immigration, emigration, ability to compete with other groups, and the process of group formation [19].
Sex Ratio
Table 2 presents the sex ratio of the LTMs group in Ir. H. Djuanda GFP, which ranges from 1:1 to 1:1.3 on each point. The sex ratio of the total LTMs population is 1:1.1, where the number of male and female individuals is almost the same. A similar condition was also found in other studies, such as in Tenau Monkey Cave Recreation Park (TRGMT) Kupang, with an LTMs sex ratio of 1: 1,285 [20]. The population of LTMs in Peucang Island also had a similar sex ratio, i.e., 1:1,2 [12]. The sex ratio influences the level of competition in the group. When the number of adult males is greater than the number of females, this will increase the competition between adult males within the group [21]. In the infant stages, the survivability of the infant is influenced by the mother's infant rank. The sons of high-ranking mothers had better survivability than the sons of the lowranking mother.
Moreover, high-ranking mothers give a higher male infant proportion than low-ranking mothers. For female infants or daughters, mother rank did not significantly affect their survivability. Also, there is no sex difference between sons and daughters in their survivability. Furthermore, the interval of interbirth of daughters is longer than sons. Based on the Triver-Willard hypotheses, interbirth intervals suggest that the deviation in birth sex ratio is already established at conception [22]. These previous studies showed that the sex ratio is influenced by the proportion between the ranking of mothers and interbirth intervals that happened when each individual in the group was born.
Natality and Mortality
Table 3 presents the natality rate of each population of LTMs found in Ir. H. Djuanda GFP. The natality rate is represented by the crude birth ratio, i.e., the ratio between the number of infants and productive females in a group. The crude birth ratio of the LTMs population is in the range of 0.50 – 0.60, with a mean of 0.55. This result is similar to the studies conducted in Paliyan Wildlife Reserve and Kaliurang Nature Tourism Park, Yogyakarta, which found a natality rate of 0.40 – 0.60 [23].
Each adult female individual can give birth to 1 baby and rarely two babies every year, with pregnancy occurring every 1.5 – 2 years [23]. In addition, the high birth rate is also influenced by the role of productive females during treatment. Productive females are divided into experienced and inexperienced females. A higher proportion of experienced females results in a better survival rate for infants born [24]. On the other hand, LTMs have been reported as animals that associate food availability and birth rate. As long the area they occupy has an adequate abundance of feed, the birth rate will remain stable [25].
The survival rate approaches the mortality rate of the LTMs population. The survival rate is the ratio between the number of individuals from one age class who survive and move to the next age class. The mortality rate for all LTMs groups is listed in Table 4. The highest mortality rate is in the subadult age class (MSA-A), with an average of 0.71. This condition was also found in a study conducted in Lampung Province, where the mortality rate for the young adult class ranged from 0.69 to 0.76. This value can be linked to the competition in the group when maintaining social status. Fights between individuals potentially decrease the number of individuals in the adult age class [18]. In addition, the survival rate is also influenced by ecological constraints that affect the behavior of each ranking. For example, we found that predation risk decreases with increased canopy height. When a group occupies some tree, high ranking-mother will dominate the higher position on the canopy tree and food proportion more than a low-ranking mother [26].
Table 1. The LTMs Group Composition
| NO | I | J | SA | A | ||||
|---|---|---|---|---|---|---|---|---|
| M | F | M | F | M | F | Tot | ||
| 1 | 4 | 3 | 3 | 3 | 5 | 4 | 3 | 25 |
| 2 | 5 | 4 | 4 | 6 | 5 | 3 | 4 | 31 |
| 3 | 7 | 6 | 5 | 6 | 7 | 5 | 5 | 41 |
| 4 | 6 | 5 | 4 | 4 | 7 | 5 | 5 | 36 |
| 5 | 7 | 5 | 6 | 5 | 8 | 5 | 5 | 41 |
| 6 | 9 | 7 | 7 | 9 | 9 | 8 | 6 | 55 |
| Tot | 38 | 30 | 29 | 33 | 41 | 30 | 28 | 229 |
M: Male; F: Female; I: Infant; J: Juveniles; SA: Sub-adult; A: Adult
Table 2. The LTMs Sex Ratio
| No | Male | Female | Sex Ratio |
|---|---|---|---|
| 1 | 10 | 11 | 1 : 1.1 |
| 2 | 13 | 13 | 1 : 1 |
| 3 | 17 | 17 | 1 : 1 |
| 4 | 14 | 16 | 1 : 1.1 |
| 5 | 15 | 19 | 1 : 1.3 |
| 6 | 24 | 22 | 1.1 : 1 |
| Total | 93 | 98 | 1 : 1.1 |
Table 3. Crude Birth Ratio of LTMs
| No | Infant | Productive Females | Crude Birth Ratio |
|---|---|---|---|
| 1 | 4 | 8 | 0.50 |
| 2 | 5 | 9 | 0.56 |
| 3 | 7 | 12 | 0.58 |
| 4 | 6 | 12 | 0.50 |
| 5 | 7 | 13 | 0.54 |
| 6 | 9 | 15 | 0.60 |
| Total | 38 | 69 | 0.55 |
Table 4. Mortality Rate of LTMs
| Mortality | ||||
|---|---|---|---|---|
| Point | MI-J | MJ-SA | MSA-A | |
| 1 | 0.14 | 0.17 | 0,75 | |
| 2 | 0.04 | 0.38 | 0,67 | |
| 3 | 0.14 | 0.30 | 0,70 | |
| 4 | 0.25 | 0.13 | 0,70 | |
| 5 | 0.08 | 0.33 | 0,74 | |
| 6 | 0.02 | 0.36 | 0,72 | |
| Average | 0.11 | 0.28 | 0.71 | |
MI-J : Mortality rate from Infants to Juvenile
MJ-SA: Mortality rate from Juveniles to Sub-adults
MSA-A: Mortality rate from Sub-adults to Adults
Age-class ratio
The population structure of LTMs in the study area based on age class is presented in Figure 3. Figure 3 shows that each group at the observation point has quite a similar age class ratio. The population structure of LTMs in Ir. H. Djuanda GFP shows a regressive pattern, with an average proportion of infants 16.59%, juveniles 25.76%, sub-adults 32.31%, and adults 25.33%. This pattern is characterized by fewer individuals in the younger group and tends to increase in the older age class [25]. A declining population generally indicates an unstable growth, which will decrease the population and become extinct. However, this can also be caused by the qualitative method of grouping age classes. It is often difficult to estimate the age of animals in nature. The classification usually uses morphological characteristics. Hence, the age class does not have the same age range and causes an accumulation of individuals in a certain age class [20].
LTMs's Population Growth
Based on the Lefkovitch matrix modeling results, the population growth for each LTMs group is listed in Figure 4. The estimate of the total population of LTMs in Ir. H. Djuanda GFP in 2046 is 1128 individuals, or about 4.92 times the population in 2021. The annual population growth rate for each group is 15-25%, with an average of 19.7%. This growth rate is comparable to one of the LTMs population in Paliyan SM and Kaliurang Forest, i.e., 20-30% [20], and much higher than Peucang Island, i.e., 11.51% [12]. The growth rate difference can be related to many factors, particularly to the variation in population structure and habitat characteristics. Population structure can be in age class proportions, and the proportion of female parent ranks in the group as described in the previous section. Habitat characteristics determine the abundance of forage sources, which affect the population size and birth rate of a group. For example, there has been an increase in the group size of LTMs in areas that are increasingly disturbed by human activities, such as a study conducted in Lampung province [17].
3.2. Minimum Viable Population Size
The MVP of each group of LTMs is presented in Figure 5. The average MVP of each class is 11 for infants, 7 for juveniles, 11 for sub-adults, and 9 for adults. The MVP size of each group is generally almost the same as the current year group size, with an average of 38 individuals per group. When calculated in one area, the MVP of LTMs is 230 individuals with an average group size of 38 individuals.
3.3. Preparation of Population Control Scheme
Based on Indonesian Government Law No. 28 2011, the Grand Forest Park area can use wild animals for research and scientific activities or population development, such as in captivity. In addition, the use of wild animals for trading purposes can be carried out on wild animals that are not protected, either from captivity or capture from nature. Some of the animal utilization activities mentioned above may be carried out while maintaining the preservation of the population of related animals in their natural habitat.
LTMs are not classified as protected animals in Indonesia; thus, controlling the LTMs population using several treatments, such as relocation and captive activities for trading, are allowed. Especially for captive activities, it can only be carried out after the issuance of a captive and trading activity permit by providing information on population demographics, habitat conditions, and harvest quotas (The Regulation on Forestry Minister no 19 2005). For LTMs trading activities, these animals must come from captivity that has special treatment, from maintenance to post-harvest inspection, according to the CITES Annex A30 file about Macaca fascicularis.
According to Ir. H. Djuanda GFP manager, LTMs problems are caused by the low carrying capacity of the area, the absence of natural predators, and the existence of tourism, residential and agricultural activities both inside and outside the area. This information is obtained from monitoring around the area and reporting by local communities, which the management accommodates. Currently, there is no specific program for controlling the LTMs population. There was a screening activity of 200 monkeys in 2018 through the assistance of the Provincial Conservation Agency. However, the population control activities did not use certain references, such as the use of MVP. Regarding the LTMs problem, the management is open to any recommendations regarding population control activities that can be carried out in the Ir. H. Djuanda GFP.
Based on the above regulation, this study suggests two schemes of LTMs population control: age class control and colony control. Age class control is applied for the age class whose size has passed the MVP size, while colony control is applied when the size of all age classes in a group/colony has passed the MVP size. Furthermore, the implementation of population control activity cannot be done next year. Although the LTMs population in 2021 is almost the same as the MVP in general, there are differences in the age class ratio between the two population demographics. The MVP has a larger proportion of infant age classes than older age classes, while the 2021 LTMs population age class ratio has the opposite condition. Population control can only be carried out after several years after all age classes have passed their MVP.
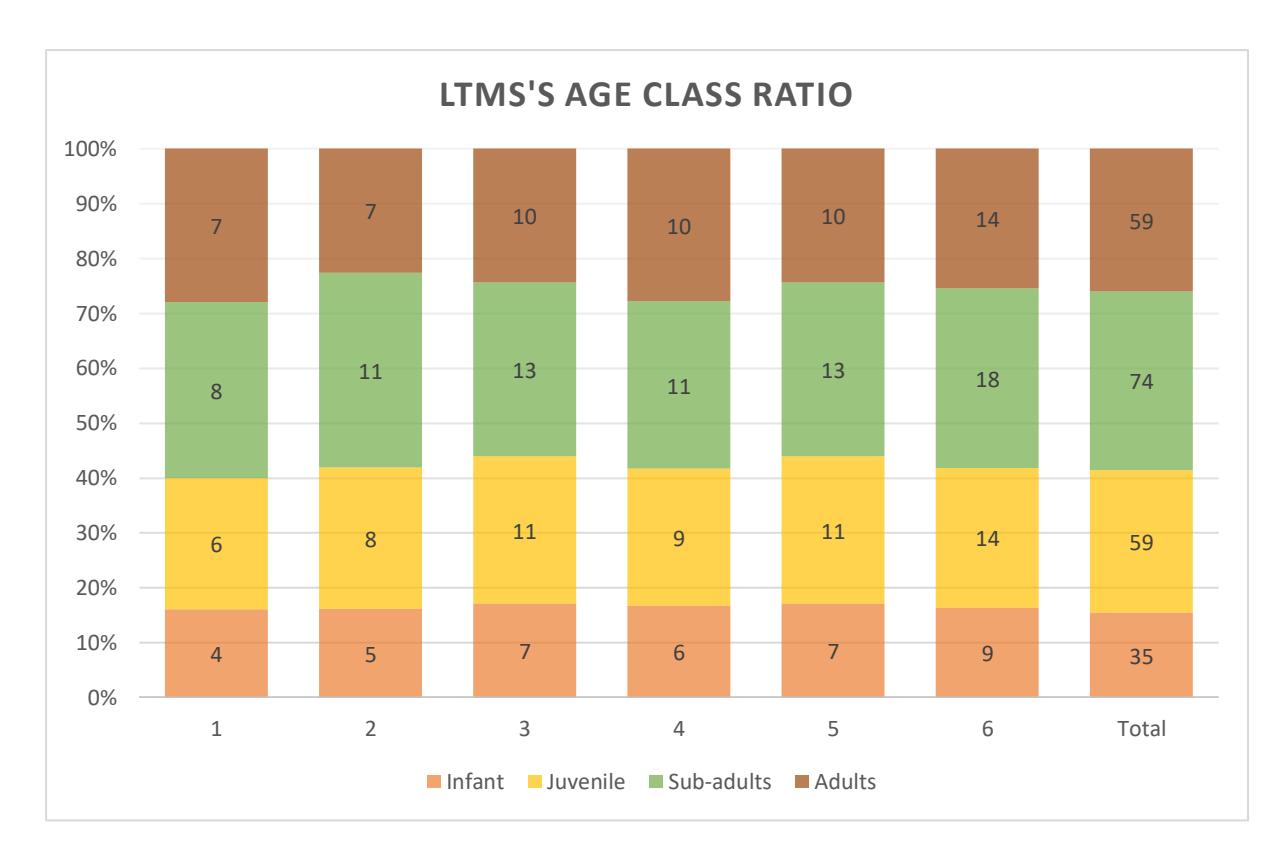
Figure 3. Age-class Ratio of LTMs
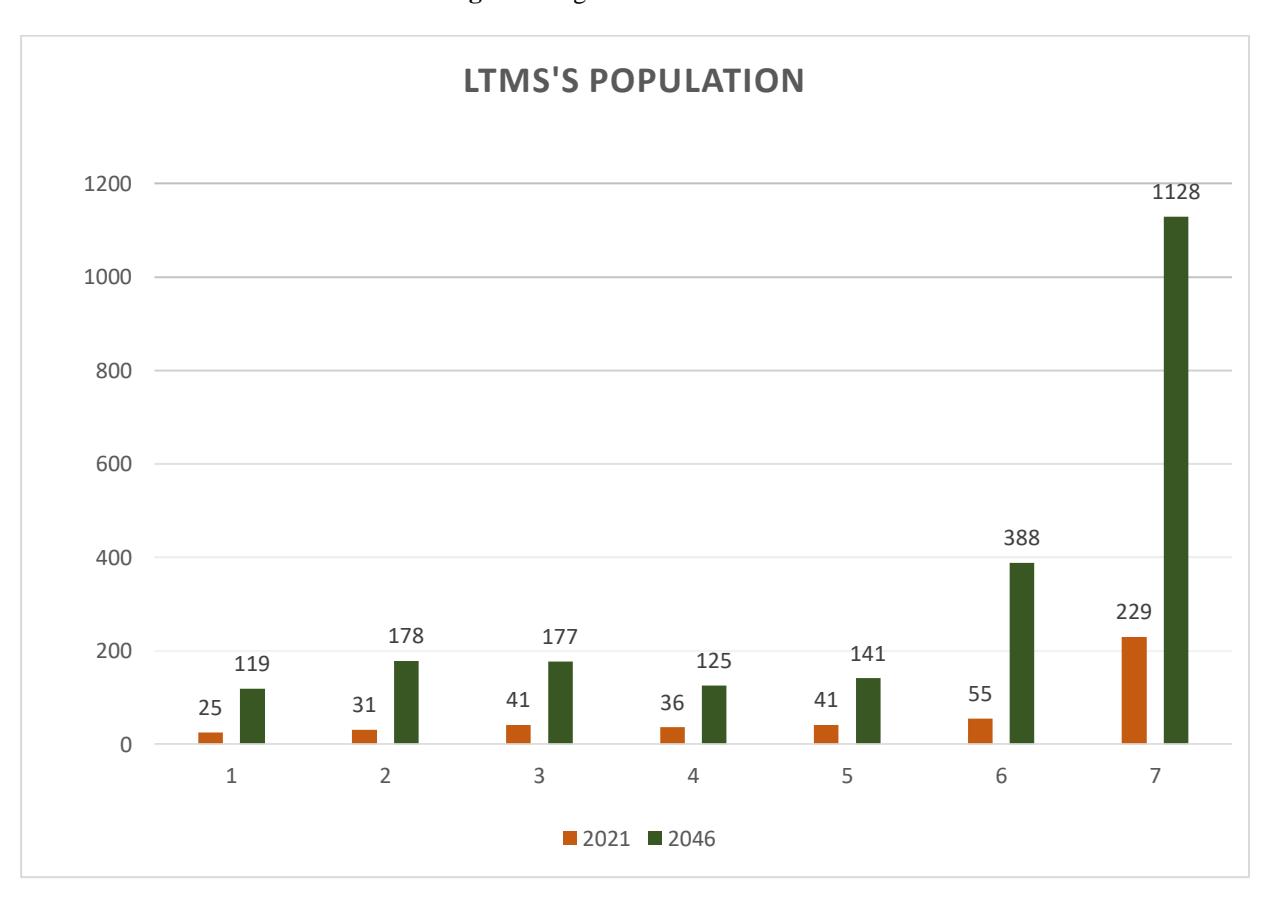
Figure 4. Comparison of LTMs Population Size in 2021 and 2046 based on current growth rate
Based on the simulation of population growth and MVP application both in age class and in groups, the details of the time, the number of individuals, and control costs of each scheme are shown in Table 5. In the age class control scheme, the total controlled population for 25 years is 334 individuals, with an estimated expenditure of IDR 66,800,000.00 and an estimated gross income from captive activities of IDR 567,800,000.00-. In the colony control scheme, the total number of controlled population for 25 years is 406 individuals, with an estimated expenditure of IDR 81,200,000.00 and an estimated gross income from captive activities of IDR 690,200,000.00-. However, there is no certainty of the success of this activity given the availability of inadequate data. Therefore, population control measures need to be carried out with other actions, such as providing new feed areas and limiting zones with human areas, making no-feeding and no-littering boards. This is intended to minimize as much as possible the interactions that can occur between LTMs and humans. When interactions between humans and LTMs can be limited, access to anthropogenic feed is cut off, and LTMs will return to consuming natural feed available in the area [1].
4. Conclusion
The MVP of LTMs in Ir. H. Djuanda GFP is 230 individuals, with an average group size of 38 individuals. The average MVP for each age class is 11 for infants, 7 for juveniles, 11 for sub-adult, and 9 for adults. Population control schemes can be carried out by age class control and colony control. The total number of controlled individuals for the next 25 years in the age class control scheme is 334 individuals, while in the colony control scheme is 406 individuals. This study recommends integrated management of wildlife populations that combines population control and income generation from legal animal trading.
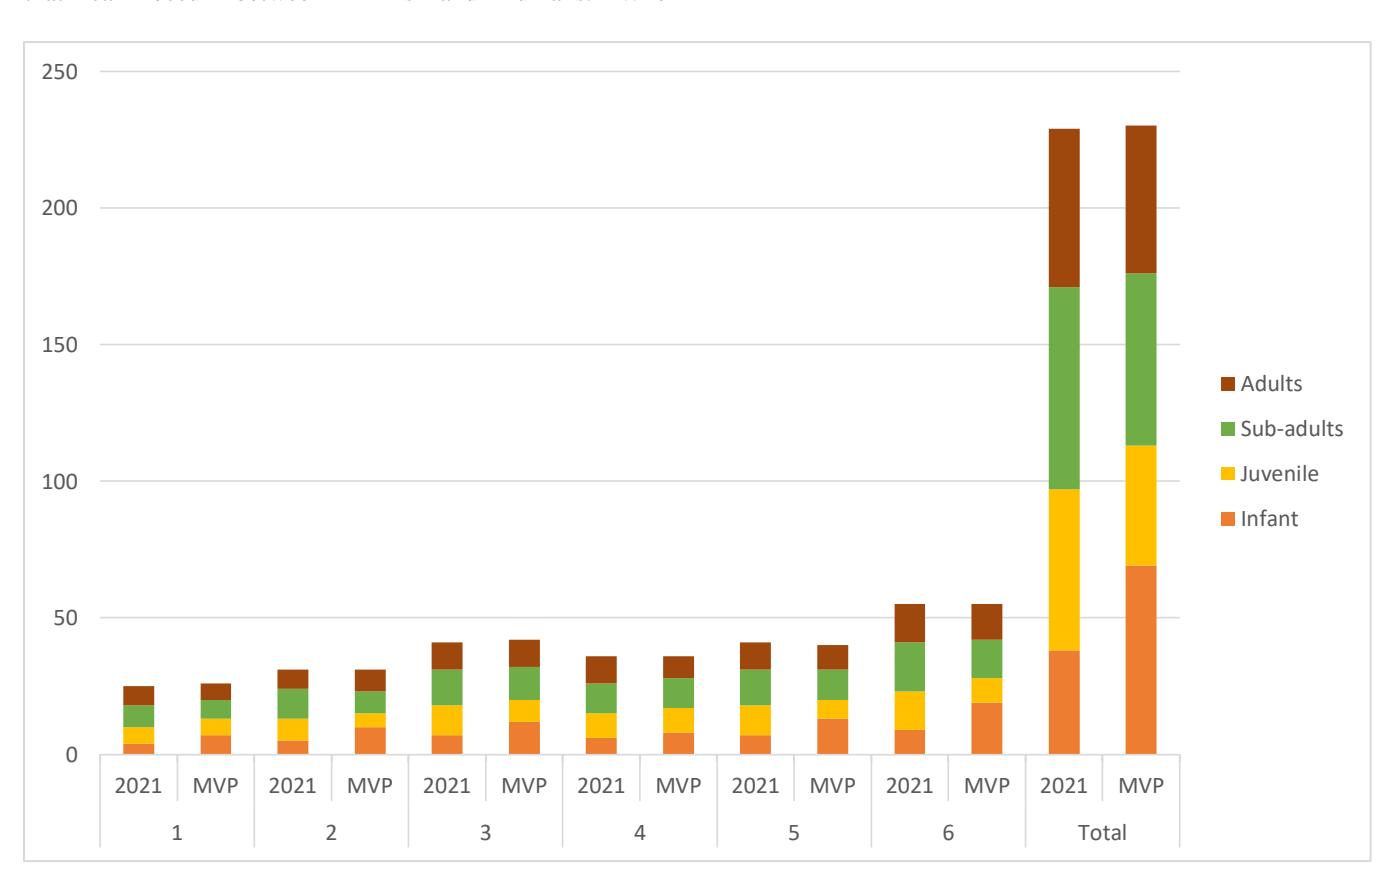
Figure 5. Comparison of LTMs Population Structure in the Year 2021 and MVP
No Years Control Cost estimation (IDR 200.000 @ Ind., during 25 Yrs) Age-class Control Colony Control Age-class Control Colony Control Ind. Cost Ind. Cost 1 J: 9,10,13,15,18,20,22,25 SA :0 A: 0,1,2,4 – 25 every 7 years, starting from the 9th year 35 IDR 7,000,000.00 43 IDR 8,600,000.00 2 J: every years SA: 0 A: every odd year from 1st years every 7 years, starting from the 8th year 58 IDR 11,600,000.00 67 IDR 13,400,000.00 3 J: 0,2-8, 10, 12-17, 21-25 SA:0 A: every years every 10 years, starting from the 11th year 50 IDR 10,000,000.00 60 IDR 12,000,000.00 4 A : every years every 12 years, starting from the 12th year 29 IDR 5,800,000.00 52 IDR 10,400,000.00 5 J: every years SA:0 A : every odd year every 9 years, starting from the 10th year 45 IDR 9,000,000.00 48 IDR 9,600,000.00 6 J:every years SA: 0 A: 0-2; 4,6, etc., with every even year every 4 years, starting from the 6th year 117 IDR 23,400,000.00 136 IDR 27,200,000.00 Total 334 IDR 66,800,000.00 406 IDR 81,200,000.00
Table 5. Comparison between LTMs Population Control Scheme
I: Infant; J: Juveniles; SA: Sub-adult; A: Adult
Estimated Gross Income From Captive Activities IDR 567,800,000.00 IDR 690,200,000.00
Acknowledgements
The authors thank the UPTD Ir. H. Djuanda GFP as the area manager for the great support of this research.