
1. Introduction
Cervical cancer remains one of the leading causes of mortality in Indonesia. Global Cancer Observatory: Cancer Today (gco.iarc.fr/today) estimated that in 2020, Indonesia would be the third leading country with the highest cervical cancer incidences — with 36,633 cases with 21,003 mortalities [1].
Human papillomaviruses (HPV), especially the highrisk types, are known as the leading risk factor for cervical cancer [2]. HPV is transmitted through sexual intercourse. HPV infection occurs at a site of epithelial abrasion. Persistent infection by high-risk types induces progression to carcinoma [3].
This day, HPV infections can be prevented through virus-like particle (VLP)-based immunization. However, HPV vaccination coverage in Indonesia remains low. Even though high HPV vaccination coverage has been attained in several cities by 2018, it is not the case for other regions, especially rural areas [4]. HPV vaccination costs have soared since Indonesia stopped the funding scheme under the cooperation with Global Alliance for Vaccines and Immunizations (GAVI) for the national HPV vaccination in 2019. Thus, HPV vaccines have become more unaffordable for most Indonesian citizens of a lower-middle-income class.
HPV vaccines contain the HPV virus-like protein (VLP) consisting of solely major capsid protein L1 as the active substance [5]. Up until now, the L1 protein has been produced through the expression of the L1 gene using the cells of various organisms [6-10], and the L1 expression rates vary across different kingdoms of life [7, 11]. Moreover, previous experiments on heterologous L1 expression demonstrated that varying nutrient-rich media composition led to varying L1 production rates [12]. Thus, the choice of organism and media formulation are the decisive factors in building the L1 expression system with a higher L1 production rate. The higher the L1
production rate, the lower the selling prices of VLP and, hence, vaccine prices [13]. In addition, the L1 protein produced has to be immunogenic in order to elicit immune responses.
Therefore, this study is aimed to perform a systematic review and meta-analysis to compare the L1 production rate using various organisms and immunogenicity. We also investigated the treatments affecting L1 production rate and immunogenicity.
2. Methodology
2.1. Scope and Search Strategy
The literature search was conducted on September 7, 2021, through PubMed as the search engine. The search terms used were: "human papillomavirus," AND "L1" AND "expression." Only the articles in English were included in this systematic review.
2.2. Inclusion and Exclusion Criteria
Firstly, we screened all the articles based on the titles and abstracts and excluded articles unrelated to the heterologous expression of L1. After that, we performed the second stage of screening and included articles containing the data on L1 titer and induction period. We excluded articles that did not include one or two data mentioned above. Articles of co-expressions and chimeric expressions were also excluded, except for the co-expressions of L1 and the chaperone proteins, since those co-expressions increased the L1 titer.
2.3. Meta-analysis
In this study, the immunogenicity is represented by the post-injection anti-L1 IgG titer in mice (Mus musculus). The data of L1 titer, induction period, and anti-L1 IgG titer were extracted from 19 articles that have passed the articles screening.
2.4. Calculation of L1 Production Rate
The L1 titer and expression induction period data were extracted from the final selected articles. We calculated the L1 average production rates according to Equation (1).
\[L1 \ average \ production \ rate = \frac{L1 \ titre}{expression \ induction \ period}\] \[(1)\]
2.5. Hypothesis Testing
We performed Student's t-test using Minitab 17 to determine the statistical significance in comparison of the mean L1 average production rate and the mean anti-L1 IgG titer between each organism.
2.6. Determination of Treatments Affecting L1 Production Rate and Anti-L1 IgG Titer
To seek the treatments affecting the L1 production rate and anti-L1 IgG titer, we determined the Pearson's correlation coefficient for the correlation between each treatment with L1 production rate and anti-L1 IgG titer using Minitab 17.
3. Results and discussion
3.1. Articles Screening
The search yielded 891 papers (1983 to 2021) (Figure 1). The first screening based on titles and abstracts excluded 768 articles, leaving 123 articles. Following the second screening based on the data availability, 104 articles were excluded. Ultimately, the selected 19 articles were used in the meta-analysis.
3.2. Characteristics of Selected Articles
The selected articles were categorized according to the organisms used as the expression hosts (Table 1). The organisms include Escherichia coli [6, 14-16], Saccharomyces cerevisiae [7, 17-19], Pichia pastoris [8, 20], baculovirus-infected Spodoptera frugiperda [7, 21-25], Drosophila [26], Vero cell [9], MRC-3 cell [9] and tobacco (Nicotiana benthamiana) [10].
3.3. Production Rate
We extracted 43 data on L1 titer and expression induction period from the selected articles. We calculated each organism's mean L1 average production rate and summarized them in Figure 2. As illustrated in Figure 2, E. coli were capable of producing L1 with the highest rate, even though the obtained data were insufficient to support this claim at 95% confidence level due to the high variability of L1 average production rate using E. coli (Supplementary Figure 1 and 2). Pearson's correlation analysis for the correlation between 18 treatments and L1 production rate (Supplementary Table 1) revealed that the concentration of glucose, IPTG, NH<sub>4</sub><sup>+</sup>, K<sup>+</sup>, Ca<sup>2+</sup>, Mn<sup>2+</sup>, Fe<sup>2+</sup>, Zn<sup>2+</sup>, B<sub>4</sub>O<sub>7</sub><sup>2-</sup>, H<sub>2</sub>PO<sub>4</sub><sup>-</sup>, HPO<sub>4</sub><sup>2-</sup>, Mo<sub>7</sub>O<sub>24</sub><sup>6-</sup> and citric acid had a positive correlation with L1 production rate in E. coli (R = 0.820 (P < 0.005), except for IPTG, to which had a correlation coefficient of R = 0.619 (P < 0.005)). Those were the components of the R/2 medium used by Bang et al. [6]. Bang et al. successfully produced 4,6 g/L of L1 capsid using E. coli within 4 h expression induction period on this medium, and it was the highest L1 expression rate recorded in this systematic review.
Table 1. Articles classification based on organisms used in experiments.
| Organism | Number of Articles |
|---|---|
| Escherichia coli | 4 |
| Saccharomyces cerevisiae | 5* |
| Pichia pastoris | 2 |
| baculovirus-infected Spodoptera frugiperda | 6* |
| Drosophila | 1 |
| mammalian cells | 1 |
| Nicotiana benthamiana | 1 |
* One of the articles compares the L1 expression performance of two organisms, including S. cerevisiae and baculovirus-infected S. frugiperda.
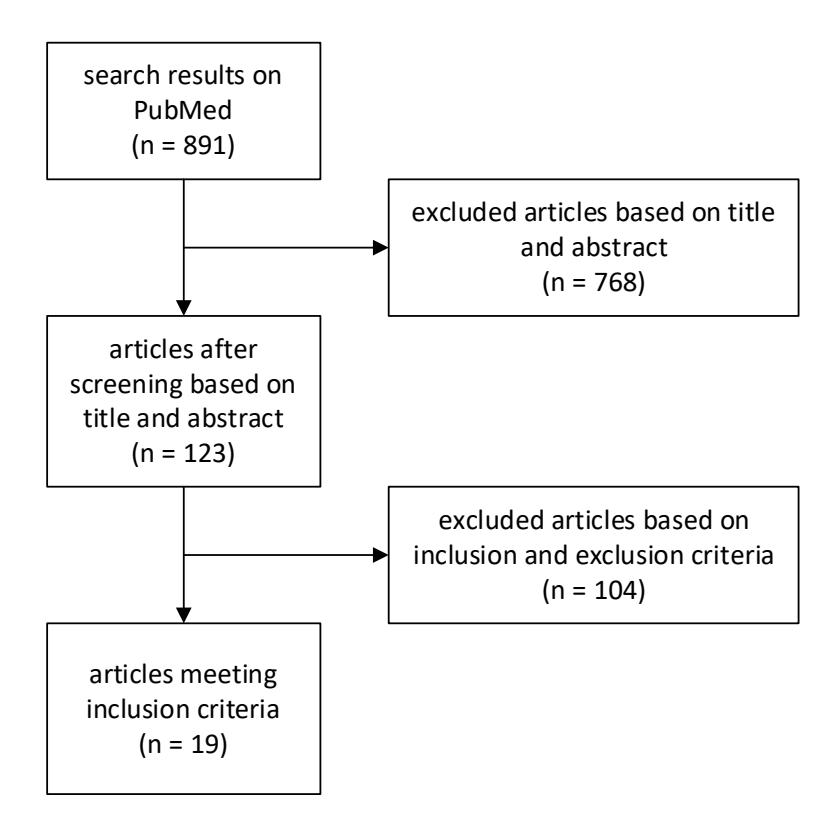
Figure 1. Summary of articles screening.
The L1 production, which attained the highest L1 production rate, is the only study that used the mineral-rich R/2 medium. Bang et al. used E. coli as the L1 expression host in their study. None of the other studies used similar mineral-rich media as this study. Thus, it is thought that adding the mineral salts into the growth media may escalate the L1 production rates. The mineral salts have been demonstrated to play an essential role in promoting cellular growth. K+ and Mn2+ are the cofactors for several enzymes involved in glycolysis. Ca2+ induces the assembly of FtsZ proteins to form protofilaments [27]. The protofilaments can assemble into a Z-ring which drives the membrane invagination during cell division [28]. Fe2+ is a ligand for cytochrome and a precursor for Fe-S proteins. Both of those proteins play an essential role in the electron transport chain in cellular respiration. Zn2+ was reported to have a major role as the component of the DNA-binding domain on DNA primase [29]. B4O7 2− is known as the ligand of autoinducer-2 (AI-2) protein which plays a role in quorum sensing [30] to induce biosynthesis of flagella, chemotaxis, and biofilm formation [31]. H2PO4 − and HPO4 2−, aside from being the pH buffer, are needed in the biosynthesis of nucleic acids and phospholipids [32]. Mo7O24 6− is the molybdenum (Mo) source. Mo serves as a ligand for nitrate reductase cofactor, which plays an important role in catalyzing anaerobic nitrate reduction into ammonia [33].
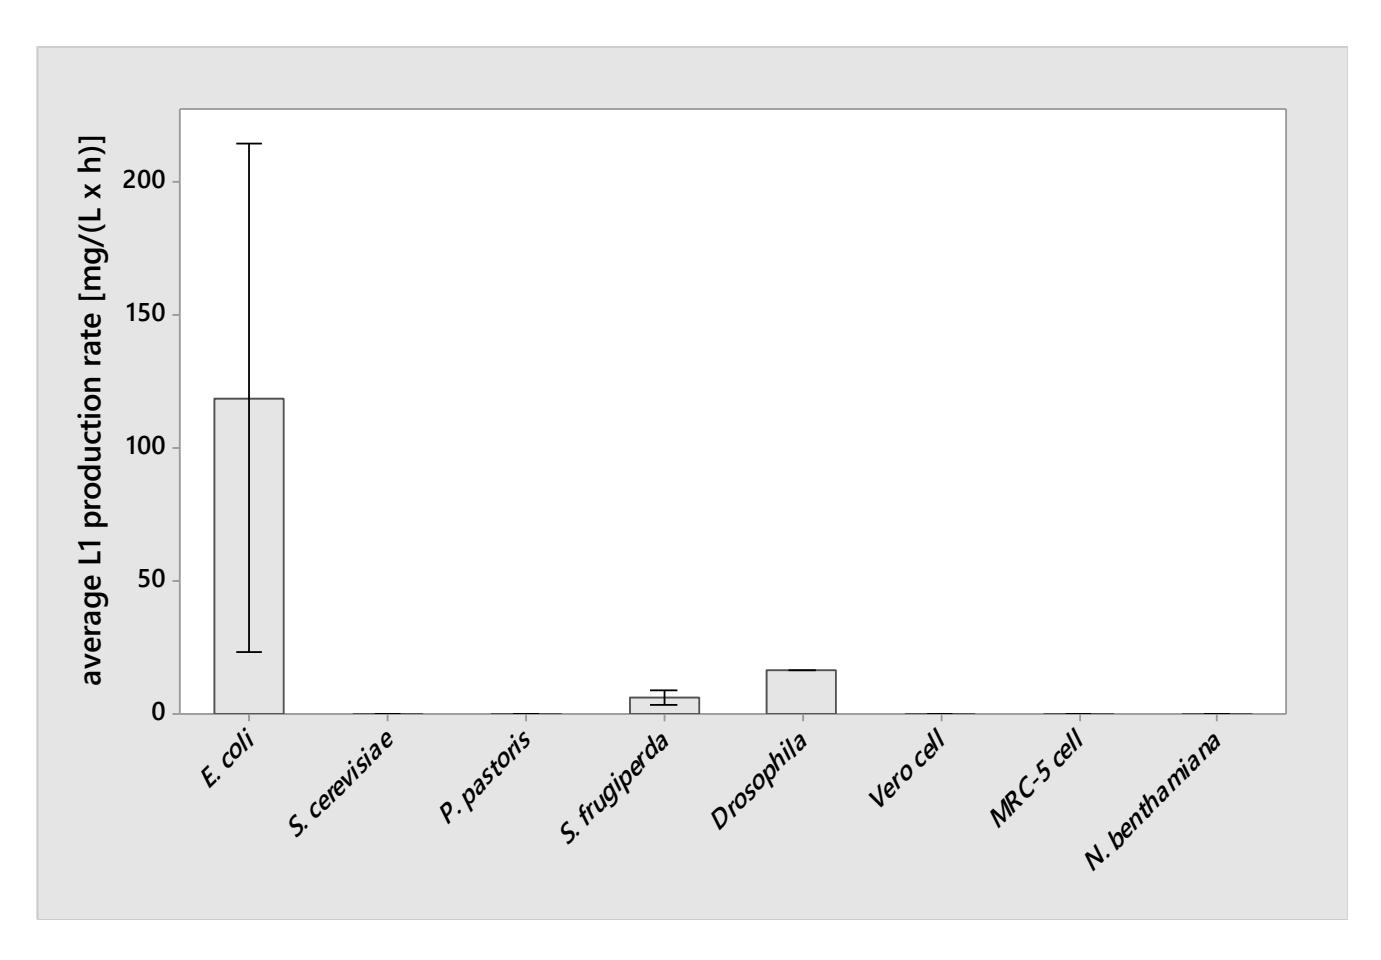
Figure 2. Average L1 production rate for each organism. Bars show the mean of average L1 production rate (not shown for the organism with single datum). Interval bars show the standard deviation. Number of data: Escherichia coli (n = 12), Saccharomyces cerevisiae (n = 17), Pichia pastoris (n = 3), baculovirus-infected Spodoptera frugiperda (n = 6), Drosophila (n = 1), Vero cell (n = 1), MRC-5 cell (n = 1), Nicotiana benthamiana (n = 2).
Based on this finding, we could suggest the potential idea of implementing the mineral-rich media in L1 production using other organisms. Enriching the media with mineral salts could promote cell viability and thus increase the L1 expression rate using organisms other than E. coli. This potential has to be explored further in other organisms.
3.4. Anti-L1 IgG Titer
We extracted 18 data of anti-L1 IgG titer from the selected articles. The mean of anti-L1 IgG titer for each organism was calculated and summarized in Figure 3. As shown in Figure 3, the L1 protein expressed by Saccharomyces cerevisiae induced the highest mean of anti-L1 IgG titer in mice, albeit the weak evidence at 95% confidence level [12, 19]. In heterologous L1 expression using S. cerevisiae, galactose was added to the media as the inducer [7, 12, 17-19]. However, aside from inducing the heterologous expression, galactose could be utilized as the building block of oligosaccharides in protein glycosylation [34, 35]. In S. cerevisiae, the expressed protein is glycosylated [36], and this might alter the immunogenicity of expressed L1 protein [37]. However, injection doses still became the main factor that affected the immunogenicity, as suggested by Pearson's correlation analysis for 3 treatments (glucose concentration, galactose concentration, and doses) and anti-L1 IgG titer (Supplementary Table 2). The correlation analysis revealed a positive correlation of injection doses with anti-L1 IgG titer (R = 0.814 (P < 0.005) in S. cerevisiae. Although there is evidence that was varying glucose and galactose concentrations led to different anti-L1 IgG titer [12], in this meta-analysis, further observation on scatter diagrams (Supplementary Figures 4 and 5) indicated a weak potential relationship between glucose concentration and anti-L1 IgG titer as well as galactose concentration and anti-L1 IgG titer (P > 0.05). Furthermore, the P-value suggested insufficient data available to conclude the relationships. This study calls for more experiments investigating the effect of glucose and galactose on the glycosylation performance and thus anti-L1 IgG titer.
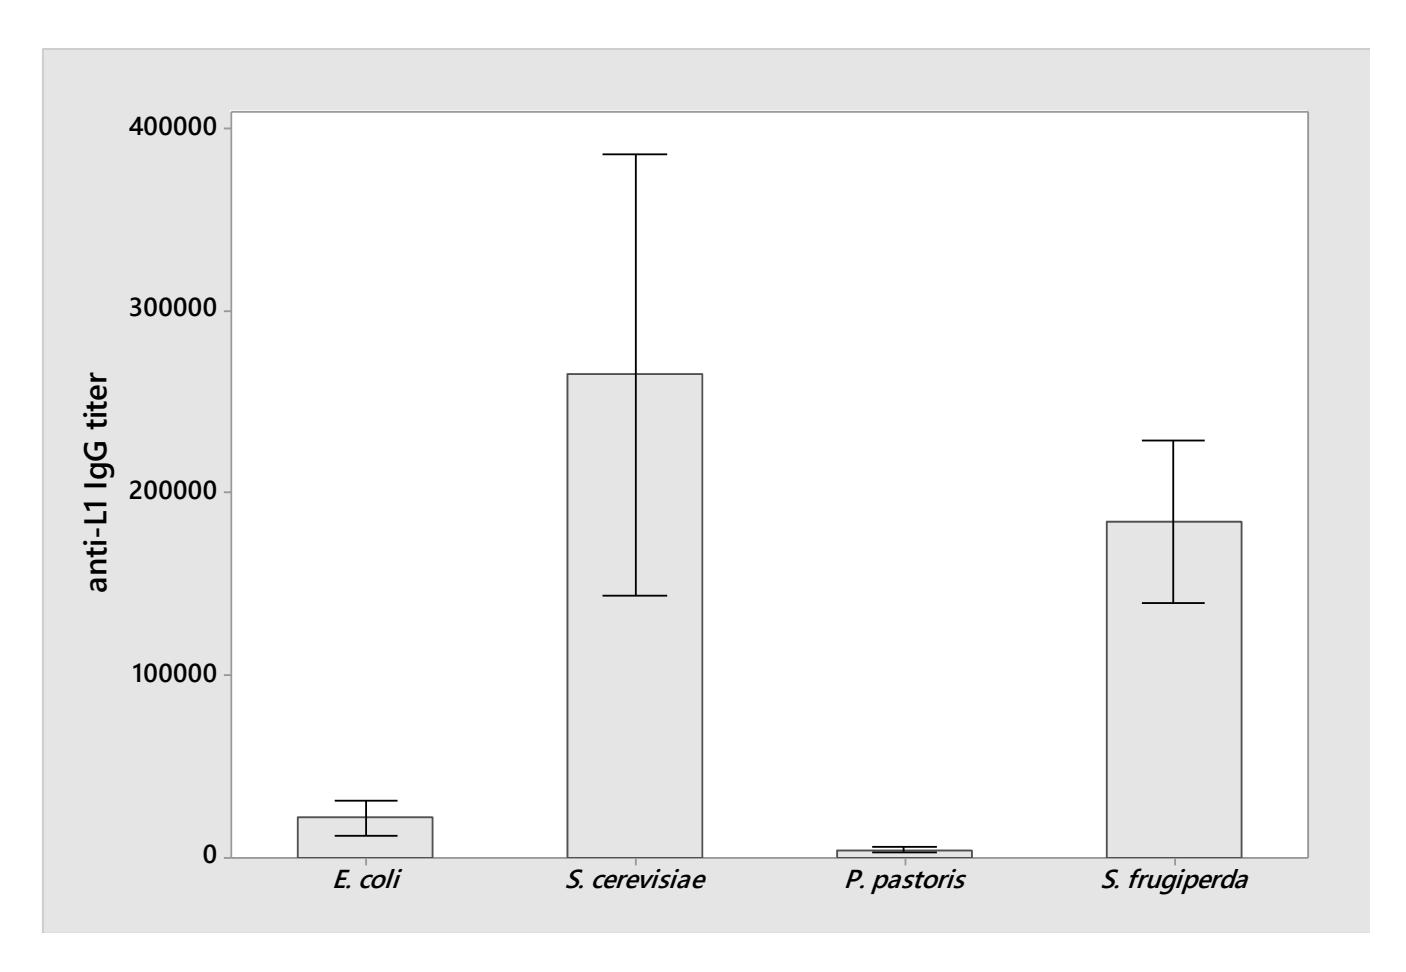
Figure 3. Anti-L1 IgG titer induced by L1 from each organism. Bars show the mean of IgG titer. Interval bars show the standard deviation. Number of data: Escherichia coli (n = 2), Saccharomyces cerevisiae (n = 10), Pichia pastoris (n = 2), baculovirus-infected Spodoptera frugiperda (n = 4).
4. Conclusion
This is the first study to perform a systematic review and meta-analysis on heterologous L1 expression rate in various organisms and its immunogenicity. The data gathered through this systematic review has yet to provide strong evidence for the statistical significance of different L1 production rates and IgG titers. Meta-analysis revealed weak evidence that E. coli produced L1 with the highest rate at 95% confidence level. The highest mean IgG titer was observed on the L1 gene expressed by Saccharomyces cerevisiae, albeit the weak evidence at 95% confidence level and its dependence on immunization doses. Pearson's correlation analysis showed that the concentration of glucose, IPTG, NH<sub>4</sub><sup>+</sup>, K<sup>+</sup>, Ca<sup>2+</sup>, Mn<sup>2+</sup>, Fe<sup>2+</sup>, Zn<sup>2+</sup>, B<sub>4</sub>O<sub>7</sub><sup>2-</sup>, H<sub>2</sub>PO<sub>4</sub><sup>-</sup>, HPO<sub>4</sub><sup>2-</sup>, Mo<sub>7</sub>O<sub>24</sub><sup>6-</sup>, and citric acid had a positive correlation with L1 production rate in E. coli, and in S. cerevisiae, injection doses had the positive correlation with IgG titer. Additionally, this work provides evidence of the potential role of mineral salts in heterologous L1 expression.
Supplementary
Supplementary material for correlation analysis is provided along with this manuscript.