
1. Introduction
Seaweeds are marine commodities that are commonly processed into dried forms or hydrocolloid extracts (e.g., agar, carrageenan, and alginate) for food industry application. Seaweeds are also potential feedstocks for biofuel, nutraceuticals, cosmetics, and other valuable products, due to their bioactive components, such as polyunsaturated fatty acids (PUFAs), pigments, vitamins, minerals, sterols, phenolics, and terpenoids. Those bioactive compounds potentially possess antibacterial, anti-inflammatory, antioxidant, and anti-cholesterol that could treat various health issues, such as hypertension, hyperlipidemia, thrombosis, obesity, diabetes, tumor, and cancer [1, 2]. Furthermore, seaweeds have a high growth rate and photosynthesis efficiency with low lignin content, making seaweed biomass processing into products more straightforward. Seaweed cultivation also does not require freshwater or fertilizer, and it does not compete with agricultural land [1, 3].
Indonesia is the second globally largest seaweed producer, with a productivity of 11.63 million metric tons
1 Independent Researcher
Fisheries Product Processing Department, Karawang Polytechnic of Marine and Fisheries, 41314, Karawang, Indonesia
3CV Agro Niaga Utama, 41352, Karawang, Indonesia
4Bioprocess Engineering, Wageningen University and Research, 6700 AA, Wageningen, the Netherlands
*) Corresponding author; e-mail: fadhlullah.mbp@gmail.com in 2015 [4]. Karawang Regency is a seaweed cultivation center in Indonesia, particularly red seaweed Gracilaria sp., with a productivity of 750.05 metric tons in 2020 and 60 seaweed cultivation business units in 2021 [5, 6]. Karawang also acts as a hub to collect seaweeds from the neighboring areas (e.g., Bekasi, Subang, Indramayu) and process them into dried forms. The dried seaweeds are traded to nearby agar industries, such as PT. Agarindo at Tangerang [7].
However, most seaweed industries in Indonesia, including Karawang, still focus on processing a single product (e.g., agar from Gracilaria sp.), which generates a lot of residual waste [5]. Furthermore, the biomass that does not meet the standard quality or rejected biomass is also considered waste [1]. The waste is traditionally used as a supplementary feed for the nearby fish ponds and construction materials mixture that is low in economic value or discarded, creating environmental issues [8]. On the other hand, hypothetically, seaweed biomass waste still contains bioactive compounds that can generate more valuable products [2].
The seaweed biomass waste could be utilized to generate various high-value products, such as pharmaceuticals, fine chemicals, and biofuel, simultaneously through the biorefinery concept approach. Biorefinery is a production scheme of high-value products by maximizing biomass utilization and revenue, minimizing production cost and waste generation or zero waste [1-3]. Biorefinery application on seaweed biomass waste could contribute to the sustainable development goals (SDGs), including food security, sustainable natural resources usage, environmental impacts reduction, employment creation, and competitiveness reinforcement. However, the biorefinery on seaweed biomass waste is still an emerging approach. Therefore, its development requires identifying potential products and processes, designing the integrated processes, and assessing the economic and life-cycle to ensure the seaweed biomass waste-based industrial activities are optimum and economically feasible [1, 9].
Based on the above background and problems stated, this preliminary study aims to evaluate the economic potential of seaweed Gracilaria sp. biomass waste through a biorefinery approach. This case study is based on a representative seaweed production unit in Karawang, Indonesia, using the data on seaweed biomass waste productivity and biomass components. The results of this preliminary study can serve as a base for further advanced laboratory works, techno-economic analysis, and lifecycle assessment. Hopefully, this study could also trigger the development of eco-friendly and bio-based seaweed industries with more diverse valuable products.
2. Materials and Methods
2.1. Seaweed Biomass Waste Sample and Production Data Collection
Seaweed (Gracilaria sp.) biomass waste sample was collected in January-February 2021 during the rainy season from the warehouse of Koperasi Mina Agar Makmur, Tirtajaya District, Karawang Regency, West Java, Indonesia (6°00'21"S 107°14'02"E). Koperasi Mina Agar Makmur is a business unit in Karawang engaged in the seaweed processing area. Seaweed Gracilaria sp. biomass was identified according to the seaweed identification book [10]. Gracilaria sp. has brownish red to yellowish or greenish color, cylindrical thallus (with solid, brittle, cylindrical, to compressed branches), and dichotomously branched. The crude seaweed biomass waste sample was stored in a plastic container at room temperature before further laboratory analysis.
The data on seaweed biomass waste production was gathered through an interview with the head of Koperasi Mina Agar Makmur in January 2021. The collected data comprised seaweed processing steps, seaweed quality parameters, the quantity of weekly dried seaweed shipping, and monthly seaweed biomass waste generated.
2.2. Seaweed Biomass Waste Composition Analysis
Proximate analysis of seaweed biomass waste, comprising moisture content, total proteins, total lipids, ashes, and total carbohydrates, was carried out in Regional Technical Unit Laboratory, Fisheries Product Quality Testing and Implementation, Department of Fisheries and Marine Affairs of West Java, Cirebon, Indonesia. The moisture content, total proteins, total lipids, and ashes were analyzed following the National Standardization Agency of Indonesia described in reference [11-14]. Total carbohydrates were analyzed through a method described by the Association of Official Analytical Chemists [15].
Analysis of fatty acids, amino acids, chlorophylls, βcarotenes, vitamin C, and heavy metals were carried out in the laboratory of PT. Saraswanti Indo Genetech, Bogor, Indonesia. Fatty acids were analyzed using a gas chromatography (GC) protocol according to reference [16]. Amino acids (without cysteine, methionine, tryptophan, asparagine, and glutamine) were analyzed using an ultraperformance liquid chromatography (UPLC) protocol according to reference [17]. Chlorophylls, calculated as cuprum, were analyzed by an inductively coupled plasmaoptical emission spectrometry (ICP-OES) protocol according to reference [18]. Vitamin C and β-carotenes were analyzed by a high-performance liquid chromatography (HPLC) protocol according to reference [19, 20]. Heavy metals were analyzed by an inductively coupled plasma-mass spectrometry (ICP-MS) protocol according to reference [21]. All biomass composition was analyzed in duplicate, and the results were presented as mean ± standard deviation.
2.3. Potential Products Identification and Productivity Calculation
The identification of potential products from seaweed biomass waste was carried out through a literature search from April-August 2021. A scholarly web search engine, Google Scholar (https://scholar.google.com), with keywords of ("seaweed+biomass+waste+refinery") and ("red+seaweed+biomass+waste+refinery") was applied for literature search. The literature from the first five pages of the search results, with 3-5 referred websites per page, was used to identify the potential products.
The potential productivity of products generated from seaweed biomass waste was calculated according to Eq. (1).
\[P_{prod} = P_{BW} \times C_{prod.BW} \tag{1}\] is the potential productivity of the product (kg.year-1 ), is the productivity of seaweed biomass waste generated (kg.year-1 ), and is the product content in seaweed biomass waste (% or ppm).
2.4. Economic Potential Evaluation
The gross revenue of the products represented the economic potential of products generated from seaweed biomass waste. The gross revenue of the products was calculated according to Eq. (2).
\[GR_{prod} = P_{prod} \times V_{prod,unit}\] (2)
is the potential gross revenue of the product (USD.year-1 ), is the potential productivity of the product (kg.year-1 ), and is the selling price per unit of product (USD.kg-1 ). The selling price of products was obtained from an online web store (https://www.alibaba.com), accessed on October-November 2021.
3. Results and discussion
In this section, the productivity of seaweed biomass waste generation from the representative seaweed production unit in Karawang, Indonesia, will be presented. Then, the seaweed biomass waste composition will be displayed and discussed regarding the potential products made from the composition. Finally, the potential economic value of the products will be evaluated using information from the previous sub-sections.
3.1. Seaweed Biomass Waste Generation
Koperasi Mina Agar Makmur has the main business activity of pressing dried seaweed collected from seaweed farmers and trading the products as the feedstock for agar industries. The process flow diagram of seaweed pressing steps is shown in Figure 1. The average monthly seaweed collected from the seaweed farmers is 120 metric tons (flow 1). During the sortation step, the sorting of seaweed biomass is based on the quality, which is reflected by appearance (dark, not exposed to rain or whitish brown), morphology (long or short thallus), and aroma (product-specific, fresh or poor). Seaweed biomass waste is generated from the drying step (flow 6), in which the seaweed biomass is sun-dried. The generated waste from the drying step contains broken and wet seaweed due to exposure to rain. Additionally, seaweed biomass waste is also generated from storage 2, weighing 2, and pressing and packaging steps (flow 10, 12, and 14), containing broken seaweed. Seaweed biomass wastes from flow 6, 10, 12, and 14 were not sorted and kept in the warehouse before further handling. The average weekly dried and pressed seaweed shipped to the agar industry (flow 17) is 18 metric tons, while the average weekly seaweed biomass waste generated is one metric ton [8]. Assuming that one year equals 12 operational months and 52 working weeks, the overall annual pressing unit processes 1,440 metric tons of seaweed feedstocks from the farmers to produce 936 metric tons of dried and pressed seaweeds, with the seaweed biomass waste generated of 52 metric tons.
3.2. Seaweed Biomass Waste Composition and Potential Products
The proximate composition of seaweed Gracilaria sp. biomass waste, which consisted of total proteins, total lipids, total carbohydrates, ash, and moisture content, is shown in Table 1. The characterization of seaweed biomass waste composition is essential to identify potential products that can be generated and its biorefinery strategy [2].
3.2.1. Proteins and Amino Acids
The protein content in the seaweed biomass waste was 13.65 ± 0.02% DW. This value is within the range of seaweed protein content from the literature, 0.60 - 45.00% DW (Table 1), which is broad. The broad seaweed protein content could occur due to species, habitat, and seasonal variation [2]. Nonetheless, previous studies have indicated that seaweeds are high in protein content, comparable to the protein content in eggs, chickens, beef, fish, milk, and grains. Notably, red seaweed such as Gracilaria sp. has higher protein digestibility than green and brown seaweed [1, 2, 9, 22, 23, 25, 29, 30].
Table 1. The proximate composition of Gracilaria sp. biomass waste.
| Parameters | Gracilaria sp. biomass waste* | Literature* [1, 7, 22-28] |
|---|---|---|
| Total proteins (%) | \(13.65 \pm 0.02\) | 0.60 - 45.00 |
| Total lipids (%) | \(1.65 \pm 0.42\) | 0.30 - 7.10 |
| Total carbohydrates (%) | \(63.20 \pm 0.50\) | 3.80 - 78.70 |
| Ash (%) | \(21.51 \pm 0.06\) | 7.36 - 40.30 |
| Moisture (%) | \(22.00 \pm 0.25^{\#}\) | 4.53 - 11.91# |
Notes:
*Based on fresh weight (FW)
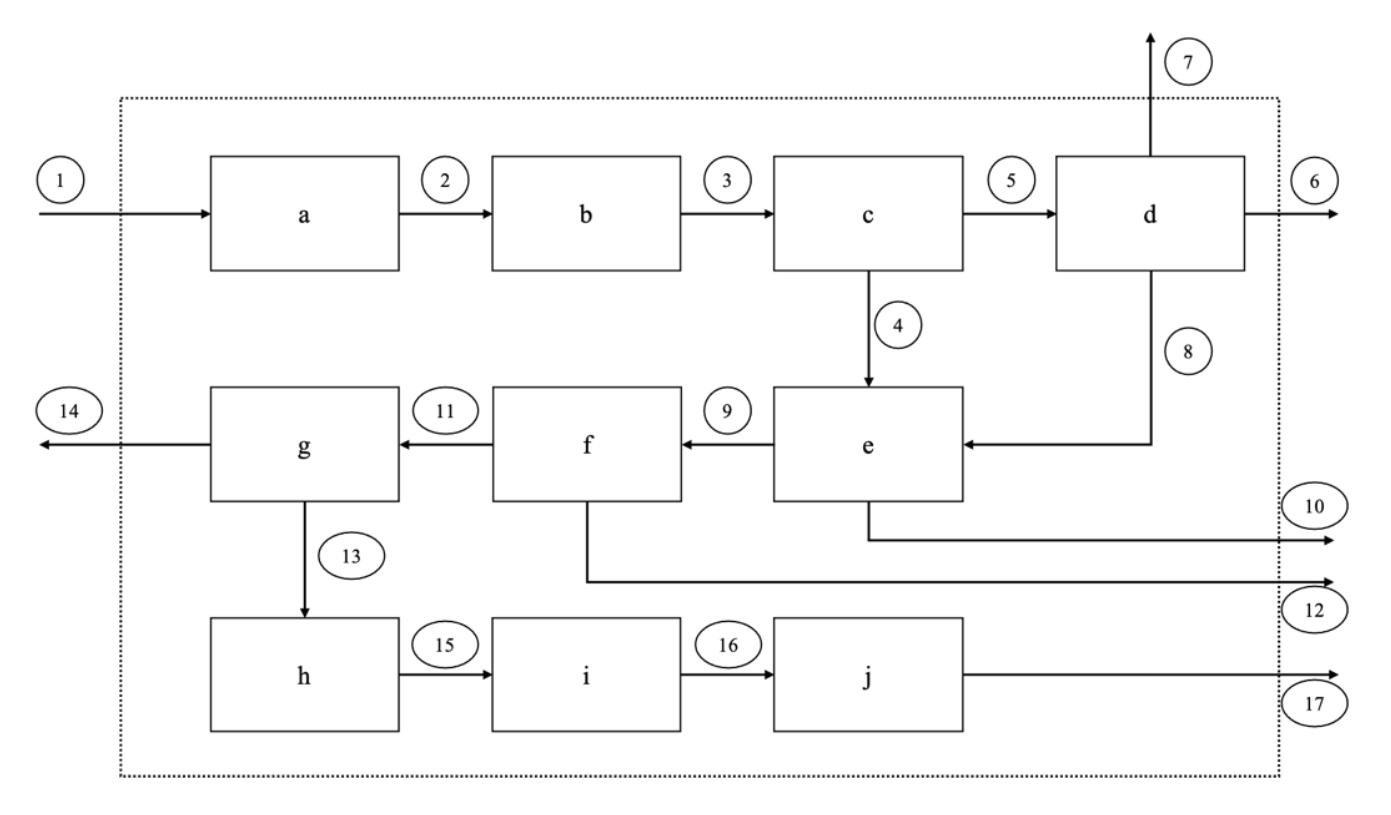
Figure 1. The process flow diagram of seaweed pressing steps in Koperasi Mina Agar Makmur. Unit operations: a) Storage 1 (t = 5 h); b) Weighing 1 (t = 1 - 2 h); c) Sortation (t = 1 h); d) Drying (t = 2 h); e) Storage 2 (t = 5 h); f) Weighing 2 (t = 15 min); g) Pressing and packaging (t = 10 - 20 min); h) Labelling and coding (t = 10 min); i) Storage 3 (t = 3 - 4 d); j) Loading and shipping (t = 5 - 7 h). Material flows: Flow 1 - 5, 8, 9, 11, 13, 15 - 17 represent main seaweed pressing materials; Flow 6, 10, 12, and 14 represent seaweed biomass waste; Flow 7 represents water vapour [8].
With the protein content, seaweed biomass waste can still be potentially used as an alternative protein source as a whole form or as an extract. Seaweeds' protein also has several biological activities, such as antibacterial, antioxidant, immunostimulant, anti-thrombotic, anti-inflammatory, anti-hypertension, and anti-coagulants, which can be applied as pharmaceutical, nutraceutical, and cosmetic
products [1, 9, 22, 23, 25, 26, 29, 31]. Some protein recovery methods have been reported for seaweed biorefinery purposes. Cian et al. [32, 33] recovered protein from Porphyra columbina biomass through sequential steps of size reduction, centrifugation, filtration, and enzymatic hydrolysis (e.g., acid protease and exoprotease). Baghel et al. [34] obtained the protein extract from Gelidiella acerosa and
*Based on dry weight (DW)
Gracilaria dura biomass through aqueous extraction by phosphate buffer, centrifugation, and purification with ammonium sulfate. Consecutive steps of centrifugation, separation through ion exchange resins, and purification through dialysis also has been reported [26].
The profile of amino acids, which are the building blocks of protein, in the seaweed biomass waste is shown in Table 2. All analyzed amino acids were within the range that has been reported in the literature. The seaweed biomass waste also contained non-essential, particularly essential amino acids, which are important for metabolism [9, 26, 29, 35]. As can be seen in Table 2, L-leucine and L-histidine was the highest and lowest essential amino acid (8.21 ± 0.02 and 1.10 ± 0.01 mg/g, respectively). In comparison, L-glycine and Ltyrosine was the highest and lowest non-essential amino acid (8.98 ± 0.03 and 3.53 ± 0.00 mg/g, respectively) in the seaweed biomass waste. Different types of amino acids have unique prospective functionality. For instance, L-leucine is an essential amino acid to regulates important metabolic networks for growth, immunity, maintenance, and reproduction [36]. L-lysine is an essential amino acid for monogastric livestock's feed which is rarely found in terrestrial plants [9, 30]. L-glycine is a non-essential amino acid that has a role in sleep and memory [26]. L-glutamic acid is a non-essential amino acid with an umami taste characteristic that can be used as an additive in foods [2, 23, 25, 26, 37]. L-glutamic acid can also be used as a feedstock to produce high-value chemicals, such as N-methyl pyrrolidone, N-vinylpyrrolidone, and acrylonitrile [38]. Due to protein content and variability of amino acids, seaweed biomass waste is prospective to be used as a source for protein/amino acids biorefinery. However, biorefinery strategies that maintain protein/amino acids' structure and functionality must be considered. Moreover, amino acids production requires extra steps and thus extra cost [2, 26].
3.2.2. Lipids and Fatty Acids
The seaweed biomass waste sample in this study had 1.65 ± 0.42% DW of lipid content. The lipid value was within the range reported in the literature, 0.30 - 7.10% DW (Table 1). Generally, seaweeds have low lipid content [1, 2, 9, 22, 23, 25, 30, 37]. Due to the low lipid content, seaweeds can be used as a low-calorie food source [25]. Seaweeds' lipids are also composed of unsaturated and saturated fatty acids, as shown in Table 3 [1, 2, 9, 23, 25].
The high proportion of saturated fatty acids compared to unsaturated fatty acids in the seaweed biomass waste (Table 3) was similar to seaweeds' fatty acids proportion reported elsewhere [25, 30]. The fatty acid analysis results showed that palmitic acid (C16:0, 49.20 ± 0.35% of total fatty acids) and stearic acid (C18:0, 9.13 ± 0.12% of total fatty acids) dominated the saturated fatty acids proportion in Gracilaria sp., which agreed with the literature [9, 23]. However, in contrast to the reported literature, unsaturated omega-3 fatty
acids, such as docosahexaenoic acid (DHA) and eicosapentaenoic acid (EPA), were not detected in this biomass. The difference in fatty acids proportion in this study and from the literature could occur due to environmental factors, processing conditions, or the content value below the minimum detection level of the method. Environmental factors include geographical location, climate, light intensity, salinity, temperature, nutrition availability, seaweed age, and harvesting time. Processing conditions, including temperature, humidity, and storage, could degrade fatty acid content [22, 23, 25, 30]. In this study, the seaweed biomass waste is generated after around 15 hours of the process (from storage 1 to weighing 2 steps), mostly performed at room temperature. The duration and temperature of the previous steps might degrade some of the fatty acid content, including DHA and EPA, in the sample. Nevertheless, the seaweed biomass waste could be used as feedstocks in food, feed, cosmetics, biotechnology, and pharmaceutical sectors due to its fatty acids content [25]. Fatty acids can also be used as raw materials to manufacture biomaterials, industrial chemicals, and biofuel [38]. The lipid content could be recovered by a combination step of chloroform-methanol extraction, centrifugation, decantation, filtration, and evaporation as reported by [34] from G. dura biomass. Billakanti et al. [39] recovered lipids containing PUFAs from Undaria pinnatifida biomass with a combination step of enzyme pre-treatment, centrifugation, dimethyl ether and ethanol co-extraction, and evaporation. Further development of lipids recovery for biorefinery purposes must maintain the stability of the lipids/fatty acids in various conditions [9].
3.2.3. Carbohydrates
The seaweed biomass waste had a carbohydrate content of 63.20 ± 0.50% DW, which is within the value range of red seaweed carbohydrate in the literature, 3.80 - 78.70% DW (Table 1). Like protein, the carbohydrate composition in seaweed is broad due to species, environmental, and processing variations [30]. Various studies have indicated high carbohydrate content in seaweeds, with cellulose as one of the major carbohydrate classes in red seaweed.
Cellulose is the main constituent of the seaweed cell wall comprised of glucose unit chains. Besides being used as a dietary fiber source, cellulose can be used as a substrate to produce biofuel (e.g., by alcohol fermentation or anaerobic digestion) [26, 38, 40, 41]. Furthermore, cellulose can also be further processed into cellulose microfibrils, which is valuable in the health sector [26]. Cellulose residues and their derivatives could also be used as feedstocks for building, textile, pulp and paper, pharmaceutical, and food sectors [26, 29]. Several cellulose derivatives used in industrial applications are levulinic acid, 2,5 furandicarboxylic acid (FDCA), and lactic acid, with a potential market value of 3-5 times higher than to bioethanol
[26]. Unlike terrestrial plants, seaweeds have low or even no lignin composition, making seaweed biomass processing less complicated by bypassing the delignification step [38].
3.2.4. Ash, Heavy Metals, and Moisture Content
The ash content in the seaweed biomass waste was 21.51 ± 0.06% DW, which is inside the range of seaweed ash values from the literature, 7.36 - 40.30% DW (Table 1). The ash content in seaweeds is higher than in terrestrial plants, generally 5 - 10% DW [2, 23]. Ash content represents minerals and traces elements in the seaweed biomass waste [2, 7, 25, 41]. Seaweeds generally have high mineral composition to withstand the salt-rich nature of seawater. The seaweed cell wall has polysaccharide structures supplemented with functional groups, such as hydroxyl, sulfate, and carboxyl, providing an ion-exchange function. This feature supports seaweeds in absorbing and maintaining minerals from their habitat [2, 7, 23, 25, 29, 30, 41]. Several mineral contents in seaweed biomass are K, Na, Ca, Mg, Fe, Zn, S, Cu, Co, B, and Se. Minerals have a broad scope of functionality, such as controlling hypertension for health purposes and triggering plant growth for agriculture purposes. Due to the mineral content, seaweed biomass waste
could be applied for food supplements, animal feeds, and fertilizer [1, 2, 23, 25, 30, 41]. However, seaweeds could also absorb heavy metals from their environment due to their ionexchange feature. Therefore, it is crucial to assess the heavy metal content before further processing the seaweed biomass waste [25, 26, 30, 41].
In this study, the heavy metals detected in the seaweed biomass waste were cadmium (Cd, 0.05 ± 0.00 mg/kg DW) and lead (Pb, 4.33 ± 0.06 mg/kg DW). Other heavy metals, including mercury (Hg), arsenic (As), and tin (Sn), were not detected (Table 4). The Cd level in the seaweed biomass waste was still under the maximum safety limit, 0.1 mg/kg DW, according to the National Standardization Agency of Indonesia [42]. On the other hand, the Pb level in the seaweed biomass waste exceeded the maximum safety limit, 0.3 mg/kg DW [42]. The heavy metal content could be affected by several factors, such as geographical location, sea wave, temperature, salinity, light intensity, pH, weather, and seaweed age [23, 25, 41]. The safety risk due to heavy metal content in seaweed biomass waste could be reduced by applying desorption media, such as HCl, NaOH, CaCl2, and deionized water to take the heavy metals from the seaweed biomass waste [26].
Table 2. The amino acid composition of Gracilaria sp. biomass waste.
| Parameters | Gracilaria sp. biomass waste* | Literature* [23, 25, 30, 35] | |
|---|---|---|---|
| EAAs | |||
| L-leucine (mg/g) | 8.21 ± 0.02 | 0.38 - 19.44 | |
| L-phenylalanine (mg/g) | 7.49 ± 0.07 | 1.42 - 14.19 | |
| L-threonine (mg/g) | 7.07 ± 0.02 | 1.32 - 20.57 | |
| L-valine (mg/g) | 6.95 ± 0.02 | 0.15 - 15.24 | |
| L-isoleucine (mg/g) | 5.96 ± 0.01 | 1.22 - 10.51 | |
| L-lysine (mg/g) | 3.24 ± 0.01 | 0.22 - 12.08 | |
| L-histidine (mg/g) | 1.10 ± 0.01 | 0.18 - 3.43 | |
| NEAAs | |||
| L-glycine (mg/g) | 8.98 ± 0.03 | 3.20 - 15.50 | |
| L-glutamic acid (mg/g) | 8.87 ± 0.02 | 2.54 - 34.68 | |
| L-aspartic acid (mg/g) | 8.57 ± 0.01 | 5.34 - 36.25 | |
| L-serine (mg/g) | 7.39 ± 0.01 | 2.23 - 12.87 | |
| L-alanine (mg/g) | 7.33 ± 0.02 | 1.46 - 21.11 | |
| L-arginine (mg/g) | 7.13 ± 0.02 | 3.33 - 19.97 | |
| L-proline (mg/g) | 4.32 ± 0.00 | 0.46 - 14.45 | |
| L-tyrosine (mg/g) | 3.53 ± 0.00 | 1.25 - 9.46 | |
Notes:
*Based on dry weight (DW)
EAAs: Essential amino acids; NEAAs: Non-essential amino acids
Table 3. The fatty acids composition of Gracilaria sp. biomass waste.
| Parameters | Gracilaria sp. biomass waste* | Literature* [22, 23, 25, 30] |
|---|---|---|
| SFAs | ||
| Palmitic acid, C16:0 (%) | 49.20 ± 0.35 | 4.28 - 39.80 |
| Stearic acid, C18:0 (%) | 9.13 ± 0.12 | 0.50 - 2.79 |
| Lauric acid, C12:0 (%) | 7.02 ± 0.16 | 0.18 - 0,20 |
| Myristic acid, C14:0 (%) | 3.96 ± 0.06 | 0.50 - 4.91 |
| Butyric acid, C4:0 (%) | N.D. | 0.04 |
| Caproic acid, C6:0 (%) | N.D. | - |
| Caprylic acid, C8:0 (%) | N.D. | 0.11 |
| Capric acid, C10:0 (%) | N.D. | 0.04 |
| Undecanoic acid, C11:0 (%) | N.D. | 0.01 |
| Tridecanoic acid, C13:0 (%) | N.D. | 0.05 |
| Pentadekanoic acid, C15:0 (%) | N.D. | 0.09 - 0.85 |
| Heptadecanoic acid, C17:0 (%) | N.D. | 0.02 - 0.57 |
| Arachidic acid, C20:0 (%) | N.D. | 0.31 |
| Heneicosanoic acid, C21:0 (%) | N.D. | - |
| Behenic acid, C22:0 (%) | N.D. | 0.23 - 2.40 |
| Trichosanoic acid, C23:0 (%) | N.D. | 0.07 |
| Lignoseric acid, C24:0 (%) | N.D. | 0.26 - 0.30 |
| MUFAs | ||
| cis-oleic acid, C18:1𝜔9c (%) | 24.47 ± 0.07 | 0.18 - 8.61 |
| Miristoleic acid, C14:1 (%) | N.D. | 0.43 |
| Pentadecenoic acid, C15:1 (%) | N.D. | 0.03 - 0.07 |
| Palmitoleic acid, C16:1 (%) | N.D. | 0.28 - 5.76 |
| Heptadecenoic acid, C17:1 (%) | N.D. | 0.43 |
| trans-oleic acid, C18:1𝜔9t (%) | N.D. | 2.87 - 3.89 |
| Eicocyanic acid, C20:1 (%) | N.D. | 0.28 - 0.30 |
| Erucic acid, C22:1 (%) | N.D. | 0.33 |
| Nervonic acid, C24:1𝜔9 (%) | N.D. | 0.18 |
| PUFAs | ||
| cis-linoleic acid, C18:2𝜔6c (%) | 5.97 ± 0.09 | 0.59 - 3.20 |
| trans-linoleic acid, C18:2𝜔6t (%) | N.D. | - |
| cis-linolenic acid, C18:3𝜔3c (%) | N.D. | 0.14 - 10.90 |
| Eicosadienoic acid, C20:2 (%) | N.D. | 0.25 |
| Eicosatrienoic acid C20:3𝜔3 (%) | N.D. | 1.81 - 2.15 |
| AA, C20:4𝜔6 (%) | N.D. | 0.26 - 33.85 |
| EPA, C20:5𝜔3 (%) | N.D. | 1.40 - 1.79 |
| Docosadienoic acid, C22:2 (%) | N.D. | - |
| DHA, C22:6𝜔3 (%) | N.D. | 0.20 - 48.36 |
| Omega-3 fatty acids (%) | N.D. | - |
| Omega-6 fatty acids (%) | 5.97 ± 0.09 | - |
| Omega-9 fatty acids (%) | 24.47 ± 0.07 | - |
| Saturated fatty acids (%) | 69.56 ± 0.02 | 7.53 - 46.90 |
| Unsaturated fatty acids (%) | 30.44 ± 0.02 | - |
| Monounsaturated fatty acids (%) | 24.47 ± 0.07 | 19.11 - 38.30 |
| Polyunsaturated fatty acids (%) | 5.97 ± 0.09 | 25.10 - 51.20 |
Notes:
N.D.: not detected; SFA: saturated fatty acid; MUFA: Monounsaturated fatty acid; PUFA: polyunsaturated fatty acid; AA: arachidonic acid; EPA: eicosapentaenoic acid; DHA: docosahexaenoic acid
*Based on total fatty acids
Table 4. The vitamin, pigments, and heavy metals composition of Gracilaria sp. biomass waste.
| Literature* | Standard* | ||
|---|---|---|---|
| Parameters | Gracilaria sp. biomass waste* | [23, 25, 30, 35, 43] | [42] |
| Vitamin & pigments | |||
| Vitamin C (mg/100 g) | N.D. | 2.51 - 1466.00 | - |
| β-carotene (mg/g) | N.D. | 0.01 - 18.02 | - |
| Chlorophyll (mg/g) | N.D. | 0.01 - 5.74 | - |
| Heavy metals | |||
| Pb (mg/kg) | 4.33 ± 0.06 | 956 | < 0.3 |
| Cd (mg/kg) | 0.05 ± 0.00 | 0.3 - 257 | < 0.1 |
| Hg (mg/kg) | N.D. | < 10 | < 0.5 |
| As (mg/kg) | N.D. | 5.8 | < 1.0 |
| Sn (mg/kg) | N.D. | - | < 40.0 |
Notes:
The moisture content in the seaweed biomass waste was 22.00 ± 0.25% FW, higher than the seaweed moisture content reported in the literature, 4.53 - 11.91% FW (Table 1). Although the seaweed biomass has been dried before the pressing steps, high humidity due to the rainy season and long process duration (around 15 hours) might add more moisture content to the observed sample [8]. High moisture content in the seaweed biomass waste must be avoided since it could accelerate the degradation of bioactive compounds. Additionally, it could also add energy input and cost required to dry the sample before further processing steps [38].
3.2.5.Vitamins and Pigments
Red seaweed, such as Gracilaria sp., is known for its various vitamins (vitamin A, B, C, D, E), pigments (chlorophylls, carotenoids, phycobiliproteins), and secondary metabolites that have health-related activities, such as antioxidant and antimicrobial [1, 2, 9, 22, 23, 25, 31, 40, 41]. However, in this study, our samples did not detect the presence of vitamin C, β-carotene, and chlorophyll (Table 4). The vitamin C, (-carotene, and chlorophyll content range in seaweed biomass found in other studies is 2.51 - 1,466.00 mg/100 g, 0.01 - 18.02 mg/g, and 0.01 - 5.74 mg/g, respectively (Table 4). Undetected vitamin and pigment components could occur due to the values below the minimum detection value of the method. The observed seaweed biomass waste was withered and pale-colored, indicating low or no vitamin and pigment content in the sample. The vitamin and pigments composition could be affected by various factors, such as salinity, temperature, weather, processing, and storage conditions [25]. Other analysis methods, such as the ferric reducing ability of plasma (FRAP), 2,2'-azino-bis(3-ethylbenzothiazoline-6 sulfonic acid) (ABTS), and 2,2-diphenyl-1-picrylhydrazyl (DPPH) assays, could be applied in further studies to assess the presence and activity of the vitamins, pigments, and other secondary metabolites [22].
Assessing seaweed biomass waste composition is the initial step of products development based on the biorefinery approach, which will support identifying the products and processing steps that will be applied [38]. However, the seaweed biomass waste composition is unstable due to species, environmental, and processing factors, as previously discussed. Therefore, biorefinery-based methods that are flexible on these variations should be addressed in future development [30].
3.3. Productivity and Economic Potential Evaluation
Based on the annual productivity information (52 metric tons/year) and composition assessment of the seaweed biomass waste in this study (Table 1-4), the productivity and economic potential of the products from the seaweed biomass waste are presented in Table 5. For the record, this evaluation has only applied gross revenue calculation. The process efficiency factors and process/equipment-related costs have not been included, and the more specific technoeconomic analysis will be addressed in the subsequent studies. As shown in Table 5, the price per unit of products was mostly obtained from an online website [44], using the average price of industrial-grade products. The price for the unassessed amino acids came from the average price of overall amino acids. The other lipids productivity came from subtracting total lipids content (Table 1) with the detected fatty acids (Table 3). Possibly, the other lipids were glycerols and lipid-like metabolites, such as sterols, terpenoids, and tocopherols, which are not broken down into fatty acids [2]. The price for the other lipids came from the price of glycerols. Additionally, the price per unit of carbohydrate and mineral (represented by fertilizer price) was obtained from [28, 45]. Hence, 52 metric tons/year of seaweed biomass waste could potentially generate 5,534.93 kg/year of amino acids (USD 132,095.28), 51.71 kg/year of fatty acids (USD 1,540.99), 616.49 kg/year of other lipids (USD
*Based on dry weight (DW)
616.49), 25,632.70 kg/year of carbohydrates (USD 56,391.94), and 8,724.30 of minerals (USD 32,279.91). Water (11,439.87 kg/year) and heavy metals (0.18 kg/year) were not economically evaluated. Thus, the potential annual gross revenue of products generated from seaweed biomass waste was USD 222,924.60. It means that the economic value of a kilogram of seaweed biomass waste could potentially be increased from USD 0.00 to USD 4.29 through the biorefinery approach.
The application of the biorefinery approach on the seaweed biomass waste could be made by implementing the cascading processes. Cascading processes focus on generating products with higher economic value first based on the seaweed biomass waste composition, followed by lower economic value products. With this approach, the seaweed biomass
waste valorization would be more efficient and generate economic value enhancement of the products [1, 2, 46]. From higher to lower economic, the product leveling are pharmaceuticals/fine chemicals, nutraceuticals, cosmetics, foods, feeds, fertilizers/biostimulants, and energy [2, 26, 46]. According to that classification, the biorefinery of seaweed biomass waste could start from amino acids/proteins (for pharmaceutical, nutraceutical, cosmetic, food sectors), fatty acids/lipids (for pharmaceutical, nutraceutical, cosmetic sectors), fertilizer (from minerals and biomass residue, for agriculture sector), and bioethanol (from carbohydrate, for the energy sector). By incorporating the processing strategies from [26, 29, 32-34, 39], the proposed design of the hypothetical biorefinery process of the seaweed biomass waste is shown in Figure 2.
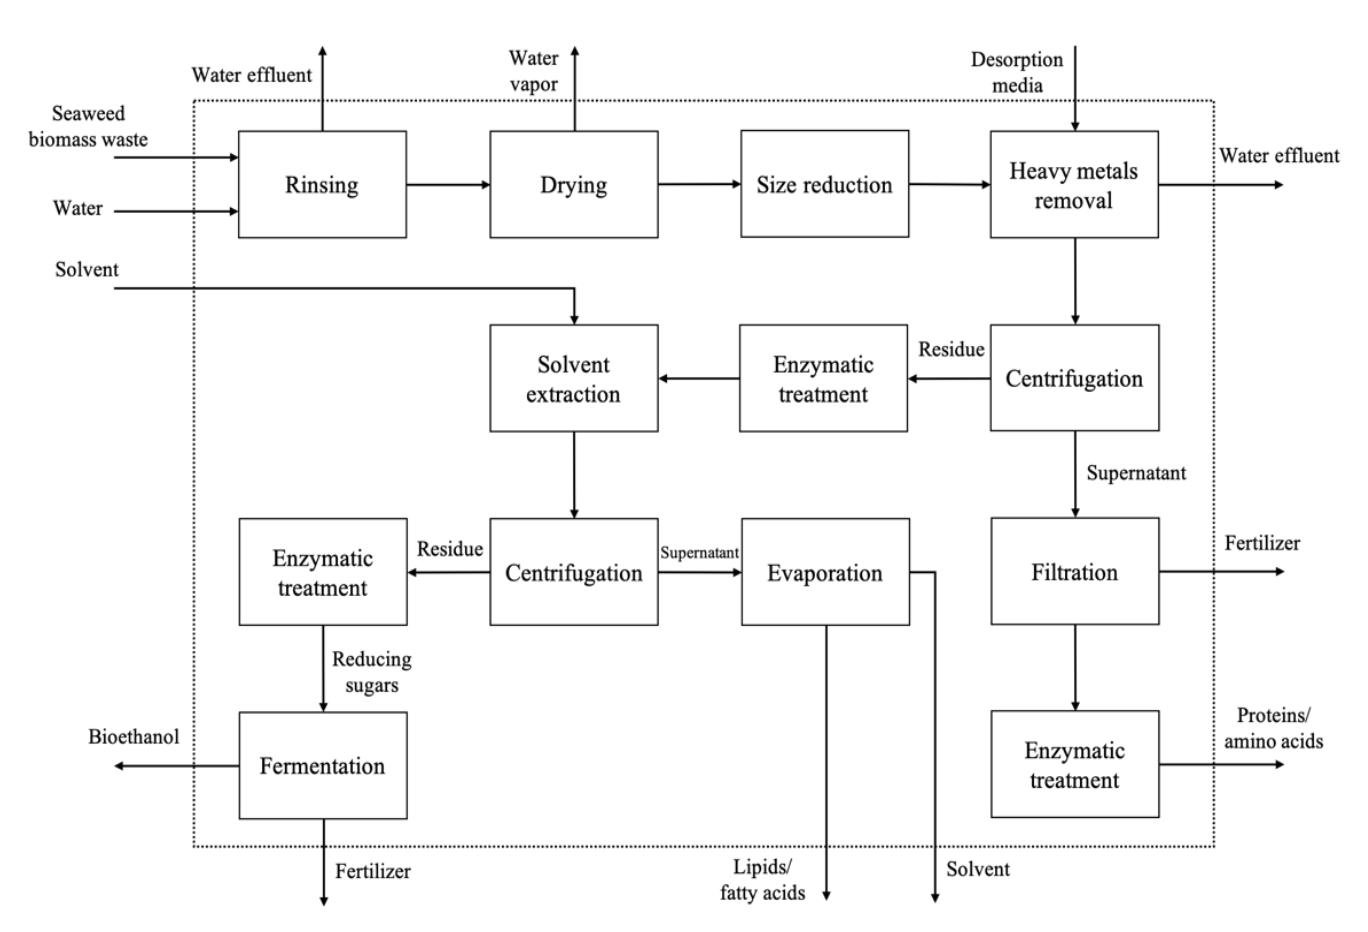
Figure 2. The preliminary hypothetical biorefinery process scheme of seaweed biomass waste.
Table 5. The productivity and economic potential of products from seaweed biomass waste.
| Products | Annual productivity potential (kg.year-1) | Price per kilogram (USD.kg-1) [44-46] | Annual gross revenue (USD) |
|---|---|---|---|
| Amino Acid Total | 5,534.93 | 132,095.28 | |
| L-histidine | 57.13 | 50.00 | 2,856.50 |
| L-isoleucine | 309.95 | 40.00 | 12,398.00 |
| L-leucine | 427.02 | 20.00 | 8,540.40 |
| L-lysine | 168.63 | 20.00 | 3,372.60 |
| L-phenylalanine | 389.28 | 15.00 | 5,839.20 |
| L-threonine | 367.76 | 20.00 | 7,355.20 |
| L-valine | 361.28 | 30.00 | 10,838.40 |
| L-alanine | 381.31 | 30.00 | 11,439.30 |
| L-arginine | 370.90 | 10.00 | 3,709.00 |
| L-aspartic acid | 445.83 | 40.00 | 17,833.20 |
| L-glutamic acid | 461.12 | 20.00 | 9,222.40 |
| L-glycine | 467.21 | 10.00 | 4,672.10 |
| L-proline | 224.89 | 25.00 | 5,622.25 |
| L-serine | 384.19 | 20.00 | 7,683.80 |
| L-tyrosine | 183.47 | 40.00 | 7,338.80 |
| Unassessed amino acids | 534.95 | 25.00 | 13,373.75 |
| Fatty Acid Total | 51.71 | 1,540.99 | |
| Lauric acid | 3.64 | 20.00 | 72.80 |
| Myristic acid | 2.05 | 50.00 | 102.50 |
| Palmitic acid | 25.51 | 50.00 | 1,275.50 |
| Stearic acid | 4.73 | 5.00 | 23.65 |
| cis-oleic acid | 12.69 | 5.00 | 63.45 |
| cis-linoleic acid | 3.09 | 1.00 | 3.09 |
| Other Content | 34,973.48 | 89,288.33 | |
| Other lipids | 616.49 | 1.00 | 616.49 |
| Carbohydrates | 25,632.70 | 2.20 | 56,391.94 |
| Minerals (ash) | 8,724.30 | 3.70 | 32,279.91 |
| Water | 11,439.87 | 0 | 0 |
| Total | 52,000.00 | 222,924.60 | |
| Economic Value of a l | 4.29 | ||
| J | _ v |
The implementation of biorefinery on seaweed biomass waste would be preferable if it also applies mild conditions, fewer energy inputs, and low or zero pollutants generation. Water and solvent recycling, enzyme application (especially immobilized enzyme), and green extraction methods are some operational options that could be implemented to achieve those purposes [9, 29, 34, 47, 48]. Moreover, the seaweed biomass waste biorefinery should be proceeded by laboratory works and pilot-scale test, complemented by techno-economic analysis (TEA), and life-cycle assessment (LCA) before realization on an industrial scale, to ensure that the biorefinery process generates economic profits and no harmful environmental impacts [3, 45, 49].
4. Conclusion
This case study has shown that seaweed Gracilaria sp. biomass waste from the representative seaweed production unit in Karawang, Indonesia (generated at approximately 52 metric tons/year) still contains bioactive components with potential gross revenue of ± USD 222,924.6/year or an economic value of USD 4.29/kg of seaweed biomass waste. The biorefinery approach could be applied to generate highvalue products sustainably. Hopefully, this study could be a reference for accelerating the development of local seaweed biomass-based bioindustry with high economic competitiveness and environmentally friendly.
Acknowledgments
The authors would like to thank Mr. Usup Supriatna, the head of Koperasi Mina Agar Makmur, who has provided information on the dried seaweed pressing process at his cooperative and allowed the authors to analyze the seaweed biomass waste generated from his production unit. This study received no specific grant from any funding agency in the public, commercial, or not-for-profit sectors. The authors declare that there is no conflict of interest.