
1. Introduction
During the year 2015, the Indonesian marine ecosystems had a high quantity of commercial fish, including anchovy and mackerel species (scientifically known respectively as Stolephorus sp. and Rastrelliger sp.). Stolephorus sp. are little commercial fish with a strong market demand. Additionally, anchovies serve as a food source for other fish species that consume them as prey. Stolephorus sp. is a tiny pelagic fish that contributes significantly to fisheries productivity in Indonesian waters. It is typically caught with a lift net and has an economic worth of USD 5.77-6.92 per kilogram [1, 2]. In 2015, production totaled 6,474.5 tons, accounting for 28% of total small pelagic fish production [3]. Actual real production may be larger than the estimate because fishermen rarelyland their anchovies at fish landing sites or sell the fish directly to anchovy collectors at sea, therefore production is not fully documented at the fishing port. In addition to being marketed fresh, Stolephorus sp. is salted [4] to extend storage time. The fish body is the most commonly consumed portion, while the fish head is an underutilized by-product. It is estimated that 15% [5] of anchovy resources are by products of anchovy meats and discarded parts [6]. Besides Stolephorus sp., Rastrelliger sp. [7] species is also known as the most common commercial fish in Indonesia. The potential mackerel resources in the Java Sea reaches 450.400 tons/year and make this species as the mostly caught with purse seine in the waters of western Indonesia.
Microplastics sized 1 mm-5 mm are some of the most persistent and ubiquitous contaminants in oceanic waters and on beaches. According to recent reports on marine biota, microplastics have contaminated various forms of marine life. Microplastics are derived from textiles, personal care products, industrials, and household garbage, which are carried by rivers, winds, floods, and storms, and eventually end up in marine environments. Another source of microplastics in the water is natural phenomena such as floods [8], heavy rainfall, tsunamis, and cyclones [9]. Degradation of microplastics in the oceanic environment began with water temperature, ultraviolet light, currents, and the activities of decompositions by marine microorganisms. Microplastics floating on the surface of oceanic water may enter the food chain if consumed by zooplankton or small pelagic fishes like anchovies which exhibit subsurface foraging behavior [10]. Recently, Indonesia has become one of the risked countries by produce 0.48-1.29 million metric tons per year (MMT/year) plastic marine debris on the last 2010 [11].
Fish-microplastic data is important for studies on fish ecology. Meanwhile, processing data, information, and knowledge entails estimating parameters in mathematical space. Since data from fisheries [12], chemical, and atmospheric studies are indirect observations using secondary data, extrapolating their findings to a biological measurement scale distinguishes adequate from overly ambitious and deficient models. Uncertainty in data, ambiguity in information, missing data points, and unclear goals all contribute to the complexity. As a result, a paradigm change from traditional model-driven methodologies to artificial intelligence (AI) tools is required. Artificial Neural Networks (ANN) approaches are used in one AI approach. Data processing with ANNs (Neural Networks) is done either directly on a chip or through software. ANN implementations in software are widely used and have been successful in forecasting the stock market, forex, sunspots, diabetes onset, separating renal cell cancer from cyst, identifying acute myocardial infarction, and classifying iris data. As a result, ANN has been frequently used in fishery research. Kang et al. [13] employed ANN to examine numerous hydrological and environmental variables, and their correlation, to improve fishery estimation for the ecological health evaluation of streams and water resource management in South Korea.
Jakarta Bay is considered to be the largest contributor of plastic to the marine environments in Indonesia and thus it has raised the level of concern. Cordova and Nurhati [14] confirmed plastics as the most common debris entering Jakarta Bay representing 59% (abundance) or 37% (weight) of the total collected debris. Dwiyitno et al. [15] reported that plastic debris in Jakarta Bay ranged from 7,400 to 10,300 particles/km2 . Those plastic debris can potentially contribute to the microplastic contents in Jakarta Bay. Several studies have reported the occurrence of microplastics in surface water or sediment in Jakarta Bay. Manalu et al. [16] have reported the abundance of microplastic in sediment of Jakarta Bay ranging from 18,405 to 38,790 particles/kg dry sediment. Microplastic loads in Jakarta Bay were followed by microplastic contents in marine creatures, including commercial fish species. According to Susanti et al. [17], Lutjanus vitta populating Jakarta Bay has contained film microplastics of 2-21 particles/fish and fiber of 1-10 particles/fish. Meanwhile Efadeswarni et al. [18] confirmed that more than half of the fish species studied in Jakarta Bay contained microplastic in the following order: fiber > film > fragment, with the greatest concentrations equaling 137 particles/fish and the lowest being 8 particles/fish.
Despite growing reports on microplastic contents in fish, limited research has informed the model that can depict the determinant factors and proxies of microplastic contents in fish. Taking into consideration, this study used an ANN as a novelty and tool to model the determinants of microplastic contents in fish utilizing fish weight and length as determinant variables affecting microplastic contents. Microplastic content in fish can be discovered and calculated immediately by using the correct modeling tools. The modeled fish in this case is mackerel Rastrelliger sp. and anchovy Stolephorussp., which are commercial species commonly available and consumed in Indonesia.
2. Methodology
2.1. Study Area
The fish sampling site location was in the water of Jakarta Bay, Indonesia. It is a shallow bay with an average depth of 15 m, its shoreline is about 149 km long and covers an area of an approximately 595 km2 . The bay is located north of Jakarta, the capital of Indonesia. Thirteen rivers around Jakarta Bay are known to discharge a large amount of anthropo- genic material from land-based sources into the bay, including industrial effluent, sewage, and agricultural discharges.
2.2. Fish Survey and Collection
Sampling was performed in November 2022 in Jakarta Bay. Fish were collected from water using fishing nets. The fish species was identified using identification book to determine the fish species and confirmed as Rastrelliger sp. and Stolephorus sp. [19, 20]. The collected fish samples then stored in cooler box and transported into the laboratory for further microplastic analysis.
2.3. Fish Preparation
Sampled fish in laboratory was measured firstfor its weight and length with units of gr and mm. Then to avoid contamination, sampled fish was soaked in filtered Milli-Q water and rinsed in flow water [21]. The analyzed parts of the sampled fish were the stomach since the microplastic was accumulated inside fish body in this part. The stomach was isolated as a whole up to 0.5 g in total and placed in an Erlenmeyer jar with 5 ml 0.5% dissolved sodium sulfate and 10 ml NaOH at fume hood, then kept in it on the room temperature for 24 hours. After 24 hours, the jar was gently shaken and let to in- cubate for another 24 hours until all contents dissolved. After the incubation fully dissolved, 1 ml of sample was placed into Sedgwick rafter (triplet) and observed with magnification 10x on the microscope. Types of microplastic shapes including fiber, film, fragment, and pellets were calculated and denoted as particles/fish [22].
2.4. Microplastic Quality Assurance
To prevent the contamination of samples from other possible microplastic sources that were not related to the study, including microplastic from air and clothing, a microplastic quality assurance procedure was implemented. During the sample preparation, the sampled fish were tightly packed in a Petri dish. High-density polyethylene (HDPE) materials were avoided during this process, and only glassware was used during sample preparation. Procedural blanks were implemented as controls for laboratory contamination. The blank procedure was carried out exactly as the field samples were, but without the fish samples [23].
2.5. ANN Analysis
ANNs are mathematical models inspired by the human brain. They are able to recognize behavioral patterns and learn from their interactions with the environment. Back Propagation (BP) and multiple layer perceptrons (MLPs) neural network were constructed and computed using R version 3. The ANN model consists of three feed-forward layers: input, hidden and output [24]. The input layer was composed of weight and length of fish variables. The number of nodes in the hidden layer was determined by testing the performance of the models using arrange of node numbers. The dependent variable that is the microplastic types including fiber, fragment, film, and pellet represented the output layer. A neuron is the basic processing unit of an ANN and performs two functions: collecting the inputs and producing the output. Each input is multiplied by connection weights, and its products and biases are added and then passed through an activation function to produce an output as microplastic contents, as shown in Figure 1 [25].
2.6. Data Analysis
One way ANOVA combined with Tukey's HSD (honestly significant difference) pairwise comparison were used to test the differences in microplastic content among types, with a significance level of P < 0.05.
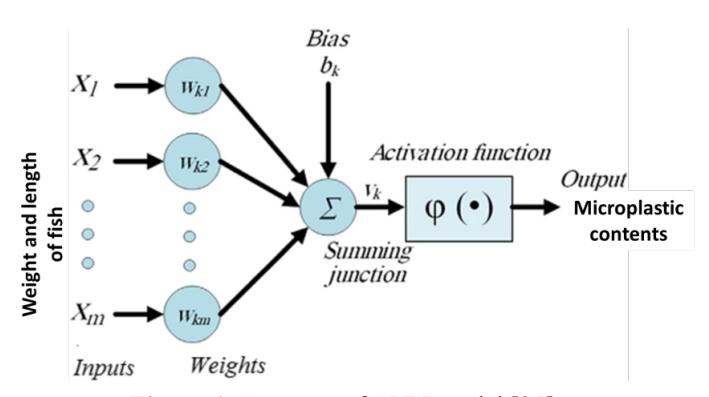
Figure 1. Structure of ANN model [25].
3. Result and Discussion
3.1. Fish's Weight and Length and Microplastic Quantity
The identification confirms that the sampled fishes were Commersonnii's Anchovy Stolephorus commersonnii (Lacepède, 1803) and Indian Mackerel Rastrelliger kanagurta (Cuvier, 1816). There were 15 individuals collected for both species. The average and 95% confidence interval (CI) for weight and length of S. commersonnii were respectively 1.07 gr with 95% CI (0.705, 1.45) and 65.0 mm with 95% CI (58.7, 71.4). The weight and length of the sampled fish were comparable to data reported from previous research either at global, regional or national water within Southeast Asia (Table 1). The S. commersonnii weight and length recorded in this study seems to be smaller in comparison to individuals recorded in Demak water. The smaller sizes can be due to the several reasons. First, Jakarta Bay is a marine ecosystem that has received pollution [26] and reductions of natural habitats that may reduce the presences of larger individuals [27]. Second reason is due to the overfishing of larger individuals that cause only smaller fishes available [28]. As reported globally, overfishing will result in smaller fish and causing fish to get smaller [29, 30]. While in contrast, R. kanagurta (Table 1)recorded in Jakarta Bay was in fact larger than in other location in Indonesia, in this case in Demak waters. The recorded individuals of R. kanagurta have an average length of 163.72 mm with 95% CI (148, 180) and weight of 97.25 gr with 95% CI (77.8, 117). This size classes dominated by adult individuals indicates that this species has not yet experienced overfishing in Jakarta Bay.
| Table 1. Weight and length of Stolephorus sp. and Rastrelliger sp. | ||
|---|---|---|
| Species | Locations | Weight (gr) | Length (mm) | References |
|---|---|---|---|---|
| Terengganu, Malaysia | 1.57 gr | 51.0 – 76.0 mm | [31] | |
| Stolephorus sp. | Demak, Indonesia | 1.97 - 8.8 gr | 34.17 - 76.69 mm | [32] |
| Jakarta Bay, Indonesia | 0.35 - 3.56 gr | 47.43 - 103.08 mm | This study | |
| Demak, Indonesia | 40 - 70 gr | 140 – 180 mm | [7] | |
| Rastrelliger sp. | Suez Bay, Egypt | 29 - 339 gr | \[150-320\ mm\] | [43] |
| Jakarta Bay, Indonesia | 85 - 127 gr | 153.6 – 187.8 mm | This study |
Figure 2 and Figure 3 depict microplastic quantity in the stomach of R. kanagurta and S. commersonnii. It is clear that the order of microplastic from the highest to the lowest was in order of fiber > film > fragment > pellet. This confirms that fiber is the common microplastic accumulated inside the stomach of S. commersonnii with an average of 42.20 particles/fish and the least microplastic was pellet with an amount of 1.81 particles/fish in average. The amount of microplastics were significantly different (Table 2) among types except between fiber and film. This indicates that the stomach of S. commersonnii contains approximately the same amount of fiber and film since those microplastic types had no significant differences (P > 0.05) in quantity. Similar to S. commersonnii, microplastic contents of fragment and pellet in stomach of R. kanagurta are quite similar and show no differences (P >0.05).
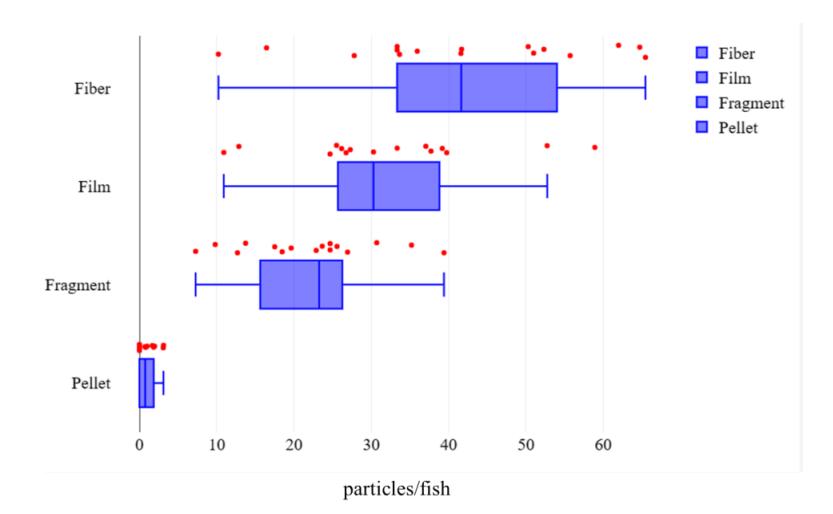
Figure 2. Microplastic quantity (particles/fish) in stomach of S. commersonnii.
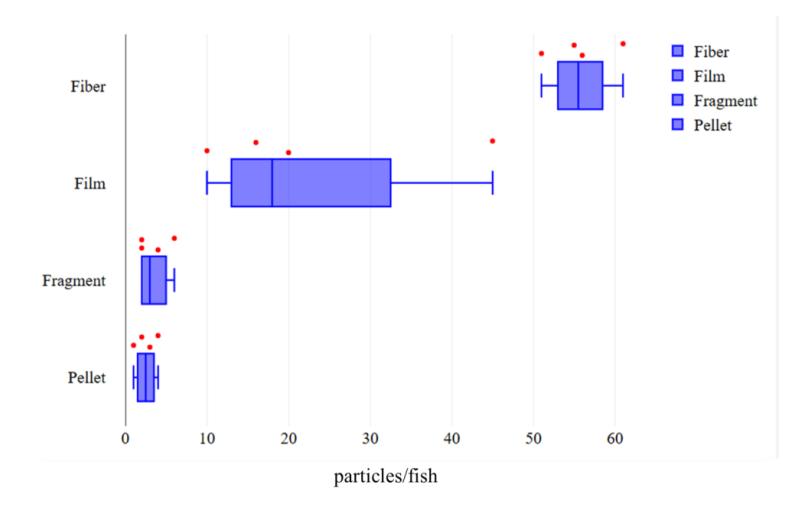
Figure 3. Microplastic quantity (particles/fish) in stomach of R. kanagurta
Table 2. Tukey's HSD comparison of microplastic quantity among microplastic types
| Species | Pairwise comparisons | P values | Significance | |
|---|---|---|---|---|
| Fiber : film | 0.279 | Not significant | ||
| Fiber: fragment | 0.000 | Significant | ||
| g | Fiber : pellet | 0.000 | Significant | |
| S. commersonnii | Film: fragment | 0.026 | Significant | |
| Film: pellet | 0.000 | Significant | ||
| Fragment : pellet | 0.000 | Significant | ||
| Fiber : film | 0.000 | Significant | ||
| Fiber: fragment | 0.000 | Significant | ||
| D. 7 | Fiber : pellet | 0.000 | Significant | |
| R. kanagurta | Film: fragment | 0.002 | Significant | |
| Film : pellet | 0.001 | Significant | ||
| Fragment : pellet | 0.995 | Not significant | ||
In Jakarta Bay, fiber is observed as the most common microplastic found in the stomach of studied commercial fishes which is consistent with findings from other locations [33]. The microplastic content will reflect the surroundinghabitats, anthropogenic activities, and plastic material used. Jakarta Bay is a fishing ground that uses a variety of fishing nets mostly made of plastic fibers. According to Wu et al. [34], several marine activities including fisheries are responsible to the production of microfibers. Ranging from fishing nets and ropes to laundry and municipal waste from nearby fishermen villages may be possible sources of fiber in the marine environment.
3.2. ANN Models of Microplastic in R. kanagurta and S. commersonnii Stomach
ANN models for each microplastic content inside the fish stomach include film, fragment, film, and pellet, as shown in Figure 4 for S. commersonnii and Figure 5 for R. kanagurta. The ANN models consist of one hidden layer and three nodes. The best and fitted models were indicated by the lowest prediction error and root mean square error (RMSE) according to previous study and analysis [33, 34]. The RMSE for S. commersonnii was following order from the highest to the lowest as follows (Table 3): fiber > film > fragment > pellet. The RMSE values then in the order of 50.671, 37.473, 16.080, and 3.199. Similar patterns were observed for R. kanagurta with The RMSE values in the order of 55.863, 26.367, 3.872, and 2.738. Since the lowest RMSE value was observed for fish weight-length and pellet model, then ANN model can be used to estimate pellet contents using fish's weight and length as determinant factors. The second fitted model wasobserved for fragment. Meanwhile, fish's weight and length cannot be used to forecast the fiber and film in both R. kanagurta and S. commersonnii stomach due to its high RMSE values. This is because the lower RMSE values representing the goodness of fit [35]. RMSE benchmark refers to forecast and can therefore negate the disadvantages that may arise when correlating models developed for examines with different values [36].
Table 3. Prediction error and root mean square error (RMSE) of developed ANN models
| ANN Models | |||||
|---|---|---|---|---|---|
| Species | Error types | Weight + length | Weight + length | Weight + length | Weight + length |
| ~ fiber | ~ film | ~ fragment | ~ pellet | ||
| S. commersonnii | Prediction error | 4943.459 | 2667.939 | 462.52 | 14.364 |
| S. Commersonnii | RMSE | 50.671 | 37.473 | 16.080 | 3.199 |
| D kan amuta | Prediction error | 6020.508 | 1301.508 | 18.008 | 7.000 |
| R. kanagurta | RMSE | 55.863 | 26.367 | 3.872 | 2.738 |
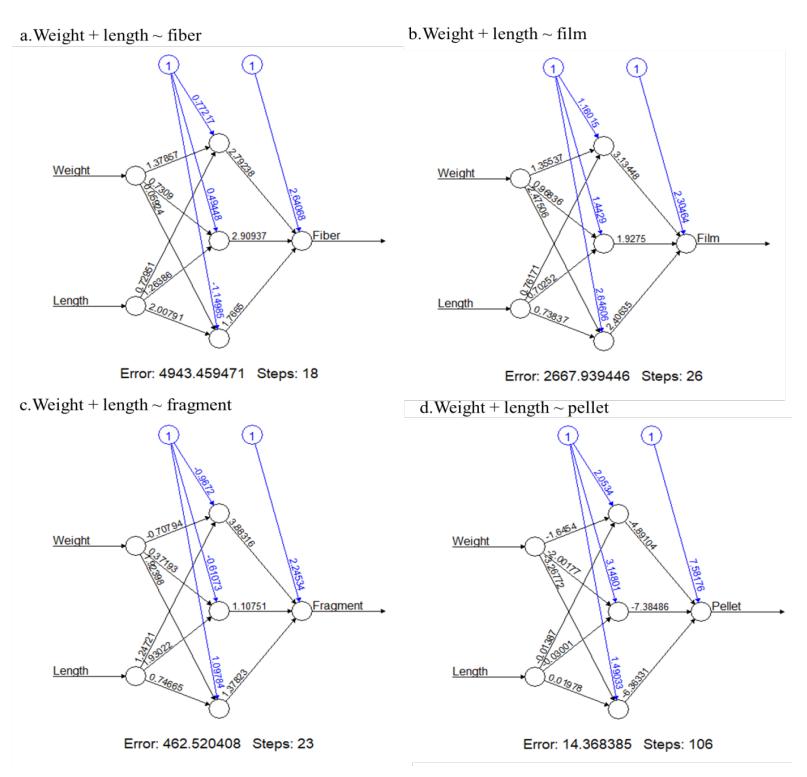
Figure 4. Structures of ANN models for (a) fish's weight + length ~ fiber, (b) fish's weight + length ~ film, (c) fish's weight + length ~ fragment, and (d) fish's weight + length ~ pellet for S. commersonnii.
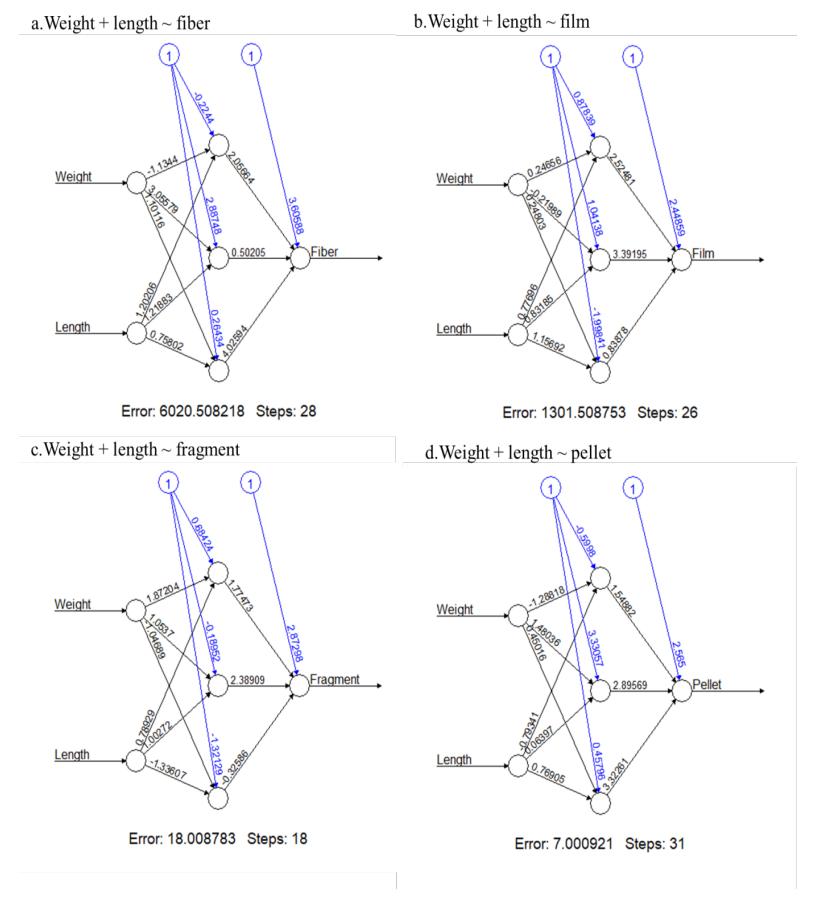
Figure 5. Structures of ANN models for (a) fish's weight + length ~ fiber, (b) fish's weight + length ~ film, (c) fish's weight + length ~ fragment, and (d) fish's weight + length ~ pellet for R. kanagurta.
e-ISSN: 2655-8777 http://journals.itb.ac.id/index.php/3bio
Despite the increasing number of studies on the use of ANN to model various environmental phenomena [37], including fishery studies [38], the uptake of microplastic by fish generally exhibit nonlinear behaviors due to the significant fish physiological and environmental variability. The nonlinear models, in this caseANN, provide more accurate estimates than linear models in the estimation analysis. ANN is considered well suited to modelling ecological data [39]. While the accuracy of ANN model was determined by the numbers of hidden layer [40]. In this study, only singular hidden layer was used. Further studies should be carried out to develop ANN models with multiple hidden layers. Despite its limitations, ANN was considered a well-suited method to be applied in the fishery model study [41, 42].
4. Conclusion
Among the commercial fish species studied, S. commersonnii sizes in Jakarta Bay were dominated by small individuals, possibly due to a lack of adult individuals, while R. kanagurta in Jakarta Bay were predominantly adult individuals. Fibers were known asthe most common microplastic observed in the stomachs of both commercial species. For S. commersonnii, fiber and film were recorded at the same quantity. In the case of R. kanagurta, the amount of fragment and pellet were found in equal amounts. The length and weight of the fish were associated with the microplastic contents. Based on the ANN model and RMSE values, significant associations were recorded for pellets. In conclusion, the weight and length of fish can be used to predict the pellet content accurately, in both R. kanagurta and S. commersonnii in Jakarta Bay. Since R. kanagurta has the lowest RMSE values, the weight and length within ANN model are more suitable to be applied to R. kanagurta.
Acknowledgement
We are deeply indebted to the many stakeholders including students and fishermen community of the sampled locations that have contributed to the survey and collection of data.