
1. Introduction
Indonesia is the fourth largest coffee exporting country in the world [1] however, the coffee produced is of low quality when compared to the other 3 largest exporting countries, namely Colombia, Vietnam and Brazil [2]. This is caused by poor post-harvest applications [3].
One of the coffees with poor post-harvest implementation is ateng coffee. Ateng coffee is a type of Arabica coffee originating from Kec. Sumbul, Kab. Dairy, Prov. North Sumatra. Farmers in the area carry out wet fermentation of ateng coffee traditionally without controlling the temperature, causing the fermentation to not go well because the growth of fermenting microorganisms is highly dependent on temperature [4–6]. This traditional fermentation occurs for all-night (±12 hours), then the farmers dried using sunlight for 2 – 4 hours at a temperature of ± 27o C (depending on the weather), then the farmers sell the coffee to coffee agents at a low price. With a drying time of 2-4 hours, the water content of green coffee beans is still too high. High water content can facilitate the growth of fungi and can produce mycotoxins which are harmful to human health [7], for this reason coffee should be dried for7-14 days to reach a standard water content range between 8.0% and 12.5% [8–10]. Subsequent coffee processing is carried out by coffee agents, but the initial processing by farmers will certainly affect the quality of the subsequent coffee.
One of the most important stages in improving coffee quality is coffee fermentation [11, 12]. Coffee fermentation occurs naturally, microorganisms are present by utilizing various compounds in the pulp and mucilage as nutrients [12]. These microorganisms can produce metabolites that affect the taste of coffee drinks [13], yeast and bacteria play an important role in producing coffee flavor precursors in the form of esters, organic acids, ethanol, amino acids, volatile compounds [11, 14–17].
Many studies have been conducted on coffee fermentation with the addition of yeast and bacteria inoculums [18– 22]. Pereira et al., (2016) in his research fermenting Arabica coffee with Lactobacillus plantarum LPBR01, the results showed that the inoculum was able to increase the formation of aroma compounds so that the quality of the coffee was increased compared to conventional methods [16]. C. Wang et al., (2020) stated that coffee fermentation with the addition of yeast inoculum can increase the content of ester compounds in coffee beans which act as flavor precursors [15].
In this study, efforts to improve the quality of atengcoffee were optimizing the wet fermentation of ateng coffee by adding inoculums, specifically yeast R1-TKSU and Lactic Acid Bacteria (LAB) Leuconostoc suionicum. These two isolates, derived from earlier studies, demonstrated specific enzymatic capabilities: yeast R1-TKSU was able to produce pectinase, and LAB (Leuconostoc suionicum) was able to produce amylase, cellulase and protease [23, 24]. The enzymatic activities of these microorganisms are crucial because they break down polysaccharides (pectin), cellulose, and starch in coffee mucilage [12], which are a source of nutrition for microorganisms [13].Thisfermentation is expected to be more optimal, so that the microorganisms produce metabolites/flavor precursors such as organic acids, amino acids, volatile compounds which can diffuse into the green coffee beans thereby affecting the taste of coffee [13, 16, 17]. Yeast R1-TKSU has been used in the fermentation of Arabica coffee originating from West Java. The fermentation results show that the addition of yeast R1-TKSU can improve the taste of coffee [23]. Meanwhile, the LAB (Leuconostoc suionicum) has been used in the fermentation of robusta coffee originating from West Java. The fermentation results show that the addition of LAB (Leuconostoc suionicum) is able to eliminate the unpleasant taste of coffee [24]. This study aims to improve the quality of ateng coffee from Sumbul, Dairi, North Sumatra by optimizing wet fermentation using yeast R1-TKSU and LAB (Leuconostoc suionicum).
2. Methodology
2.1. Materials
Ateng coffee cherries originating from Sumbul, Dairi - North Sumatra, green coffee beans, yeast R1-TKSU dan LAB (Leuconostoc suionicum) Potato Dextrose Broth (PDB), Potato Dextrose Agar (PDA), Nutrient Broth (NB), Nutrient Agar (NA), de Man Rogosa Sharpe Broth (MRSB), de Man Rogosa Sharpe Agar (MRSA), NaCl,Aquadest, 70% alcohol, Pro-analytical alcohol, rubbing alcohol, acetonitrile, methanol grade HPLC, and deionized water.
2.2. Sample Preparation and Fermentation
The selected ateng coffee cherries are mechanically pulped using a local farmer's pulper machine. Two kg of peeled coffee was fermented with the addition of yeast R1-TKSU inoculum, LAB (Leuconostoc suionicum), and yeast R1- TKSU : LAB (Leuconsotoc suionicum) 1:1, there was also a control without the addition of inoculum. Henceforth, treatment with the addition of yeast R1-TKSU inoculum will be referred to as "yeast treatment", treatment with the addition of LAB (Leuconostoc suionicum) inoculum will be referred to as "LAB treatment", treatment with the addition of yeast : LAB - 1:1 inoculum will be referred to as "yeast : LAB – 1:1". The inoculum concentration used was 10% (v/w), with cell
density of 108 CFU/mL. Fermentation occurred for 12 hours, at 30o C. During fermentation, samples were taken every 4 hours to determine the dynamics of the microbial population and the pH value. After fermentation, the coffee beans are washed thoroughly, then dried in the sun until the water contentreach standard water content range between 8.0% and 12.5% [8– 10]. Then the parchment skin / silver skin is peeled to obtain the green coffee beans.
2.3. Analysis of Organic Acids
The organic acid analysis refers to Figueroa Campos et al., (2020), 100 mg of ground coffee beans are dissolved in 10 mL of deionized water. Extraction was performed at room temperature under shaking conditions for 30 min. Subsequently, the suspension was centrifuged at 9300× g for 10 minutes. After the pellet and supernatant were separated, the supernatant was collected and then stored at 4o C for further quantification. Organic acids content was determined using a HPLC system (Shimadzu UFLC HPLC system). Analyses was performed with column C18 (4.6 x 250 cm, 5 um), mobile phase of aceto- nitrile, 0.1% H3PO4. Analysis was performed for lactic acid, acetic acid, citric acid and malic acid. Standard solutions were used to determine the concentration of the organic acids being analyzed.
2.4. Analysis of Sugar and Ethanol
For the sugar and ethanol analysis refers to the method of Con- stantino et al., (2020), 500 mg of green coffee beans that have been mashed are dissolved in 20 mL of deionized water, then shaken for 90 minutes at 60o C. The suspension was centri- fuged at 1048 x g for 10 minutes, then the supernatant was transferred to a new small glasstube and then stored in the refrigerator at 4o C for further quantification. Sugars and ethanol analysis were determined by HPLC system (Shimadzu UFLC HPLC System), with a column Shimadzu SCR 101-C, deion mobile phase. Analysis was performed for sucrose, glucose, fructose, and ethanol. Standard solutions were used to determine the concentrations of the sugars and ethanol analyzed.
2.5. Analysis of Amino Acid
Amino acid analysis was carried out at PT. Saraswanti Indo Genetech, Bogor using Ultra-performance Liquid Chromatography (UPLC). The analysis followed the rules that apply in the laboratory. A sample of 0.1 – 1 gram of green coffee bean was placed into a 20 mL headspace vial, then the coffee beans were hydrolyzed with HCL. The hydrolysis results were transferred into a 50 mL measuring flask. In the hydrolysis results that have been transferred, aquabidest was added up to the tera mark, then homogenized. The sample solution was filtered with a 0.2 µm filter syringe, then the filtrate was collected. The process the continues to the derivatization stage, which the solution was injected into the UPLC system. The column used was C18, the mobile phase was Eluent Accq.
Ultra Tags; Aquabidest, with a gradient pump system, column temperature 49°C, the detector used was PDA.
2.6. Cupping Test
The cupping test was carried out by Q-grader at the Coffee and Cocoa Research Center, Jember. Cupping test on fermented green coffee beans using the Specialty Coffee Association of America method. The parameters tested were Fragrance/Aroma, Flavor, Aftertaste, Acidity, Body, Uniformity, Balance, Clean cup, Sweetness, Overall. Parameter scale from 1 – 10 points. The results of the evaluation of each parameter are summarized as an explanation of the final coffee score [27].
2.7. Statistic Analysis
Statistical analysis was performed using SPSS Statistics 21, with a 95% confidence level. One-way analysis of variance (ANOVA) was performed and the statistical significance of the difference (p<0.05) was evaluated followed by Dun- can's multiple range test (DMRT).
3. Result and Discussion
3.1. Dynamics of Microorganisms Population
In the control treatment, yeast was the predominant microorganism, followed by total bacteria, while LAB had slower growth compared to yeast and total bacteria (Figure 1a). This is also shown by the growth rate of each microorganism: LAB (0.018/hour) grew slower than yeast (0.026/hour), and total bacteria (0.029/hour).
3.1.1. Fermentation with YeastTreatment
In fermentation with yeast treatment, the yeast population dominates the microbial community (Figure 1b). The addition of yeast did not seem to affect the condition of the LAB, because the growth of LAB was observed to be the same as LAB in control treatment (Figure 1.b). The growth rate of LAB in the control and LAB with yeast addition showed similar figures: LAB in control treatment was 0.018/hour, while LABin yeast treatment was 0.015/hour. However, it is hypothesized that the addition of yeast affects the number of total bacteria so that the number of total bacteria is less than yeast (compare yeast in control conditions and yeast in the addition of yeast treatment) (Figure 1b). This may occur due to nutritional competition, as both yeast and total bacteria use the same nutrient such as glucose [28–30], while indigenous LAB can use fructose [31].
In yeast treatment, a decrease in number of yeast cells was observed at the 8th hour of fermentation. This decrease could be caused by the high accumulation of ethanol and other alcohol-derived compounds produced by yeast metabolism [32]. In this treatment, the number of yeast cells at 0 hour was significantly higher compared to the number of LAB cells and total bacteria (yeast: 2x10⁸ CFU/mL, LAB: 1x10⁷ CFU/ mL, Total Bacteria: 3x10⁷ CFU/mL) (Figure 1.b), resulting in yeast dominating the microbial community. This yeast dominance was clearly visible until the 4th hour of fermentation (yeast: 2x10⁹ CFU/mL, LAB: 3x10⁷ CFU/mL, Total Bacteria: 3x10⁷ CFU/mL) (Figure 1.b). Although the number of yeast cells in this treatment did not exceed the number of yeast cells in the control treatment, yeast dominance is thought to have caused the high accumulation of ethanol (38,2 mg/g) (Figure 3d). However, the high accumulation of ethanol compounds, produced by yeast metabolism is thought to have caused the decrease in the number of yeast cells in the 8th hour of fermentation. The high accumulation of ethanol compounds and other alcohol derivatives is supported by the dominance of yeast cells at the beginning of fermentation (0 to 4th hour of fermentation) (Figure 1b).
3.1.2. Fermentation with LAB Treatment
The addition of LAB was able to increase the amount of LAB when compared to LAB in the control and in yeast treatment (Figure 1c). Microorganisms' growth conditions in the LAB treatment at the start of fermentation (0 hour) showed that LAB fermentation had higher cell count compared to LAB in the control and LAB in yeast treatment (Figure 1a, 1b, 1c). At the 12th hour, LAB in fermentation with LAB treatment also still had a greater cell number compared to LAB in the control and in yeast treatment. This indicates that the addition of LAB inoculum was able to increase the number of LAB when compared to LAB in control and in yeast treatment. In the LAB treatment, at 8th hour, the number of yeast cells remained constant. This is thought to be related to the condition of the LAB cells during fermentation, where in the LAB treatment the number of LAB cells was in large numbers (the number of LAB cells in the LAB treatment had larger numbers than LAB in the control treatment, and LAB in yeast treatment, respectively in CFU/mL: 3x10⁹ , 7x10⁸ , 9x10⁷ , Figure 1).
He et al., (2021) in their research stated that LAB can inhibit yeast growth by releasing organic acids or competing for nutrients and physical space. However, the presence of LAB may provide benefits for yeast growth such as promoting or inhibiting various metabolic processes in yeast cells: metabolism of trehalose, ergosterol, certain amino acids, proton pumps, stress response transcription activators. Additionally, LAB presence is also able to increase yeast tolerance to ethanol [33]. This suggests that there is a complex relationship between yeast and LAB.
Therefore, based on the explanation above, there are two hypotheses regarding the cause of the constant number of yeast cells in the 8th hour of fermentation. The first hypothesis is that LAB inhibits yeast growth by releasing organic acid compounds, or through competition for nutrients so that yeast cell growth does not increase, but remains constant.
The second hypothesis is that the presence of LAB increases yeast tolerance to ethanol so that yeast growth does not decrease, but remains constant.
On the other hand, the condition of the constant number of yeast cells at the 8th hour of fermentation is thought to have an influence on the condition of the total bacteria which is also constant at the 8th hour of fermentation. Based on previous hypothesis about yeast condition, the presence of LAB can increase yeast tolerance to ethanol, but the yeast still produces ethanol. Ethanol production by yeast can lower oxygen levels in the fermentation environment. This situation is less favorable for the growth of total bacteria because the total bacteria which is likely consists of aerobic bacteria. This suggeststhat aerobic bacteria cannot grow, leading to no increase in total bacterial growth. In addition, based on previous hypothesis, there is inhibition of yeast cell growth by LAB. Inhibition yeast growth may reduce the concentration of ethanol in the fermentation environment [34, 35]. This ensures the fermentation environment have sufficient oxygen concentration so that total bacterial growth did not decrease, but remains constant. At the 12th hour of fermentation, there was an in- crease in yeast cells and total bacteria. This could be due to reduced ethanol concentration from the fermentation environment because ethanol had diffused into the coffee beans [36], or evaporated [37]. This evaporation can be supported by stirring during sampling so that the ethanol exits the fer- mentation environment. Stirring also facilitates the addition of oxygen into the fermentation environment, supporting the growth of total bacteria.
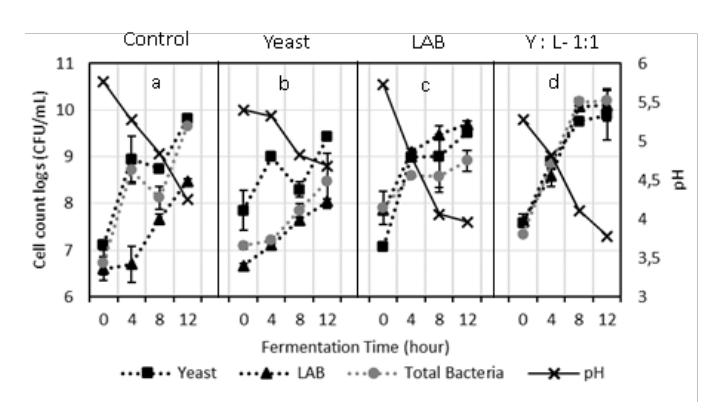
Figure 1. Population Dynamics of Microorganisms, and pH in All Fermentation Treatments. The fermentation scale was 2 kg of coffee beans, 10% inoculum concentration (v/w), with an initial cell density of (b) Yeast 1 x 10⁸ CFU/mL, (c) LAB 1.1 x 10⁸ CFU/mL, (d) Yeast 1.25 x 10⁸ CFU/mL; LAB 1.35 x 10⁸ CFU/mL.
3.1.3. Fermentation with Yeast : LAB – 1:1 Treatment
In the yeast : LAB - 1:1 treatment, the growth of microorganisms had a different pattern compared to the growth of microorganisms in other treatments. In other treatments, at the 8th hour of fermentation, there was a decrease in yeast cell growth (as seen in the control treatment and yeast treatment) and there was constant yeast cell growth (as seen in the LAB treatment). However, in the yeast : LAB - 1 : 1 treatment, yeast growth continued to increase (Figure 1). Similarly, at the 8th hour of fermentation, there was a decrease in total bacterial cell growth (in the control treatment) and there was constant total bacterial cell growth (in LAB treatment), while in the yeast : LAB - 1:1 treatment, total bacterial growth continued to increase (Figure 1).
Apart from that, in the treatment yeast : LAB - 1:1, the growth of yeast, LAB, and total bacteria at each sampling hour relatively consistent (Figure 1d). The growth of microorganisms in the yeast : LAB - 1:1 treatment can be caused by positive interactions between the added inoculum, that are yeast and LAB. As previously explained by He et al., (2021), LAB can inhibit yeast growth, but on the other hand, it can provide benefits for yeast growth. This is a complex relationship between yeast and LAB. Another study by Pregolini et al., (2021) states that there is a positive interaction between yeast and LAB, that yeast autolysis will release nutrients such as polysaccharides, riboflavin, and amino acids for the growth of LAB. The growth of LAB will make the fermentation medium acidic and create a favorable environment for yeast development [38]. There is a hypothesis that this positive interaction between yeast and LAB occurs because the amount of inoculum inoculated is the same. So that the same growth between yeast and LAB at this starting point mutually supports the growth of yeast and LAB. Apart from that, Canon et al., (2020) also stated that co-inoculum treatment can increase the content of peptides, amino acids, organic acids, volatile compounds which can better support microbial growth compared to single inoculum treatment. Based on this, it is hypothesized that the total growth of bacteria which continues to increase in the 8th hour of fermentation is supported by the growth of yeast and LAB which have a positive interaction so that the organic acid content, volatile compounds and peptide content are able to support the total growth of bacteria.
3.1.4. pH Value
The pH value during the fermentation treatment decreased. The decrease in pH value is caused by the consumption of carbon compounds by microorganisms that produce organic acids such as lactic acid or acetic acid [32], as well as organic acids found in coffee mucilage such as citric acid [40]. In all treatments with the addition of LAB inoculum, that are the LAB treatment and the yeast : LAB-1:1 treatment, the final pH had a lower value compared to the other treatments (final pH value of each treatment: control: 4.25, yeast : 4.68, LAB : 3.97, yeast : LAB - 1:1 : 3.87) (Figure 1). This is due to the large number of LAB cells in this treatment (Figure 1c, d) which produce lactic acid or acetic acid, because the inoculated LAB (Leuconsotoc suionicum) is a heterofermentative type of LAB [41]. Meanwhile, the final pH value in the yeast treatment was the highest among all treatments (Figure 1). This can be caused by the growth conditions of microorganisms in this treatment, where the growth of microorganismsis dominated by yeast or the growth of LAB is not higher than yeast (Figure 1b).
3.2. Organic Acids
Citric acid and malic acid are naturally present in green coffee beans [42, 43]. The concentrations of malic acid and citric acid in green coffee beans in all fermentation treatments did not have a significant difference (p-value > 0.05) (Figure 2a, 2b). The content of malic acid and citric acid can contribute to the citric and herbaceous taste after roasting [43]. In addition, malic acid can also provide apple flavor [44], but it did not appear in this study.
The presence of lactic acid and acetic acid in green coffee beans is the result of microorganisms metabolism during fermentation [45]. Lactic acid can give a sour, astringent, and acrid or sharp taste [43]. Lactic acid can also give a buttery taste [44], but this taste did not appear in this study. Meanwhile, acetic acid can give a fruity taste when it is at low concentrations [46]. The presence of acetic acid at low concentrations is desirable because high concentrations of acetic acid will give an unpleasant taste. The highest concentrations of lactic acid and acetic acid were in green coffee beans treated by the yeast : LAB – 1:1, with lactic acid 264,88 mg/g and acetic acid at 19,84 mg/g (Figure 2c, 2d). The high concentration of lactic acid and acetic acid in this treatment was caused by lactic acid bacteria has high growth (12th hour of fermentation number of cells reach 3x10¹⁰ CFU/mL), in which the inoculated LAB (Leuconsotoc suionicum) is a heterofermentative bacteria that converts carbon compounds into lactic acid, acetic acid, CO2 , and ethanol, through phosphoketolase or pentose phosphate pathway [47]. In addition, yeast : LAB – 1:1 addition also had the lowest pH value compared to other treatments. The decrease in pH value is caused by organic acids resulting from the metabolism of fermented microbes [32].
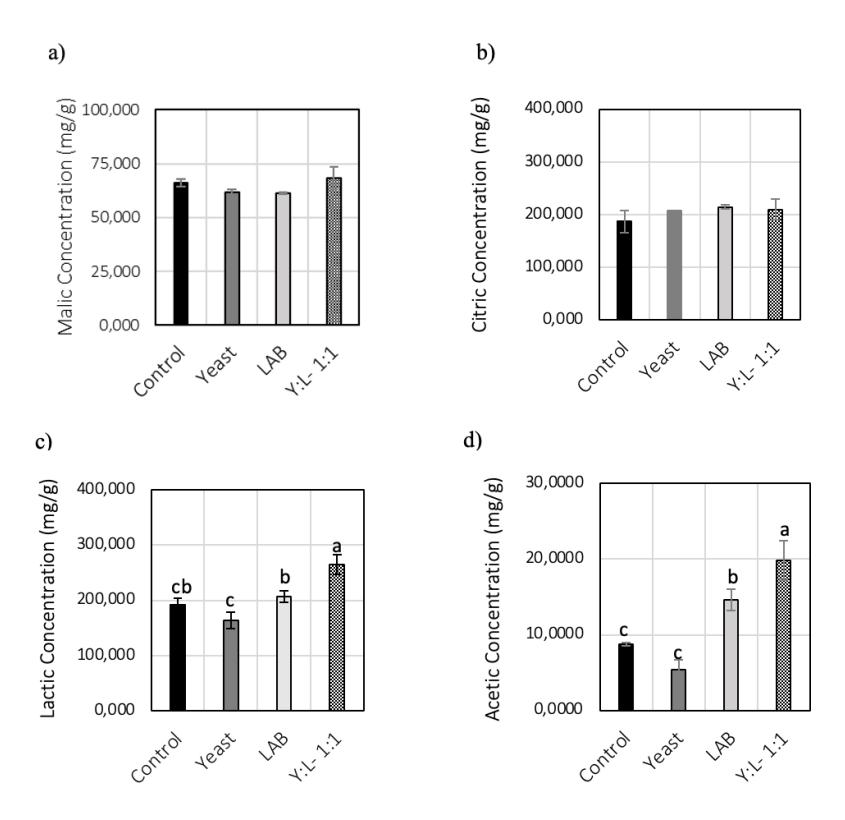
Figure 2. Content of (a) malic acid, (b) citric acid, (c) lactic acid (d) acetic acid in green coffee beans from all fermentation treatments. The vertical bar represents the standard deviation. Different letters represent significant differences on the Duncan Multiple Range Test at a significant level of 0.05.
3.3. Sugar and Ethanol
In this study, the sucrose content was much higher than glucose and fructose (Figure 3a, 3b, 3c). According to Knopp et al., (2006), the concentration of fructose and glucose in green coffee beans was 20 times lower than sucrose. Thisdifference was due to the abundant presence of sucrose in the beans, while glucose and fructose were abundant in the coffee pulp and mucilage [48]. In this study, the sucrose, glucose, and fructose content of green coffee beans from all fermentation treatments did not differ significantly from one another (pvalue > 0.05), indicating that variations in fermentation treatments did not have a large effect on the sucrose, glucose, and fructose content of coffee.
The low concentration of glucose and fructose in green coffee beans observed in this study is related to the wet processing process [49], which is pulp stripping process where glucose and fructose are abundant in pulp and mucus [48]. In contrast, glucose and fructose will be found in higher level in coffee beans processed using dry method [49].
Sucrose, fructose, and glucose are thought to play an important role in the organoleptic quality of coffee. Sucrose
can decompose during roasting to release several aroma and taste precursors [50], while fructose and glucose are also precursors in the formation of coffee flavors [51]. Sugar as a precursor will produce volatile and non-volatile compounds, such as furan, pyrazine, aliphatic acid, and hydroxymethyl furfural which affect the taste of coffee [52]. Higher sugar content is associated with better cup quality [53].
The ethanol content in green coffee beans did not only come from yeast [54], but also Leuconostoc suionicum, a type of heterofermentative LAB that produces ethanol [41]. The highest concentration of ethanol in the green coffee beans was resulting from the yeast treatment, while the ethanol concentration of green coffee beans from the other treatments was lower and not much different from one another (Figure 3d). The high concentration of ethanol in green coffee beanstreated with yeast was supported by a decrease in the number of yeast cells at the 8th hour during fermentation. As mentioned above, the decrease in the number of many cells is caused by the accumulation of high concentration of ethanol and other alcohol-derived compounds resulting yeast cells cannot survive and their numbers decrease.
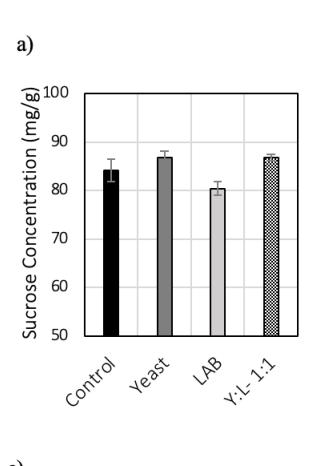
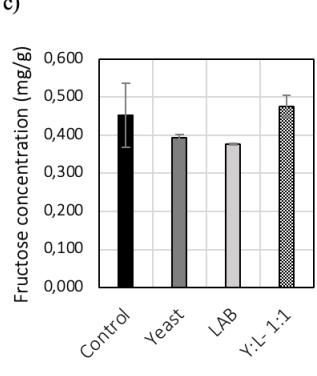
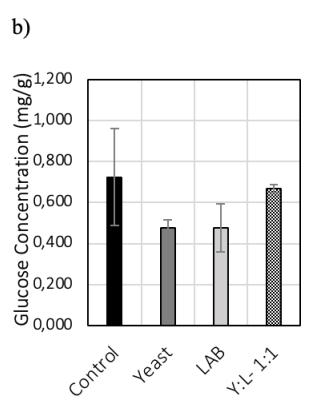
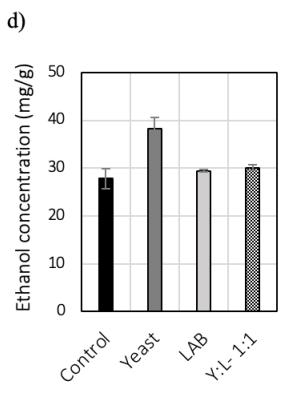
Figure 3. Contents of (a) sucrose, (b) glucose, (c) fructose, and (d) ethanol in green coffee beans in all fermentation treatments. The vertical bar represents the standard deviation.
3.4. Amino Acid
Amino acids are flavor precursors in coffee [55, 56]. When green coffee beans are roasted, these precursors play a role in Maillard and Strecker degradation reactions forming aldehydes, furans, pyrazines, pyridines, oxazoles, ketones, phenols, pyrroles [57]. The amino acid content in green coffee beansis affected by protein or peptide catabolism by fermenting microorganism [58, 59], metabolism of microorganisms
during fermentation [60], or through the germination process that occurs in coffee beans during processing [42].
The amino acid concentrations in this study can be seen in Table 1. Green coffee beans resulting from the yeast and LAB treatment have 5 amino acids with slightly higher concentrations than the control. These amino acids (respectively for control, yeast, and LAB) are phenylalanine (6.43 - 7.15 - 7.13 mg/g), arginine (6.86 - 7.30 - 7.28 mg/g), aspartic acid (7,45 - 7,66 - 7,76 mg/g), threonine (5.10 - 5.29 - 5.16 mg/g) histidine (2, 82 - 3.009 - 3.01 mg/g). Meanwhile, green coffee beans treated with yeast : LAB-1:1 exhibit higher concentrations of four specific amino acids compare to those treated with yeast and LAB. These amino acids and their concentrations are: phenylalanine (7.71 mg/g), arginine (8.22 mg/g), tyrosine (4.14 mg/g), histidine (3.31 mg/g). Apart from that, in the yeast : LAB 1:1 treatment there were also 6 amino acids with higher concentrations compared to other treatments: serine (7.35 mg/g), isoleucine (4.18 mg/g), valine (5.31 mg/g), alanine (5.14 mg/g), glycine (8.55 mg/g), leucine (5.58 mg/g), so there were 10 amino acids with higher concentrations in green coffee beans treated with yeast : LAB 1:1 compared to control. This indicates that the yeast and LAB treatment were able to increase the concentration of amino acids over the control, but the treatment of yeast : LAB-1:1 resulted in even greater increases the amino acid concentrations compared to treatment with yeast and LAB alone.
The high concentration of amino acids in green beans coffee resulting from the treatment of yeast : LAB- 1:1 is in accordance with research by Canon et al., (2020) which states that co-culture treatment can increase the concentration of amino acids in food fermentation. The high concentration of this amino acids also indicates that there is a positive interaction between yeast and LAB, which Pregolini et al., (2021) in their research stated that co-culture treatment can increase metabolite production.
| Table 1. Amino acid content of green coffee beans in all fermentation treatments. |
|---|
| Treatment | ||||||
|---|---|---|---|---|---|---|
| Amino Acid | Control | YEAST | LAB | Y:L- 1:1 | ||
| (mg/g) | (mg/g) | (mg/g) | (mg/g) | |||
| L-Serine | 6,88 ± 0,018 | 6,99 ± 0,024 | 6,88 ± 0,013 | 7,35 ± 0,027 | ||
| L-Glutamic Acid | 12,27 ± 0,045 | \(11,50 \pm 0,034\) | 12,07 ± 0,057 | 12,14 ± 0,009 | ||
| L-Phenylalanine | 6,43 ± 0,019 | 7,15 ± 0,017 | \(7,13 \pm 0,027\) | \(7,71 \pm 0,006\) | ||
| L-Isoleucine | 3,99 ± 0,002 | 3,99 ± 0,013 | \(3,88 \pm 0,008\) | \(4,18 \pm 0,002\) | ||
| L-Valin | 5,05 ± 0,021 | 4,91 ± 0,010 | \(4,95 \pm 0,009\) | 5,31 ± 0,005 | ||
| L-Alanine | 5,004 ± 0,019 | 5,05 ± 0,008 | \(5,04 \pm 0,010\) | \(5,14 \pm 0,006\) | ||
| L-Arginine | 6,86 ± 0,037 | \(7,30 \pm 0,027\) | \(7,28 \pm 0,016\) | 8,22 ± 0,017 | ||
| L-Glycine | 7,99 ± 0,042 | 8,07 ± 0,028 | 8,07 ± 0,028 | 8,55 ± 0,011 | ||
| L-Lysine | 4,86 ± 0,015 | \(4,44 \pm 0,011\) | \(4,69 \pm 0,014\) | \(4,64 \pm 0,002\) | ||
| L-Aspartic Acid | 7,45 ± 0,028 | 7,66 ± 0,014 | 7,76 ± 0,025 | \(7,67 \pm 0,013\) | ||
| L-Leucine | 8,38 ± 0,031 | \(8,13 \pm 0,009\) | 8,05 ± 0,020 | \(8,58 \pm 0,008\) | ||
| L-Tyrosine | \(3,38 \pm 0,008\) | \(3,68 \pm 0,002\) | \(3,59 \pm 0,010\) | \(4,14 \pm 0,000\) | ||
| L-Proline | 5,63 ± 0,014 | 5,50 ± 0,009 | \(5,43 \pm 0,020\) | 5,66 ± 0,007 | ||
| L-Threonine | 5,10 ± 0,023 | 5,29 ± 0,020 | 5,16 ± 0,017 | 5,60 ± 0,012 | ||
| L-Histidine | 2,82 ± 0,007 | 3,009 ± 0,00 | 3,01 ± 0,002 | 3,31 ± 0,004 | ||
3.5. Cupping Test
The cupping test results from fermentation optimization, which consist of 10 characteristics with the final score, are shown in Table 2. All samples have a cupping score which is classified as specialty coffee because the total valueproduced is ˃80 [27]. However, the sample that underwent fermentation with the addition of inoculum had a higher cupping score than the control.
The control and yeast treatments shared the same flavor notes: brown sugar, nutty, flowery, honeyed, spicy-coriander seed like, and rather woody. The LAB treatment has notes of honeyed, flowery-coffee blossom, nutty, and spicy-chili like. The yeast : LAB- 1:1 treatment has notes of honeyed, flowerycoffee blossom, and lemony.
The same flavor notes of control and yeast treatment can occur because of the similarity in the pattern of microbial growth, which are both dominated by yeast. However, the yeast treatment has a higher cupping score than control treatment (86.00 > 84.50) (Table 2). This could be due to the presence of amino acids with higher concentrations than the control, such as phenylalanine, arginine, aspartate, threonine, histidine. Yeast can produce flavor precursors such as aldehydes, ketones and fatty acid esters [61]. It is hypothesized that in yeast treatment, the dominance of the yeast population produces flavor precursors in higher concentrations than in the control treatment, thus this supports the cupping score yeast treatment was higher than the control treatment. In addition, green coffee beans treated with addition of yeast had the highest concentration of ethanol compared to other treatments. Ethanol produced by yeast is known to also act as an aroma precursor [37]. Ruta & Farcasanu, (2021) in their research stated that alcohol produced by yeast goes through the ester formation stage, in which ester formation contributes toflowery and fruity notes in coffee. The high concentration of esters can have a positive impact on coffee quality [17].
The LAB treatment had the highest cupping score of all treatments that is 86,5 (Table 2). LAB is able to produce lactic acid and acetic acid which play a role in the taste of coffee, LAB is also able to produce 4-carbon compounds, active flavor compounds, including diacetyl, acetoin, and 2,3 butanediol by metabolizing citric acid [14], LAB is also able to produce mannitol (sugar alcohol) as a result of fructose reduction [13, 62, 63]. In the fermentation process, LABis able to break down amino acids which has implications for the formation of low molecular weight compounds, such as aldehydes, esters, carboxylic acids, and alcohols which can give flavor to coffee [14].The high number of LABcellsin this treatment indicated the possibility of the presence of the metabolites mentioned above in high concentrations as well, thus being the cause of the high cupping score. In addition, in this treatment, the number of yeast cells is also high, as has been stated that yeast is able to produce ethanol [37], aldehydes, esters [61] which contribute to the taste of coffee.
Table 2. Cupping Test results in all fermentation treatments.
| Characteristic | Treatment | |||||
| Characteristic | Control | YEAST | LAB | Y:B-1:1 | ||
| Fragrance/aroma | 8,00 | 8,50 | 8,50 | 8,00 | ||
| Flavor | 8,00 | 8,00 | 8,00 | 8,00 | ||
| Aftertaste | 7,50 | 8,00 | 8,00 | 7,75 | ||
| Acidity | 8,00 | 7,75 | 8,00 | 8,00 | ||
| Body | 7,75 | 8,00 | 8,00 | 7,75 | ||
| Uniformity | 10,00 | 10,00 | 10,00 | 10,00 | ||
| Balance | 7,75 | 7,75 | 8,00 | 7,75 | ||
| Clean cup | 10,00 | 10,00 | 10,00 | 10,00 | ||
| Sweetness | 10,00 | 10,00 | 10,00 | 10,00 | ||
| Overall | 7,50 | 8,00 | 8,00 | 7,75 | ||
| Final Score | 84,50 | 86,00 | 86,50 | 85,00 | ||
As mentioned above, there is a hypothesized that yeast and LAB that grow in yeast : LAB – 1:1 treatment had a positive interaction which able to increase metabolite production [38, 39]. This indicates that there is a high probability of the presence of metabolites that affect the taste in high concentrations such as aldehydes, esters, ethanol compounds. In addition, amino acid testing also proved that the concentration of amino acids (role as flavor precursors) was higher in green coffee beans treated with yeast : LAB-1:1 than other treatments (Table 1). However, the cupping score in this treatment did not exceed the cupping score in the yeast treatment and LAB treatment. By comparing the pattern of microbial growth during fermentation, there is one difference between yeast, and LAB treatment, and the yeast : LAB treatment, the difference is in the growth pattern of total bacteria.
In yeast treatment and LAB treatment, total bacteria grew in lower abundance than yeast and LAB. Meanwhile, in the yeast : LAB-1:1 treatment, the total bacteria grew well, showing growth similar to that of yeast and LAB (Figure 1). This can be caused by the positive interaction between yeast and LAB which produces many metabolites such as peptides, amino acids, organic acids so that they can support total bacterial growth [39]. In this study, it was not carried out to check the types of bacteria that were present during fermentation, but this can be learned from other studies, in which there is one type of microbial family that is generally present in coffee fermentation, that is Enterobacteriaceae [12, 64–66]. The Enterobacteriaceae family is generally present in coffee because it can come from water or from the coffee fruit itself [38]. Research in Indonesia also states that Enterobacteriaceae is a microbe that plays a role in the fermentation of Arabica coffee, Jember, East Java [67]. Pregolini et al., (2021) stated that during coffee fermentation, Enterobacteriaceae was able to be present in high numbers until the 36th hour of fermentation even though there were lactic acid bacteria in high cell numbers. Enterobacteriaceae is one of the bacteria whose presence is undesirable because it is not related to the preferred flavor precursors in coffee, and these bacteria can produce off-flavor metabolites such as 3-isopropyl-2 methoxy-5-methylpyra- zine, 2,3-butanediol and butyric acid. Based on this, it does not rule out the role of Enterobacteriaceae in the fermentation of ateng coffee. Although in the yeast : LAB 1:1 treatment showed no defects (distorted taste), the compounds produced by total bacteria (presumably one of the species is Enterobacteriaceae) can cause other processes that contribute to the taste of coffee.
This suggests that despite the pattern of microbial growth in yeast : LAB 1:1 treatment was better than yeast treatment, and LAB treatment; and the concentration of amino acids in the yeast : LAB1:1 treatment higherthan the addition of yeast, and addition of LAB treatments, but the presence of high total bacteria resulted in a cupping score that did not exceed the yeast, and LAB treatment.
3.6. Relationship of Organic Compounds with Coffee Flavors Formed
The role of amino acids, sugars, organic acids in forming flavors occurs when green coffee beans are roasted. Reactions that can form include Maillard and Streckerdegradation which can produce flavor compounds [68]. The Maillard reaction is a non-enzymatic browning reaction that occurs between amino acids and sugars [69]. Strecker degradation is the reaction of free amino acids with carbonyl group derivatives from the Maillard reaction which causes the degradation of amino acids into aldehydes which contribute to the aroma of coffee. Maillard reactions and Strecker degradation can produce flavor compounds such as pyrazines, alcohols, esters, aldehydes, ketones, furans, thiazoles, pyrones, acids, imines, amines, oxazoles, pyrroles, and ethers [70].
The relationship of organic compounds with coffee flavors formed shown in Table 3. In all treatments there is a honeyed flavor. The honeyed flavor is formed through a Strecker degradation reaction, the compound that plays a role is phenylacetaldehyde which is a phenylalanine derivative [71,72]. This shows the important role of phenylalanine as a honeyed flavor precursor. The concentration of phenylalanine in green coffee beans treated with control, yeast treatment, LAB treatment, and yeast : LAB - 1:1 treatment increased sequentially.
Table 3. The relationship between amino acids and coffee flavor formed in all treatments.
| Treatment | Amino Acid | Flavour | Reaction | |
|---|---|---|---|---|
| L-Fenilalanin | Honeyed | Strecker degradation | ||
| L-Alanine | Maillard | |||
| L-Serin | Nutty | |||
| Control | L-Threonine | |||
| L-Fenilalanin | Flowery | Maillard | ||
| L-Tyrosine | riowery | |||
| L-Leucine Brown sugar | Maillard | |||
| L-Fenilalanin O | Honeyed | Strecker degradation | ||
| L-Alanine 0 | Maillard | |||
| VEACT (D4 | L-Serin O | Nutty | ||
| YEAST (R1- TKSU) | L-Threonine 0 | |||
| 1130) | L-Fenilalanin O Flowery | Maillard | ||
| L-Tyrosine 0 | riowery | ividilal u | ||
| L-Leucine 0 | Brown sugar | Maillard | ||
| L-Fenilalanin O | Honeyed | Strecker degradation | ||
| L-Alanine 0 | Maillard | |||
| LAB (Leuconostoc | L-Serin O | Nutty | ||
| suionicum) | L-Threonine 0 | |||
| , | L-Fenilalanin O | Flowery-Coffee | Maillard | |
| L-Tyrosine 0 | Blossom | |||
| L-Fenilalanin • | Honeyed | Strecker degradation | ||
| YFAST : LAB | L-Histidine ● | Lemony | Maillard | |
| (1:1) | L- Phenylalanine • | Flowery-Coffee Blossom | Maillard | |
The nutty flavor is possessed by control, yeast, and LAB treatment. Compounds that play a role in the nutty flavor are alkylpyrazine [71] which are formed through the Maillard reaction [57], the amino acids that play a role are alanine, serine, and threonine [51]. The nutty flavor did not appear in coffee produced by yeast : LAB 1:1 treatment, presumably because there were other types of amino acids that were more dominant or the influence of other compounds [73].
All treatments exhibit flowery flavor, which could be related to the Maillard reaction, where amino acids such as glycine, proline, phenylalanine, and tyrosine contribute to this flavor [74]. Apart from going through the Maillard reaction, a flowery flavor can also appear due to the ester content in the green coffee beans, which is indicated by the presence of ethanol content in the green coffee beans. According to Ruta & Farcasanu (2021), alcohol produced by yeast goes through the stage of ester formation. Formation of the ester contributes to the floral sensory note [17].
Brown sugar flavor is a sweet chocolate flavor, this flavor is formed through the Maillard reaction in which the amino acid that plays a role is leucine [75].
The lemony flavor is classified into fruity, citrus flavors with a taste description of citric, sour, astringent, slightly sweet, flaky, and slightly floral aroma associated with lemon [76]. The lemony flavor can be formed through the Maillard reaction with histidine as an amino acid that plays a role [74]. In the yeast : LAB- 1:1 treatment, the lemony flavor formed was thought to be related to histidine which was present in the highest amount compared to other treatments. In addition to amino acids, the lemony flavor is associated with citric acid [77, 78]. The results of the citric acid test for all treatments did not show a significant difference with one another (p-val- ue > 0.05). However, because the concentration of citric acid was supported by the high concentration of histidine in the yeast : LAB1:1 treatment, enhancing the flavor. As previously mentioned, the taste of coffee is not only formed by onecompound, but can be caused by several compounds [73].
Spicy and woody flavors are related to phenolcompounds in green coffee beans [71, 79]. There is an assumption that the green coffee beans resulting from the control, the yeast, and LAB treatments have a high content of phenolic compounds that support the formation of spicy and woody flavors.
4. Conclusion
Optimization of the wet fermentation of ateng coffee with the addition of yeast R1-TKSU and LAB (Leuconostoc suionicum) can improve the quality of ateng coffee and compounds related to coffee flavor such as amino acids and organic acids. However, it is necessary to test the volatile compounds of green coffee beans which play an important role in the taste of coffee in order to further refine the knowledge of the influence of microorganisms on the formation of coffee flavor precursors.
Acknowledgement
The authors would like to thank the Girsang family for helping and providing a research location in Sumbul, Dairi, North Sumatera. The authors also thank Mr. Simatupang and Mrs. Simatupang who have provided research fund. The authors also thank Intan Taufik, S.Sc., M.Sc., Ph.D, as one of the resource lecturers for their support, assistance, suggestions and advice during this research. The authors also thank SITH-ITB for providing research fund, providing research tools and places.