
1. Introduction
Each year, Indonesia faces the threat of a decrease in national rice production. According to the Central Statistics Bureau [1], rice production declined nationally during 2018- 2021, presenting a threat to national food security. The decline in rice production may be caused by several factors, including climate change, water and soil pollution, arthropod pests, plant diseases, and land conversion [2-5].
Attack by arthropod pests is one variable that significantly affects the rice agricultural sector. Arthropod pests cause annual losses of 18–26% of the world's rice production, orUSD 470 billion [6]. An imbalance in the structure of the arthropod community in the rice agroecosystem is the cause of the rise in arthropod pest attacks on plants. According to Mori [7], the transformation of paddy fields into settlements as a result of urbanization is one of the factors that alter the structure ofthe arthropod community.
The heterogeneity of vegetation types forming land cover in the paddy field border zones has tended to decrease due to the conversion of paddy fields into settlements [7]. The phenomena of biotic homogeneity, or the tendency of organisms in ecosystems to homogenize as a result of perturbations by human activity, has been caused by the conversion of paddy fields into settlements, which is common in urban areas. The city and district of Bandung in West Java are among the many locations in Indonesia that are under pressure from the conversion of paddy fields into settlements as a result of urbanization. The heterogeneity of vegetation cover types on land adjacent to paddy fields may be reduced as a result of this circumstance in Bandung's rice agroecosystem.
Heong [8] found that the structure of the arthropod community is impacted by the use of pesticides. A pesticide "tsunami" has resulted from the increased use of pesticides, particularly insecticides, which has caused the environmental calamity. The pesticide tsunami reduced the diversity of arthropods by causing the loss of numerous biota. Ngin [9] claims that decreased arthropod diversity caused an expansion in populations of herbivorous arthropods that have the potential to harm rice plants. The majority of rice farmers in Bandung, West Java, still use chemical insecticides to control arthropod pests. Thus, both landcover heterogeneity and insecticide use have the potential to affect the structure of the arthropod community in Bandung, West Java.
Several studies have examined how the structure of arthropod communities is impacted by the variability of land cover heterogeneity and insecticide use. A recent study by Sattler [4, 10] described the relationship between land cover heterogeneity and pesticide used with arthropod communities during the dry season in Vietnam, while there has been no study of how these two factors affect an arthropod community structure in the rainy season. According to Holmquist [11], the climatic changes between the dry and wet seasons might lead to diverse arthropod community patterns. Additionally, insect pest attacks on rice agroecosystems tend to be more frequent during the rainy season in tropical nations like Indonesia(October – March).
The association between land cover heterogeneity and insecticide usage with arthropod community patterns in rice agroecosystems in the city and district of Bandung during the rainy season must be studied in light of the aforementioned description. The sustainability of the rice agroecosystem is significantly influenced by the structure of the arthropod community, which is characterized by the value of diversity. The high diversity of arthropods indicates the existence of intricate interaction systems that enable the management of the population of arthropods that can become pests for rice.
The investigations on the community structure of organisms require analysis at several spatial scales [12,13]. A thorough understanding of the distribution of species in a region and the dynamics of interactions within a community is made possible by an understanding of community structure at different geographical scales. Whittaker [14] calculated the value of diversity at various spatial scales known as the diversity of the alpha, beta, and gamma dimensions to start the investigation of community structure. Currently, this method is still relevant and useful.
Additionally, Sattler [4] claim that taxonomic diversity, which is the diversity value computed based on abundance and species richness, is insufficient to explain the complexity of the arthropod community structure. The functional diversity of arthropod was also considered in some studies based on their functional categories in the environment [15-17]. Functional diversity is a term used to describe the diversityof organisms through their function in the ecosystem. Dominik [18] showed that the importance of functional diversity may accurately capture the close connection between organisms and processes in ecosystems. Studying the taxonomic and functional diversity of arthropods is thus important to fully
comprehend the organization of the arthropod community. Therefore, the objective of this study was to analyze the relationship between land cover heterogeneity and insecticide use with the taxonomic and functional diversity of arthropods on the alpha, beta, and gamma dimensions of riceagroecosystems in the Bandung region of West Java.
2. Methodology
2.1. Study Area
This study was conducted in several rice agroecosystems in Bandung City and Bandung Regency, WestJava, Indonesia, during the rainy season planting period (October 2021–March 2022). Four rice agroecosystem sites were selected for this study, i.e., paddy field A (located in the area of Resort Raya Street, Cimenyan District, Bandung Regency), paddy field B and paddy field C (both located in the area of Cigadung Wetan, Cibeunying Kaler District, Bandung City), and paddy field D (located in the area of Binong, Batununggal District, Bandung City). The relative position of the four sites is shown in Figure 1. The four sites are generally similar but differed in the heterogeneity of the land cover in the area bordering the edges of the paddy fields, the use of insecticides, and the age of the plants in each field, which was adjusted to the timeline of data collection. Because they are managed by different farmers, the four sites have different styles of land management. Table 1 illustrates the characteristics and types of management based on the results of interviews with farmers at each site. At each study site, data were gathered 30 and 50 days after planting (DAP).
Figure 1. Location of study sites within the City and District of Bandung, West Java.
| Parameters | Paddy field A | Paddy field B | Paddy field C | Paddy field D | |
| Land cover type | Trees, vegetable plantation, river | Trees, settlements, vegetable plantations, grass field | Trees, settlements, vegetable plantation | Settlements, river | |
| Paddy field area | 6.626 m2 | 6.905 m2 | 5.449 m2 | 8.550 m2 | |
| Pesticide use | Insecticide (Decis: Active ingredient Deltamethrin) | Herbicide, insecticide (Decis: Active ingredient Deltamethrin) | Herbicide | Insecticide (Diazinon) | |
| Intensity of insecticide use | 1 | 2 | 0 | 2 | |
| Concentration of insecticide use | 0,11 mL/m2 | 0,12 mL/m2 | \(0 \text{ mL/m}^2\) | 0,02 mL/m2 | |
| Location altitude | 837 – 847 masl | 747 – 759 masl | 750 – 756 masl | 676 – 678 masl | |
Table 1. Rice characteristics.
2.2. Arthropod Sampling
Arthropod samples were collected at 30 days after planting (DAP) when the rice plants were in the early vegetative phase, and at 50 DAP when they were in the late vegetative phase. Arthropods were sampled using active and passive methods [19]. The active method used direct retrieval using a sweeping net aimed to obtain arthropods around rice plants, conduct- ed by walking at a speed of 0.5 meters per second with 30 sweeping net swings on each plot measuring 10 x 10 meters [4]. In each rice agroecosystem, eight plots were determined randomly. The passive methods used in this study were the pitfall trap method aimed to obtain arthropods that live on the ground surface, and the malaise trap sampling method which aimed to obtain insects that tend to fly over rice plants. In each site, eight pitfall traps were installed randomly. Sampling with a malaise trap was conducted by installing a malaise trap at the midpoint of the paddy field for 24 hours over three nights to obtain three-time repetition data [20].
Arthropod samples obtained through the sweeping net method were killed using a killing jar and preserved [4, 21]. Samples from malaise traps were collected and preserved in bottles [20]. Pitfall trap samples were rinsed with running water and preserved. All samples were preserved in 70% alcohol and stored in bottles before identification based on location and time of collection [21]. The arthropod samples have been identified at the family taxonomic level using various literature sources and identification manuals [22-27]. Each family was documented, and samples were stored as specimens in bottles with preservative liquid for reference during the study. All samples and family specimens were disposed of after the research was completed.
2.3. Predictor Variable
2.3.1 Land cover heterogeneity
In this study, land cover heterogeneity is determined as the value of land cover diversity at a radius of 120 meters from the midpoint of the rice field. The land cover includes paddy field cover, vegetation-type cover, non-natural land cover types formed due to human activities, and water body cover types. The types and characteristics of the land cover used are described in Table 2.
| 1 71 | ||
|---|---|---|
| No. | Land cover types | Description |
| 1 | Paddy field | permanently irrigated paddy fields |
| 2 | Forest | principally trees, also shrubs, bushes, and storey |
| 3 | Fruit plantation | fruit trees, banana plantations, coconut trees, etc. |
| 4 | Vegetable plantation | cabbage, eggplant, pepper, etc. plantations |
| 5 | Grass | grass cover mainly for grazing |
| 6 | Other crops | agricultural areas not covered by types 1-5 |
| 7 | Water | lakes, rivers, and ponds |
| 8 | Bare soil | bare rock, sand, etc. |
| 9 | Compacted surface | unpaved roads compacted soil surface |
| 10 | Sealed surface | houses and other buildings, streets, etc. |
Table 2. Description of land cover types.
The land cover heterogeneity value was calculated using the Shannon-Wiener formula [4]. Land cover heterogeneity:
Shannon Wiener index (H') = Σ pi ln pi
The pi value is the percentage of land cover area compared to total land area. Measurements were carried out using the digital mapping method using high-quality satellite imagery data. Digital mapping was carried out using the latestsatellite imagery data (2021–2022) from Google Earth Pro, which was then processed using Quantum GIS (QGIS) software [28].
2.3.2 Insecticide Use
Information on the use of insecticides was obtained based on direct field observations and interviews with farmers in charge of managing the paddy fields. Insecticides were applied between 30 and 50 DAP. The value of insecticide use was determined by calculating the weight of the active ingredient (w) in each package using the formula below [10]:
\[w(g/m^2) = nAI \times vw \times c\]
The weight of the active ingredient is calculated based on the amount of active substance (nAI), the volume of insecticide used per 1 square meter (vw), and the concentration of the active substance (c).
2.3. DataAnalysis
Statistical analysis of data was carried out in the form of normality tests, significance tests with ANOVA, correlation tests with Pearson's correlation, and linear regression. The linear regression model was used to see the relationship between land cover heterogeneity and arthropod diversity, and insecticide use with arthropod diversity. The linear regression model uses a confidence value of 0.95. The multiple linear regression model was used to obtain the coefficient values of the multiple linear regression equation with two independent variables, namely land cover heterogeneity and insecticide use, while the independent variable was the value of arthropod diversity. Statistical analysis was performed with Paleontological Statistics (PAST) software and R studio for multiple linear regression models using the package 'lm' [4,10,18].
3. Result and Discussion
3.1. Arthropod Sampling Result
A total of 12,619 individuals of arthropods from 78 different families were found in four paddy field agroecosystems in Bandung, West Java. Ephydridae (3,351 individuals) and Acrididae (2,393 individuals) were the two families with the greatest number of individuals. Herbivorous arthropods accounted for 82.5% of the total arthropod community structure, while decomposers (0.4%) and indifferent arthropods (0.2%) had the lowest abundances. According to the total abundance value, there were more arthropods (7,922 individuals) at 50 DAP than at 30 DAP (4,697 individuals). The average values of the alpha and beta dimensions of arthropod diversity, as well as the gamma values obtained from this study, are shown in Table 3.
Table 3. Average values of the alpha, beta and gamma dimensions of arthropod diversity at four study sites.
| Location | Land cover heterogeneity (H) | Insecticide use (g/m²) | Taxonomy diversity | Functional diversity | ||||
| \(D\alpha\) | \(b_{\rm w}\) | Dγ | \[D\alpha\] | bw | \[\mathbf{D}\gamma\] | |||
| A 30 DAP | 1.30 | 2.75 x 10⁻³ | \(4.67 \pm 1.39\) | \[0.50\pm0.15\] | 7.52 | \(1.93 \pm 0.35\) | \[0.15\pm0.11\] | 2.10 |
| A 50 DAP | \[5.54 \pm 1.22\] | \[0.37 \pm 0.14\] | 7.66 | \[1.67\pm0.37\] | \[0.12\pm0.14\] | 1.70 | ||
| B 30 DAP | 1.50 | 5.95 x 10⁻³ | \[7.11 \pm 2.82\] | \[0.35 \pm 0.11\] | 8.65 | \[1.81 \pm 0.24\] | \[0.11\pm0.10\] | 1.86 |
| B 50 DAP | 1.58 | \(3.90 \pm 0.99\) | \[0.33 \pm 0.09\] | 5.53 | \[1.29 \pm 0.10\] | \[0.05\pm0.08\] | 1.27 | |
| C 30 DAP | 1.28 | 0 | \(8.12 \pm 1.71\) | \(0.40 \pm 0.14\) | 11.82 | \(2.10 \pm 0.25\) | \(0.14 \pm 0.11\) | 2.26 |
| C 50 DAP | \[6.78 \pm 2.08\] | \[0.32 \pm 0.07\] | 7.30 | \[1.90\pm0.48\] | \[0.05\pm0.08\] | 1.77 | ||
| D 30 DAP | 1.19 | 8 x 10⁻³ | \(1.71 \pm 1.34\) | \[0.93\pm0.26\] | 8.17 | \[1.19\pm0.84\] | \[0.73\pm0.37\] | 2.46 |
| D 50 DAP | \(4.09 \pm 1.53\) | \(0.66 \pm 0.23\) | 10.20 | \(1.76 \pm 0.33\) | \(0.08 \pm 0.15\) | 1.97 | ||
3.2. Land Cover Heterogeneity
According to the results shown in Table 3, the four paddy agroecosystems have various levels of land cover heterogeneity. From highest to lowest in terms of land cover heterogeneity, the rice agroecosystems showed the following sequence: Paddy field B (1.58), Paddy field A (1.30), Paddy field C
(1.28), and Paddy field D (1.19). The land cover heterogeneity mapping and values are shown in Figure 2. The results of correlation analysis using linear regression between arthropod taxonomic diversity on the alpha dimension (Dα) and land cover heterogeneity (H') is shown in Figures 3, 4, and 5.
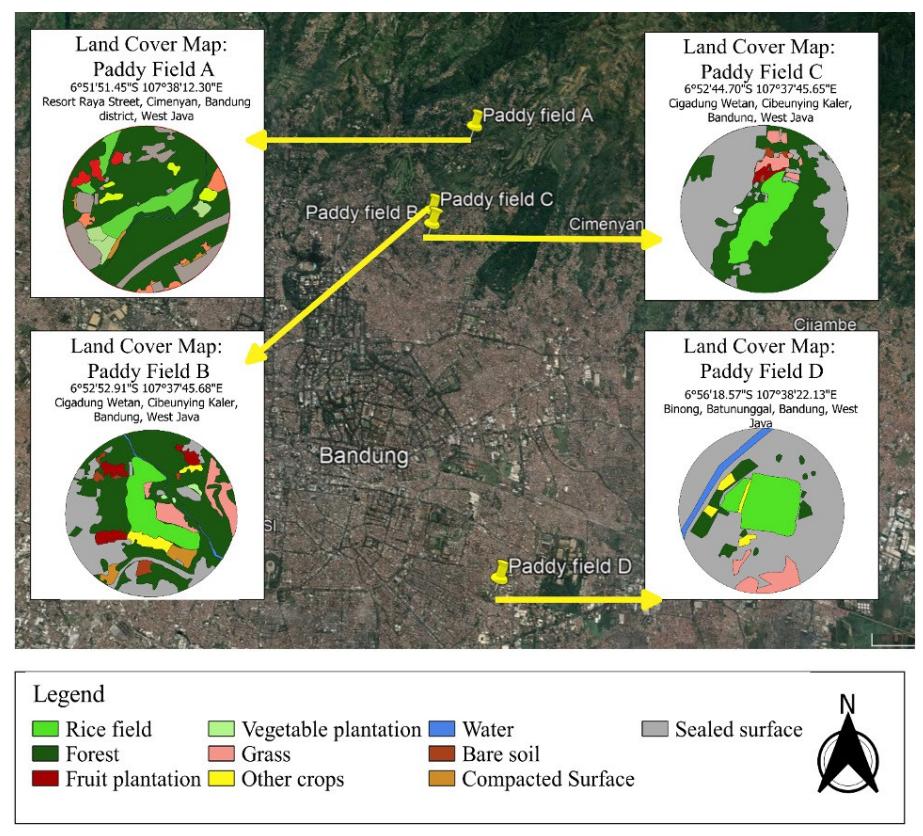
Figure 2. Land cover heterogeneity map of study sites.
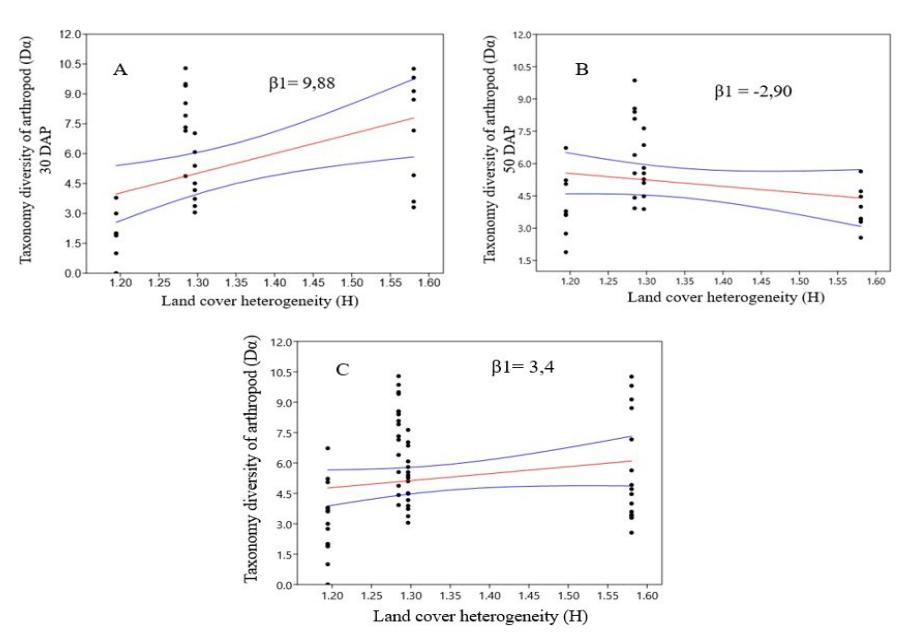
Figure 3. Correlation between land cover heterogeneity and arthropod taxonomic diversity on the alpha dimension at 30 DAP (A), 50 DAP (B), and 30 and 50 DAP data combined (C). The red line shows the linear regression, while the blue line shows the area with a 95% confidence index.
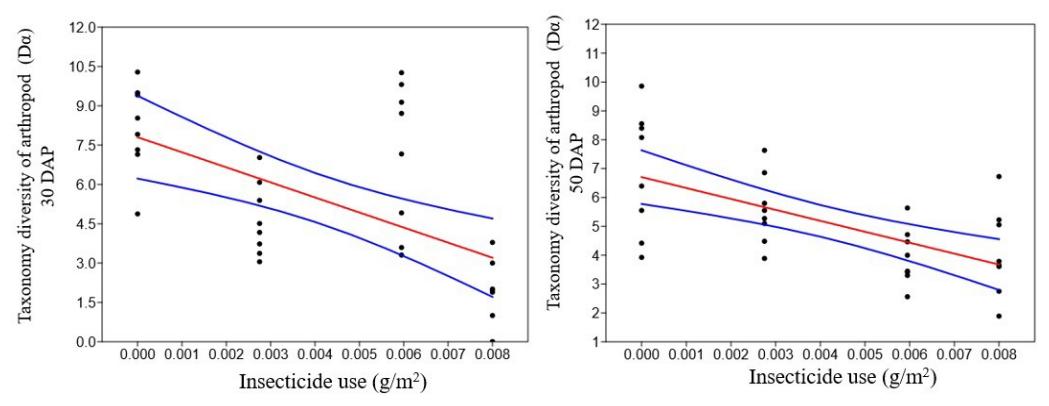
Figure 4. Correlation between insecticide use and arthropod taxonomic diversity at 30 DAP (A) and 50 DAP (B). The red line shows the linear regression, while the blue line shows the area with a 95% confidence index.
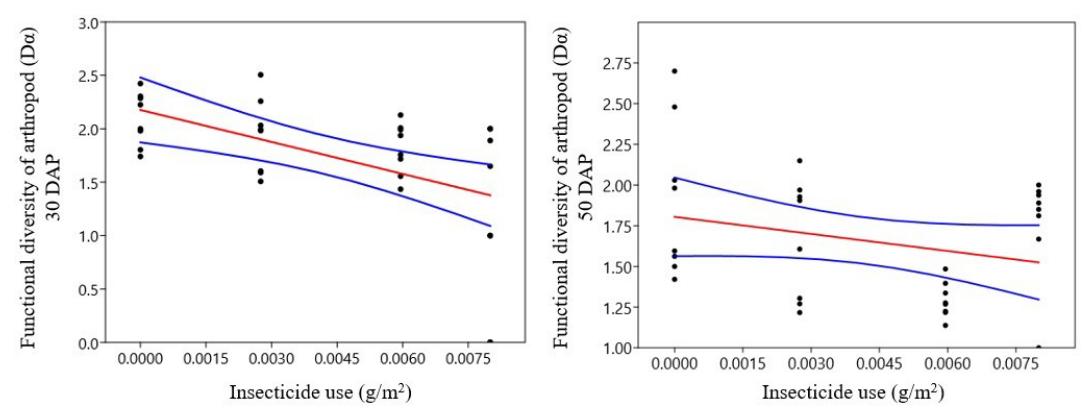
Figure 5. Correlation between insecticide use and arthropod functional diversity at 30 DAP (A) and 50 DAP (B). The red line shows the linear regression, while the blue line shows the area with a 95% confidence index.
At 30 DAP the gradient value (β1) of the linear regression equation between land cover heterogeneity and arthropod taxonomic diversity is 9.88. These findings suggest that the diversity of arthropod taxa is positively correlated with land cover heterogeneity. Nevertheless, a negative association between land cover heterogeneity and arthropod taxonomic diversity was found at 50 DAP, although it had a gradientvalue that was lower than 30 DAP, specifically -2.90. It is known that the linear regression model exhibits a positive correlation between land cover heterogeneity and arthropod taxonomic diversity with a gradient value of 3.4 when the data from the two sampling times are combined. This result suggests that, in general, the taxonomic diversity of arthropods tends to be positively correlated with land cover heterogeneity. Moreover, by Pearson correlation equation both 30 and 50 DAP have pvalue>0.005 which indicates a non-statistically significant correlation between heterogeneity and arthropod taxonomic diversity. Additionally, the trend of the correlation between land cover heterogeneity and arthropod functional diversity is similar to that of the correlation between arthropod taxonomic diversity and land cover heterogeneity, which is positive at 30 DAP (β1= 0.83) and negative at 50 DAP (β1= -1.40). However, a significant correlation (Pearson's correlation) was found between land cover heterogeneity and functional diversity at
50 DAP.
According to Pearson's correlation test, there was a fair amount of association between the taxonomic and functional diversity of arthropods (r = 0.69). This indicates that the patterns of the two variables exhibit the same tendency. As a result, in the analysis of arthropod diversity in beta and gamma dimensions, the relationship between land cover heterogeneity was only observed with the value of arthropod taxonomic diversity.
The value of the beta and gamma dimension of arthropod diversity is shown in Table 3. It can be observed that the value of arthropod diversity in the beta dimension (bw) in the range of 1.28 to 1.58 has a value that tends to be similar, however, in the lowest land cover heterogeneity (1.19), beta diversity tends to be higher than the others. The value of arthropod diversity in the gamma dimension (Dγ) tends to increase as land cover heterogeneity increases at 30 DAP. Although, at 50 DAP, the diversity of arthropods tended to decrease as land cover heterogeneity increased. These results are in line with the value of arthropod diversity in the alpha dimension.
3.3. Insecticide Use
The four rice agroecosystem sites in this study utilized different amounts of insecticides. Based on the calculation of the
weight of the insecticide active ingredient (w), the order of the highest value to the lowest is as follows: Paddy field D (0.008 g/m2 ), paddy field B (0.006 g/m2 ), paddy field A (0.003 g/m2 ), and paddy field C (0.00g/m2 ). Figures 5 and 6 show thatat 30 and 50 DAP, the correlation between insecticide use and arthropod taxonomic and functional diversity is negatively correlated, suggesting that the value of arthropod diversity tends to decrease the more insecticidal active ingredient is applied.
Table 3 shows the mean value of beta diversity of arthropods. Based on the study of Sattler [4] a beta diversity value below 1.54 is considered a low diversity value; which means that the arthropod composition tends to be similar in each local site. However, at the highest use of insecticides (0.008g/ m2 ), the beta dimension of arthropod diversity values tends to be higher than in other paddy fields. The paddy fields with the highest use of insecticides are paddy field D. Paddy fieldD is a paddy field with the lowest land cover heterogeneity and the highest use of insecticides. The difference in beta diversity values in paddy D compared to other locations is thought to be related to the abundance of arthropods in paddy D, which is much lower than in other paddy fields (Table 2).According to Marathe [13], at locations with the same amount of species richness but different abundances, locations with lower abundances tend to have higher beta diversity values.
3.4. Discussion
The results of this study are consistent with several studies [4,18] that found that arthropod diversity in rice agroecosystems tends to be positively correlated with land cover heterogeneity. In addition, this study supports some studies [4, 6, 29, 30] that found a negative relationship between arthropod diversity in rice agroecosystems and insecticide use. According to a study by Sattler [4] conducted in Vietnam during the dry season, the insecticide use variable had a larger impacton the structure of the arthropod community than the land cover heterogeneity variable. This study attempts to understand how these two variables affect the arthropod community structure during the rainy season in Bandung, West Java, Indonesia. The analysis of multiple linear regression equations between land cover heterogeneity and insecticide use with arthropod diversity is shown in Table 4.
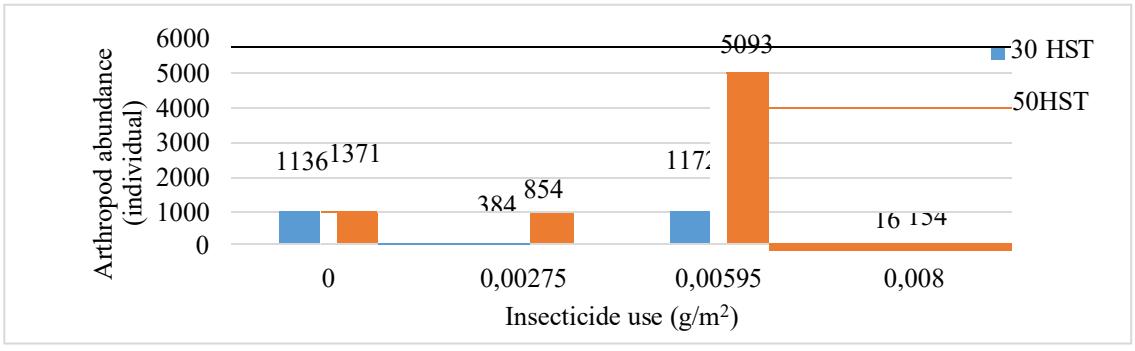
Figure 6. Association of insecticide use and arthropod abundance.
Table 4. The result of multiple linear regression between land cover heterogeneity and insecticide use with arthropod diversity
| Variable | Respond variable | Coefficient value | p-value |
|---|---|---|---|
| Land seven between sensity | Taxonomy Alpha diversity | 4.42 | 0.014** |
| Land cover heterogeneity | Functional Alpha diversity | 0.15 | 0.08 |
| Insecticide use | Taxonomy Alpha diversity | -496.19* | 1.39 x 10⁻⁷** |
| Functional Alpha diversity | -66.72* | 7.78 x 10⁻⁴** |
Based on the analysis of multiple linear regression equations, the coefficient value of the insecticide use variable on the taxonomic diversity and functional diversity of arthropods shows a higher number than the coefficient on the land cover heterogeneity variable. These results indicate that during the rainy season in the Bandung area, the use of insecticides
has a greater influence on the characteristics of the arthropod community structure than the heterogeneity of land cover. As a result, this study supports the statement that the use of insecticides is one of the factors that have a major impact on the structure of the arthropod community, both in the dry season and the rainy season. High-intensity rainfall that occurs
shortly after insecticide application can cause insecticides to be lost to non-target sites through surface runoff and leaching. This can result in less insecticide being available in the soil for plant uptake, which may not be sufficient to kill the target organisms. Consequently, the value of arthropod diversity in the rice ecosystem may decrease, as evidenced primarily by a decline in arthropod functional diversity. The decline in arthropod diversity, particularly among predators and parasitoids, leads to an increase in herbivorous arthropods that can negatively impact rice fields. This poses a threat to the success and sustainability of rice agroecosystems [31].
According to a study by Heong [8], in Asian countries including Indonesia, there is a misuse of insecticides, which results in the ineffective use of insecticides and the emergence of various environmental problems. Some common ways insecticides are misused include inaccuracies in determining the type of insecticide, the concentration of the insecticide used, and the time of application of the insecticide. In this study, the types of active ingredients used by farmers were deltamethrin and diazinon. Both of these active ingredients are included in broad-spectrum insecticides, which are not recommended because they can have negative effects on non-target organisms [32-34]. Even though the amount of insecticide used is far from a lethal dose for high-level organisms, continuous exposure to insecticides causes accumulation in organisms and causes biomagnification effects that are harmful to all organisms in the ecosystem [8, 35].
The incompatibility of insecticide concentrations with the characteristics of the arthropod community structure is another issue that frequently arises when using insecticides. The findings of this study concur with those of Ali [36], who found that controlling arthropod pest populations by boosting insecticide concentrations is often not effective. Due to the loss of controlling arthropods, the increase in improper insecticide concentrations causes an explosion in the population of pest arthropods.
Another crucial element in the application of pesticides is the time of the spraying. Insecticide should not be applied to rice plants during the vegetative phase, which is the rice age range of 20-44 DAP [8]. However, in this study, pesticides were sprayed in the range of 20-50 DAP. The vulnerability of parasitoids and predatory arthropods in groups is increased when insecticides are applied to rice plants during their vegetative phase. This study showed that the abundance of herbivorous arthropods tended to be better under control in paddy fields without insecticides than in paddy fields withinsecticides. The study by Ali [36] found that the natural control provided by the natural enemies of herbivorous arthropods is sufficient to avoid outbreaks of these insects in a relatively small rice agroecosystem, negating the need for insecticide use.
In this study, an explosion in herbivorous arthropod populations was observed with the use of an insecticide active ingredient of 0.06 g/m2 , in paddy B. In the late vegetative phase (50 DAP), 79% of paddy B arthropods were herbivorearthropod, which had the potential to become pests of rice plants. Meanwhile, the abundance of controlling arthropods such as predators (18%) and parasitoids (3%) is much lower. Herbivore arthropods that experienced a relatively high increase in abundance between 30 and 50 DAP are the families Ephydridae (2,257 individuals), Erebidae (712 individuals),Cicadellidae (411 individuals), and Acrididae (281 individuals).
The family Ephydridae (Order: Diptera) is known as the rice whorl maggot. The larvae of this group of arthropods attack rice plants by making holes in the stems and leaves; they use the mesophyll tissue as a nutrient source and refuge. The life span of the Ephydridae family from egg to adult is generally 25–28 days. The relatively short life span, the low exposure to insecticides in larva stage, and the reduced abundance of predators due to insecticides are thought to be closely related to the increase in the arthropod population [37]. Similar to Ephydridae, the Erebidae family (Order: Lepidoptera) attacks rice plants in the larval stage. According to Kurmi [38], the Erebidae family is one of the predominant families commonly found in rice agroecosystems, so it is common to find themin high numbers in a rice agroecosystem. The existence of these two families threatens the growth of rice plants. The plants will tend to be stunted, delays in the early reproductive and seed maturation phases [39].
Acrididae is one of the families with the highest abundance based on the results of this study. Both the Acrididae and Cicadellidae families are arthropods that attack directly by consuming nutrients from rice plants and causing rice plants to become unproductive. In addition, arthropods in the Acrididae and Cicadellidae families act as vectors for fungal, bacterial, and viral diseases, i.e., Nephotettix sp., which causes turgor disease, which is harmful to rice plants [39].
In contrast, the usage of insecticides in this study threatens the families of predatory arthropods Formicidae and Miridae in danger. Both are capable of managing herbivorous arthropods that may harm rice plants by functioning as broad-range predators. Nevertheless, predatory arthropods from both groups are more vulnerable to insecticide usage than arthropods that feed on plants [39]. As a result, adjusting the application of insecticide to the specific arthropod pest is the most effective strategy for preventing pest attacks on the rice agroecosystem. Information on their abundance and the severity of the harm they cause is used to identify pest arthropods in agroecosystems.
The heterogeneity of land cover in each rice agroecosystem is one of several environmental factors that must be taken into account when adjusting the timing of application and the dose of insecticides used. In order to model arthropod population patterns and to develop preventive measures that can maintain the sustainability of rice agroecosystems, including the use of ecological engineering, further studies andresearch
involving modelling the dynamics of the arthropod community structure are required.
4. Conclusion
In general, the more diverse the land cover of the border zone in the rice agroecosystem, the more complex the arthropod community structure formed, which is characterized by higher taxonomic and functional diversity values, particularly during the early vegetative phase of rice plants (30HST). In contrast, the greater the use of insecticides, the less diverse the arthropod community. Moreover, there are indications that during the rainy season, the use of insecticides has a greater influence on the structure of the arthropod community than land cover heterogeneity, which is similar to the results of a study by Sattler [4, 10] in the dry season in Vietnam.
Acknowledgement
The authors acknowledge the support from farmers of rice agroecosystems in Bandung who have allowed us to use their fields as research sites. Furthermore, we would like to thank the School of Life Sciences and Technology at Institut Teknologi Bandung for supporting the fieldwork activities