
1. Introduction
Common beans (Phaseolus vulgaris L., hereafter simply abbreviated as P. vulgaris) is a plant that offers various benefits to the human body. They are known to contain 34 calories, 7,2 g carbohydrates, 2,4 g protein, 0,3 g fat, 1,9 g fiber, 42 mg phosphorus, 101 mg calcium, 0,7 mg iron, 250 mg potassium, 8 mg sodium, 11 mg vitamin C, and 89,6 g water in every 100 grams [1]. Consumption of common bean pods is also known to reduce the risk of obesity and diabetes, control diabetes, reduce the risk of coronary heart disease and colon cancer, act as a source of dietary fiber, improve gastrointestinal response, prolong the existence of lipoproteinsto reduce bad cholesterol levels in the body and prevent breast cancer [2].
Common beans are a vegetable commodity that requires production development. High common bean production can align with the improvement of nutrition in the community. Common beans are classified as nutritious functional foods
because they contain various bioactive compounds that benefit health. These bioactive compounds include polyphenols, anthocyanins, condensed tannins, and flavonoids in the form of quercetin, providing high antioxidant capacity [3]. One of the efforts that can be made in developing common bean production is by increasing its productivity to broaden its economic prospects and attract farmers to plant common beans.
Efforts to boost common bean productivity include the application of ascorbic acid. Research shows that spraying ascorbic acid concentrations of 200 mg/Land 400 mg/L on the plant's shoot can increase productivity, antioxidant activity, and secondary metabolites under water-stress conditions [4]. Geeth and Abdel-Aziz also discovered that the application of 200 mg/L of ascorbic acid to common beans can enhance the chemical composition of leaves and pods, resulting in an increased yield [5]. Additionally, Hayat et al. found that the application of 1.5 mM ascorbic acid could improve common bean productivity under drought-stress conditions [6]. Another effort that can be made to increase common bean productivity is through the application of fertilizers, both synthetic and organic. Organic fertilizers are considered to have a more sustainable effect on the ecosystem compared to synthetic fertilizers. These fertilizers can be solids or liquids, including liquid organic fertilizers such as compost tea. Compost tea is made by soaking bags of solid fertilizer in water to obtain liquid extract rich in nutrients, organic compounds, and beneficial microbes [7]. Ibrahim et al. revealed that compost tea treatment of common beans could increase their productivity through the biostimulation effect provided by compost tea [8]. Another potential of compost tea has also been shown to suppress damping-off disease caused by Rhizoctonia solani on common bean plant sprouts [9]. Additionally, compost tea made from cow and chicken manure is also able to act as a disease-control agent in soybean plants [10].
This study aims to determine the effect of compost tea and ascorbic acid and the effectiveness of their combination on the productivity and antioxidant activity of upright common bean (P. vulgaris), building on previous explanations.
2. Methodology
2.1 Time and Place
The cultivation phase took place during January-March 2023 in Parongpong, West Bandung Region, West Java, specifically at the coordinates -6° 49' 50.196" for latitude, and 107° 35' 21.5946" for longitude. Laboratory examinations and data processing transpired at Engineering Laboratory 1A, within the Jatinangor Campus of Bandung Institute of Technology.
2.2 Research Design
The research wasstructured using a Randomized Complete Block Design (RCBD), encompassing six distinct treatments and four replications as delineated below. The seed variety used was GYPSY-1 upright common bean (P. vulgaris).
P1: Control (water spraying)
P2: Ascorbic acid (AsA)
P3: Manure compost tea (MCT)
P4: BSF larvae production residue / BSFR compost tea (BCT)
P5: Manure compost tea + ascorbic acid (MCT + AsA)
P6: BSFR + ascorbic acid (BCT + AsA).
2.3 Cultivation Procedure
The cultivation procedures adhered to the standard operational procedure (SOP) for common bean cultivation fromThe Ministry ofAgriculture Indonesia [11]. Thisincluded the use of a drip irrigation system for watering, weeding at 30-40 days after sowing (DAS) to remove interfering weeds, and treatments applied through spraying on the plant shoot area/foliar spray using a hand sprayer. Treatments were administered every seven days, commencing at 17 DAS when the first trifoliate leaves had fully developed. The compost tea fertilizer was applied with a concentration of 50% (fertilizer: water = 1:1, v/v), while the ascorbic acid treatment utilized a concentration of 400 mg/L. Spraying was conducted to cover 70% of the plant shoot area, in the morning at 08:00 - 10:00 AM. Common beans were harvested three times after reaching 51 DAS, and harvest data were meticulously collected.
2.4 Compost Tea Preparation
Compost tea preparation involves placing solid fertilizer material into a gauze bag or other porous fabric to act as a filter. This bag was then immersed in a barrel filled with water and an aerator pump. The ratio of solid fertilizer to water was maintained at 1:4 v/v, with the addition of 2.5 ml of molasses. This mixture was left to soak for three days to dissolve the nutrients, while the aerator pump continuously agitated it and occasional stirring was performed. The successful compost tea solution was identified by its earthy scent and readiness for application.
2.5 Measurement and Data Collection
2.5.1 Plant Height, Leaf Count, and Leaf Area
Plant height was measured using a cloth meter, leaf count was manually recorded on fully developed leaves, and leaf area was assessed through digital image analysis. Leaves were photographed, and their area was calculated by measuring pixel units in the IMAGE-J application.
2.5.2 Yield and Productivity
Yield parameters included pod wet and dry weights, pod organic and ash content, number of pods, pod length, pod diameter, and weight per pod, all measured with an analytical balance. Dry weight was obtained by drying 100 g samples in an oven for 24 hours at 105°C. Organic and ash (mineral) content were determined via dry ashing. Initially, 0.5 g of dry sample in a crucible was placed in a furnace at 550-600°C for 3-4 hours. The results of ashing were then weighed with an analytical balance following this formula:
\[Ash\ Content = \frac{ash\ weight}{dry\ sample\ weight} \times 100\%\]
\[Organic\ Content = 100\% - ash\ content\]
The values for each parameter were averaged based on the treatment provided. Productivity was calculated by multiplying the production per plant by the number of plants per hectare at a density of 9,6 planting holes/m2 (referring to the research design). The number of plants per hectare was determined using a simplified approach based on a 10 m x 10 m plot, which was then extrapolated to a one-hectare land area. It was assumed that the 10 m x 10 m plot contained seven beds measuring 1 m x 10 m, with a spacing of 0,4 m between beds, resulting in a planted land area of 7.000 m2 . Productivity was computed using the formula:
Productivity = pod weight per plant × number of plants per 2 × planted area per hectare
2.6 Antioxidant Activity Test
Antioxidant activity testing was performed using the DPPH (1,1-Diphenyl-2-Picryl Hydrazyl) method, following the procedure by Nugrahani et al. [12] with slight modifications. Methanol extract from common bean pods was used as the test material.
2.6.1 Methanol Extraction of the Test Sample
A fine powder of common bean pods weighing 25 grams was extracted with 250 ml of methanol solvent pro analysis (PA) by maceration for 48 hours. The maceration results were then vacuum distilled and concentrated with a rotary evaporator at 65°C and 426 millibar pressure until a thick extract was obtained.
2.6.2 Preparation of DPPH Solution
A DPPH 0.5 mM stock solution was prepared by weighing 20 mg of DPPH, which was then dissolved in 100 ml of methanol PA in a 500 ml dark bottle and stored at 2-8°C. The determination of DPPH absorbance was carried out by preparing a blank solution, adding 1 ml of DPPH to 4 ml of PA methanol solution, allowing it to sit for 30 minutes in a dark place, and then measuring the absorbance with a spectrophotometer at a wavelength of 517 nm.
2.6.3 Preparation of Test Solution
A secondary standard solution was prepared by dissolving common bean extract and methanol solvent with a precise weight ratio of extract (mg) to methanol (ml) at 1:1 proportion, and thissolution was placed within a dark bottle. Subsequently, serial solutions were created through dilution of the secondary standard solution to attain concentrations of 10 ppm, 20 ppm, 40 ppm, 60 ppm, 80 ppm, and 100 ppm, each comprising 2 ml. Meanwhile, for comparative purposes, a solution of ascorbic acid (vitamin C) was prepared at various concentrations (10 ppm, 20 ppm, 30 ppm, 40 ppm, 50 ppm, and 60 ppm), each in the volume of 2 ml. In the testing process, each test solution was supplemented with 1 ml of DPPH and allowed to incubate in darkness for 30 minutes. Following this incubation, the absorbance of each solution series was meticulously measured utilizing a spectrophotometer, with a specific focus on the wavelength of 517 nm. Once the absorbance values were acquired, the antioxidant activity of the methanol extract of common bean was determined by evaluating the percentage inhibition of the extract against DPPH free radicals, employing the formula:
% Inhibition = \[(1 - \frac{A_{sample}}{A_{blank}}) \times 100\]
Here:
A blank = absorbance of the blank uptake
A sample = absorbance of the sample uptake
Calculation of the IC50 value, indicating the concentration needed to reduce 50% of the DPPH radical activity, was accomplished through a linear regression equation y = a + bx, where the y coefficient denotes % inhibition and the x coefficient signifies the IC50 value.
2.7 Data Analysis
The acquired data underwent thorough analysis using IBM SPSS Statistics software. The chosen statistical test was a oneway ANOVA, conducted with a 95% confidence level and a significance threshold of α = 0,05. In the event of significant outcomes, further analyses were undertaken employingthe Duncan Multiple Range Test (DMRT) to explore the differences among treatment groups.
3. Results and Discussion
3.1 Nutrient Content Analysis of Compost Tea
Laboratory analysis conducted by the Lembang Agro Chemistry Laboratory on liquid organic fertilizer, including manure compost tea (MCT) and BSFR compost tea (BCT), revealed that, in general, neither of these compost teas (CTs) met the established quality standards. While the pH levels of both CTs were within the acceptable range as per the standards, other parameters yielded conflicting results. These parameters include C-Organic, macronutrients N, P, and K, C/N ratio, as well as micronutrients Fe, Cu, and Zn (Table 1).
Several factors influence the quality of CT, includingthe ratio of solid compost to water, the type of compostused, and aeration, which supports the growth of beneficial microorganisms [14]. It is crucial to consider the maturity index of solid compost before using it for compost tea, taking into account parameters like C/N ratio, pH, and EC (Electric Conductivity) [15]. The low nutrient content observed in MCT and BCT can be attributed to the initial compost substrate's immaturity, resulting in limited nutrient solubility. Immature compost failsto fully decompose organic matter into inorganic forms, affecting CT quality. However, CT contains a wealth of beneficial microbes, including actinomycetes, oomycetes, yeasts, filamentous fungi, and bacteria, which are abundant and classified as Plant Growth Promoting Rhizobacteria (PGPR).
PGPR plays a significant role in enhancing plant growth by facilitating nutrient solubilization, the release of growth hormones and enzymes, and nitrogen fixation. Additionally, CT contains humic acid and growth regulators, and the combination of these components can effectively suppress plant diseases [14]. Previous research has explored the utility of CT as a pathogen inhibitor for legume plants, demonstrating its potential as a biological control agent against damping off disease and other soil-borne diseases, while also promoting crop growth in common bean [9].
3.2 Growth of Plant Height, Number of Leaves, and Leaf Area
Common bean exhibit various phenological phases throughout their life cycle, characterized by the development of distinct plant organs. These phenological phases include V1 emergence, V2 primary leaves, V3 first trifoliate leaf, V4 third trifoliate leaf, R5 preflowering, R6 flowering, R7 formation of pods, R8 filling of pods, and R9 maturation [16].
3.2.1 Plant Height
Plant height growth demonstrates a significantly different response, as indicated by the results of the DMRT statistical test (p ≤ 0,05) conducted between 23 and 35 days after sowing (DAS). The most significant increase in height occurred with treatment P3 at the end of the V3, V4, and R5 phases, measuring 32,74 ± 2,92 cm, 48,71 ± 4,82 cm, and 51,41 ± 4,81 cm, respectively. Conversely, treatment P2 resulted in the lowest height at the end of phase V3, measuring 26,24 ± 2,33 cm, which was not significantly different from treatments P5 and P6. Meanwhile, at the end of phases V4 and R5, the lowest effect was observed with treatment P6, yielding an average height of 40,17 ± 3,45 cm and 43,16 ± 3,99 cm, respectively. This analysis indicates that treatment P3 was the most effective in promoting common bean plant height growth during each growth phase compared to control (P1). Conversely, the combination of MCT and BCT with AsA exhibited a lesser effect so the combination did not significantly enhance plant height growth and tended to interact antagonistically with each other (Table 2).
Beneficial microbes in compost tea play a crucial role in supporting plant height growth. According to Samet etal.'s research on bacteria in CT, they revealed that Serratia liquefaciens and Achromobacter spanius bacteria can act as plant growth-promoting rhizobacteria (PGPR) capable of producing the hormone auxin (indole acetic acid, IAA) [17]. Therefore, there is a tendency for the MCT treatment to be the
Table 1. Laboratory analysis results for manure compost tea and BSFR compost tea
| No | Parameter | Units | MCT | BCT | Standard* |
|---|---|---|---|---|---|
| 1 | pH | - | 7,1 | 6,75 | 4 - 9 |
| 2 | C organic | % | 0,26 | 0,13 | Minimun 10 |
| Macronutrient | |||||
| 3 | N total | % | 0,06 | 0,05 | |
| 4 | P2O5 | % | 0,07 | 0,02 | % total NPK = |
| 5 | K2O | % | 0,14 | 0,08 | 2 - 5 |
| 6 | C/N | - | 4,33 | 2,6 | 12-15** |
| 7 | Ca | % | 0,02 | 0,02 | - |
| 8 | Mg | % | 0,01 | 0,002 | - |
| Micronutrient | |||||
| 9 | Fe | ppm | 14,2 | 0 | 90 – 900 |
| 10 | Cu | ppm | 6,6 | 0 | 25 – 500 |
| 11 | Zn | ppm | 3,6 | 1,2 | 25 – 500 |
*) Decree of the Minister of Agriculture of the Republic of Indonesia No 261/KPTS/SR.310/M/4/2019;
**) Mansyur et al. [13].
Table 2. Plant height observations at 17 - 35 DAS.
| Day After Sowing (cm) | ||||||||
|---|---|---|---|---|---|---|---|---|
| Treatment | V3 | V4 | R5 | |||||
| 17 | 20 | 23 | 26 | 29 | 32 | 35 | ||
| P1 | 12,09 ± 0,91 a | 15,89 ± 1,33 a | 21,78 ± 1,72 a | 29,51 ± 2,89 ab | 37,69 ± 3,50 a | 46,07 ± 4,11 bc | 49,46 ± 4,74 bc | |
| P2 | 10,94 ± 0,47 a | 15,23 ± 1,45 a | 20,48 ± 1,75 a | 26,24 ± 2,33 a | 35,69 ± 3,53 a | 43,51 ± 4,12 ab | 46,79 ± 4,45 ab | |
| P3 | 12,57 ± 1,03 a | 16,57 ± 0,98 a | 24,39 ± 1,96 b | 32,74 ± 2,92 b | 41,83 ± 4,03 b | 48,71 ± 4,82 c | 51,41 ± 4,81 c | |
| P4 | 12,11 ± 1,19 a | 16,79 ± 1,44 a | 22,70 ± 1,86 ab | 29,32 ± 2,40 ab | 38,30 ± 3,35 a | 44,14 ± 4,36 ab | 47,36 ± 4,48 abc | |
| P5 | 11,44 ± 0,53 a | 15,32 ± 1,06 a | 21,15 ± 1,70 a | 27,63 ± 2,43 a | 38,25 ± 3,65 a | 43,04 ± 4,24 ab | 46,19 ± 4,13 ab | |
| P6 | 11,78 ± 0,74 a | 15,55 ± 1,45 a | 22,18 ± 1,57 ab | 28,44 ± 2,76 a | 35,14 ± 2,93 a | 40,17 ± 3,45 a | 43,16 ± 3,99 a | |
Notes: Numbers accompanied by the same letter in the same column show no significant difference in the 5% DMRT test.
most effective treatment for plant height growth parameters because it contains PGPR bacteria.
3.2.2 Number of Leaves
In general, the treatments administered had a significant impact on increasing the number of leaves, as indicated by the results of the DMRT statistical test (p ≤ 0,05). Treatment P3 had the highest increase in leaf count, reaching 10,06 ± 0,63 leaves at the end of phase V3, which was significantly different from the other treatments. During phase V4, the highest leaf count increase was observed with treatment P5, at 21,13 ± 1,88 leaves, not significantly different from P3. Similarly, during phase R5, treatment P3 yielded the highest leaf count increase at 23,88 ± 2,05 leaves, significantly different from the other treatments. Conversely, the lowest leaf count growthresponse at the end of phases V3, V4, and R5 was recorded with treatment P6, at 7,63 ± 0,43 leaves, 17,94 ± 1,49 leaves (not significantly different from P1), and 20,19 ± 1,84 leaves, respectively. The analysis demonstrated that treatment P3 remained superior, while the P6 treatment showed an inverse effect. This suggests that the combination of AsA and BCT
has not been effective due to a lower response, possiblydue to potential antagonistic interactions between these two components (Table 3).
The combination treatment of AsA and CT leads to excessive water accumulation in leaf organs, resulting in overly wet leaves that inhibit the evapotranspiration process. This condition induces stress in plants, causing wilting and, consequently, reduced plant growth yield [18]. A similar scenario can be observed in plant height growth, where data obtained from the combination of AsA and CT is notably lower, influenced not only by the antagonistic interaction between the two components. Other findings were reported in Ibrahim et al.'s research concerning the application ofCT on common beans. The application at varying levels had a substantial impact on the number of leaves per plantat various locations. Specifically, the application of 100 L/ha resulted in significantly higher leaf counts than the 50 L/ ha treatment and notably surpassed the control treatment [8]. The data suggested that as the dosage of compost tea fertilizer increased, there was a tendency for an enhanced response in terms of an increased number of leaves.
Table 3. Number of leaves observation at 17 - 35 DAS
| Day After Sowing (blade) | |||||||
|---|---|---|---|---|---|---|---|
| Treatment | V3 | V4 | R5 | ||||
| 17 | 20 | 23 | 26 | 29 | 32 | 35 | |
| P1 | 1,44 ± 0,13 c | 3,56 ± 0,13 ab | 6,75 ± 0,50 a | 9,00 ± 0,54 c | 12,81 ± 0,97 ab | 17,88 ± 0,66 a | 20,44 ± 1,43 ab |
| P2 | 1,44 ± 0,13 c | 3,25 ± 0,20 a | 6,25 ± 0,35 a | 7,94 ± 0,38 ab | 11,50 ± 1,06 a | 20,06 ± 1,51 ab | 23,00 ± 2,07 abc |
| P3 | 1,81 ± 0,13 d | 4,69 ± 0,24 c | 7,69 ± 0,63 b | 10,06 ± 0,63 d | 14,88 ± 0,75 c | 20,56 ± 1,72 b | 23,88 ± 2,05 c |
| P4 | 2,19 ± 0,13 e | 4,88 ± 0,32 c | 7,88 ± 0,43 b | 9,56 ± 0,55 cd | 13,94 ± 1,14 bc | 20,13 ± 1,65 ab | 23,38 ± 1,93 bc |
| P5 | 1,25 ± 0,00 b | 3,69 ± 0,24 b | 6,69 ± 0,52 a | 8,75 ± 0,61 bc | 14,81 ± 1,40 c | 21,13 ± 1,88 b | 23,13 ± 1,74 abc |
| P6 | 0,81 ± 0,13 a | 3,25 ± 0,29 a | 6,25 ± 0,29 a | 7,63 ± 0,43 a | 12,38 ± 0,83 a | 17,94 ± 1,49 a | 20,19 ± 1,84 a |
Notes: Numbers accompanied by the same letter in the same column show no significant difference in the 5% DMRT test.
3.2.3 Leaf Area
The highest average leaf area response at the end of phase V3 was achieved with treatment P1, measuring 103.03 ± 9.37 cm², not significantly different from treatment P4. At the end of phases V4 and R5, the highest average response was observed with treatment P4, measuring 155.12 ± 15.10 cm² and 157.51 ± 14.94 cm², respectively, but not significantly different from P1. Overall, the application of MCT, BCT, AsA, and their combination did not yield a notably better effect on leaf area than the control (Table 4).
Leaf area growth is influenced by nutrients, the environment, and growth hormones. In general, the combination of CT treatment with separately applied AsA resulted in lower data analysis results compared to treatments without the combination. This may be attributed to the high concentration of AsA at 400 mg/L, which tends to disrupt the stability of the 50% concentration CT, rendering it less effective. AsA plays a crucial role as an antibacterial agent, and at certain concentrations, it can diminish the effectiveness of compost tea. AsA exhibits strong inhibitory effects against various microorganisms, including Staphylococcus aureus, Enterococcus faecalis, Helicobacter pylori, Campylobacter jejuni, Mycobacterium tuberculosis, and even fungi like Aspergillus [19]. Furthermore, it has been demonstrated to enhance the antibacterial activity of clindamycin, enabling it to inhibit Streptococcus pneumoniae [20]. AsA also serves as a sterilizing agent in explant preparation for tissue culture processes [21]. These attributes give rise to the potential for antagonistic interactions with CT.
Table 4. Leaf area observation at 17 - 35 DAS
| Day After Sowing (cm2 ) | |||||||
|---|---|---|---|---|---|---|---|
| Treatment | V3 | V4 | R5 | ||||
| 17 | 20 | 23 | 26 | 29 | 32 | 35 | |
| P1 | 11,63 ± 2,98 a | 27,18 ± 7,44 a | 74,26 ± 3,35 b | 103,03 ± 9,37 c | 127,40 ± 7,36 c | 153,97 ± 8,99 c | 156,77 ± 8,44 c |
| P2 | 11,60 ± 3,12 a | 36,32 ± 10,15 a | 72,61 ± 3,43 b | 98,01 ± 7,98 bc | 120,28 ± 10,63 bc | 144,12 ± 10,74 bc | 146,04 ± 10,74 bc |
| P3 | 6,71 ± 1,94 a | 24,79 ± 7,17 a | 62,37 ± 4,35 a | 89,94 ± 2,56 ab | 117,18 ± 11,13 bc | 144,58 ± 14,25 bc | 147,17 ± 14,04 bc |
| P4 | 9,36 ± 2,38 a | 32,98 ± 8,21 a | 73,57 ± 6,36 b | 102,74 ± 8,88 c | 127,94 ± 10,16 c | 155,12 ± 15,10 c | 157,51 ± 14,94 c |
| P5 | 9,87 ± 2,52 a | 34,36 ± 9,56 a | 70,33 ± 3,43 b | 95,67 ± 3,81 bc | 113,08 ± 9,45 ab | 134,46 ± 13,35 ab | 136,68 ± 8,00 ab |
| P6 | 7,45 ± 2,14 a | 24,82 ± 6,69 a | 58,06 ± 4,08 a | 82,18 ± 7,63 a | 102,80 ± 9,45 a | 125,17 ± 6,77 a | 127,47 ± 12,22 a |
Notes: Numbers accompanied by the same letter in the same column show no significant difference in the 5% DMRT test.
3.3 Yield
Yield parameters included wet and dry weights of pods, pod organic and ash content, number of pods, pod length, pod diameter, and weight per pod.
3.3.1 Pod wet and dry weights, organic and ash content Treatment P2 yielded the highest average wet weight of common bean pods at 483,80 ± 39,043 grams, significantly different from the other treatments. Conversely, the lowest response was observed with treatment P4, producing pods with a wet weight of 373,05 ± 37,880 grams. Data analysis indicated that treatment P2 effectively increased pod wet weight production by 19,02% compared to treatment P1, followed by an increase of 9,2% with treatment P5, and 3,96% with treatment P3, while treatment P4 showed no significant difference from the control. Treatment P6 produced the lowest response, with wet weight production 3,89% lower than treatment P1. However, the response of common bean pod dry weight did not exhibit significant differences among treatments, suggesting that none of the treatments significantly increased pod dry weight yields (Table 5).
The application of AsA, in common beans serves essential functions such as maintaining several metabolic processes under stress conditions. AsA acts as a non-enzymatic antioxidant compound, serving as an electron donor to reduce the accumulation of reactive oxygen species (ROS) and as a substrate in enzymatic processes. The addition of 400 mg/L AsA has been demonstrated to increase the yield of common bean (P. vulgaris) [4]. As an antioxidant, AsA aids in enhancing plant growth and yield by acting as a secondary nutrient or micronutrient.AsAplays a pivotal role in regulating plant growth, including processes like cell elongation and division, and bolstering the plant's immune system against
environmental stressors [22].
The analysis of the average organic content of common bean pods showed no significant differences between treatments, indicating that each treatment failed to increase the organic content of common bean pods. In contrast, the average ash content of common bean pods showed significantvariation among treatments (p ≤ 0,05). Treatment P5 had the highest average ash content at 3,274 ± 0,425 grams, whilethe lowest ash content was observed in treatment P4. The combined treatment of ascorbic acid and compost tea led to increased ash content in common bean pods compared to treatments without this combination. Treatment P5 exhibited a 45,31% increase over P1, followed by treatment P2 with a 38,62% increase, P6 with a 22,68% increase, and P3 with a 16,2 % increase.
Conversely, treatment P4 showed a 13,76% reduction compared to the control (Table 5).
Ash content reflects the total minerals present in plant material after the combustion of organic matter. It is inversely related to organic content, meaning that higher ash content indicates lower organic content. Common beans typicallyhave an ash content ranging from 0,36% to 0,5%, and the results obtained in this study do not align with this range [23]. Elevated ash content may be attributed to mineral-rich soil conditions, resulting in a higher accumulation of minerals in plant organs. Additionally, high ash content may signify the presence of undecomposed organic matter, such as crude fiber and lignin [24].
Table 5. Average wet weight, dry weight, organic content, and ash content of common bean pods per treatment
| Treatment | Wet Weight (gram) | Dry Weight (gram) | Organic Content (gram) | Ash Content (gram) |
|---|---|---|---|---|
| P1 | 406,50 ± 38,066 ab | 29,03 ± 3,192 a | 26,777 ± 3,603 a | 2,253 ± 0,183 ab |
| P2 | 483,80 ± 39,043 c | 33,52 ± 3,269 a | 30,393 ± 3,272 a | 3,123 ± 0,503 cd |
| P3 | 422,60 ± 41,782 abc | 29,83 ± 3,193 a | 27,211 ± 3,393 a | 2,618 ± 0,329 bc |
| P4 | 373,05 ± 37,880 a | 26,41 ± 2,152 a | 24,469 ± 2,687 a | 1,943 ± 0,339 a |
| P5 | 443,90 ± 16,226 bc | 31,18 ± 1,942 a | 27,907 ± 2,276 a | 3,274 ± 0,425 d |
| P6 | 390,70 ± 34,315 ab | 28,16 ± 2,952 a | 25,395 ± 2,996 a | 2,764 ± 0,416 bcd |
Notes: Numbers accompanied by the same letter in the same column show no significant difference in the 5% DMRT test.
3.3.2 Number of Pods, Pod Length, Pod Diameter, and Weight per Pod.
The production of bean pods varied significantly among treatments for the number of pods and pod length (p ≤ 0,05), but no significant differences were observed in pod diameter and pod weight. Treatment P2 yielded the highest average number of pods at 84,25 ± 5,449 pods, while the lowest average was seen in treatment P4 at 70 ± 4,301 pods, which was not significantly different from treatments P6, P3, and P1. The combination of CT with AsA was found to increase pod production by 2,14% in treatment P6 and by 6,12% in treatment P5 compared to non-combination CT. Treatments P2 and P5 significantly outperformed P1 in terms of pod production. Average pod length revealed the highest response in treatment P1 at 22,97 ± 0,296 cm, while the lowest was in treatment P3 at 20,37 ± 1,248 cm. The data suggest that none of the treatments provided better results than the control. Average pod diameter and weight per pod also did not significant differences in responses (Table 6).
Common bean pod production is influenced by various factors, including pests, diseases, and climate. Disruptions during the flowering and pod formation process (V6, pod formation) can have a significant impact on the number of pods formed [25]. The application of AsA can enhance plant resistance to diseases and stimulate the production of auxin and gibberellin hormones, thereby promoting fertilization [22]. Pod length is primarily influenced by genetic factors inherited from the seed, with approximately 98.96% of pod length determined by the plant's genetics [26]. Pod diameter reflects the seed-filling process and serves as a quality indicator for a pod. It is predominantly influenced by both plant genetics and environmental conditions. Different common bean varieties can result in varying pod sizes [27]. Differences in pod weight can be attributed to variations in metabolic processes within plants, particularly in the translocation of assimilates and photosynthesis. Insufficient assimilate and photosynthate translocation to the fruit can lead to a decrease in fruit weight and number [26].
Treatment Number of Pods Pod Length (cm) Pod Diameter (mm) Pod Weight (gram) P1 74 ± 5,244 a 22,97 ± 0,296 b 6,549 ± 0,361 a 5,47 ± 0,516 a P2 84,25 ± 5,449 b 21,39 ± 0,820 a 6,341 ± 0,465 a 5,75 ± 0,204 a P3 73,5 ± 5,679 a 20,37 ± 1,248 a 6,295 ± 0,180 a 5,73 ± 0,458 a P4 70 ± 4,301 a 21,26 ± 0,498 a 6,567 ± 0,304 a 5,34 ± 0,455 a P5 78 ± 3 ab 20,785 ± 1,387 a 6,288 ± 0,083 a 5,70 ± 0,214 a P6 71,5 ± 5,59 a 21,13 ± 1,005 a 6,318 ± 0,056 a 5,41 ± 0,438 a
Table 6. Average production of number of pods, pod length, pod diameter and wet weight per pod of common bean per treatment
Table 7. Productivity of common bean (P. vulgaris) per treatment
| 50,81 ± 4,758 ab 6,83 ± 0,640 ab |
|---|
| 60,48 ± 4,880 c 8,13 ± 0,656 c |
| 52,83 ± 5,223 abc 7,10 ± 0,702 abc |
| 46,63 ± 4,735 a 6,27 ± 0,636 a |
| 55,49 ± 2,028 bc 7,46 ± 0,273 bc |
| 48,84 ± 4,289 ab 6,56 ± 0,576 ab |
Notes: Numbers accompanied by the same letter in the same column show no significant difference in the 5% DMRT test.
3.4 Productivity
Data analysis of productivity indicated significant differences in results among treatments compared to control (P1), except for treatment P6. The estimated results revealed that treatment P2 achieved the highest productivity at 8,13 ± 0,656 tons/ha/cycle, while treatment P4 had the lowest productivity at 6,27 ± 0,636 tons/ha/cycle. Treatment P2 increased productivity by 19,03% compared to P1, followed by P5 with a 9,22% and P3 with a 3,95% increase. However, treatment P4 did not demonstrate the ability to enhance productivity compared to P1, with a lower productivity value of 3,95%. The combination of compost tea with AsA showed a 5,07% increase in productivity for treatment P5 and a 4,63% increase for treatment P6 compared to treatments without combination with AsA (Table 7). AsA has been demonstrated to significantly enhance the productivity of common beans during cultivation. Data analysis aligns with the findings of Gaafar et al., whose research established that treatment with 400 mg/L of AsA resulted in a remarkable 25.9% increase in vegetative growth and common bean seed production [4].
AsA functions as a highly efficient antioxidant, safeguarding crucial phytochemical processes within plants. The application of AsA through leaf spraying has a substantial impact on the levels of chlorophyll a, chlorophyll b, carotenoids, and total chlorophyll content.Thisincrease is consistent withAsAability to shield plant cells from the deleterious effects of Reactive Oxygen Species (ROS). The elevation in photosynthetic pigments such as chlorophyll a and b enhances the efficiency of photochemical reactions, ultimately leading to higher pod production [4]. The productivity values obtained from our data analysis range from 6.27 tons/ha to 8.13 tons/ha. These figures are by the potential productivity of Gypsy-1 common bean as described by the Ministry of Agriculture, which is 8 tons/ha. In another study concerning the application of KCl fertilizer at different doses, the average productivity of Gypsybean plants reached 8.94 tons/ha [28]. These results closely resemble our calculated productivity values, suggesting that treatments P2, P3, and P5 hold promise as viable alternatives to reduce the reliance on inorganic fertilizers.
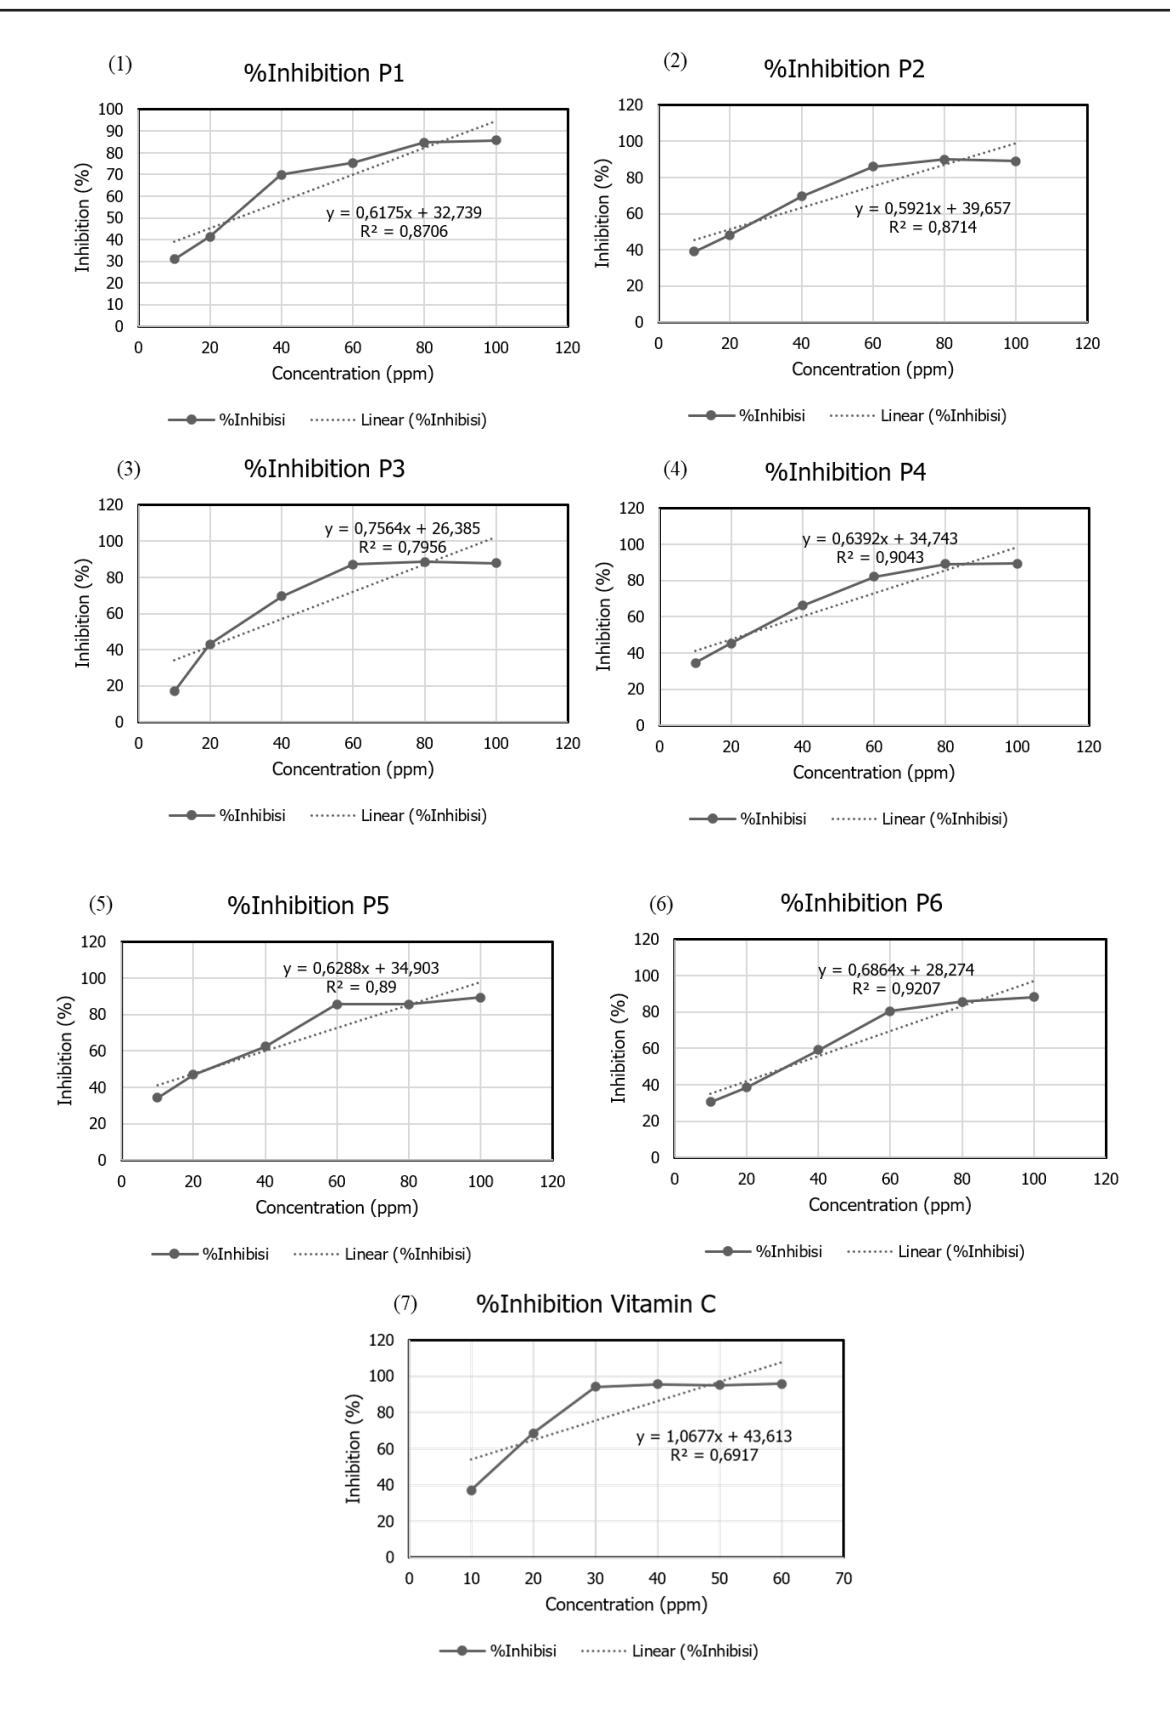
Figure 1. Free radical inhibition percentage curve of: (1) control treatment (P1), (2) ascorbic acid (AsA) treatment (P2), (3) manure compost tea (MCT) treatment (P3), (4) BSFR compost tea (BCT) treatment (P4), (5) MCT + AsA treatment (P5), (6) BCT + AsA treatment (P6), and (7) Vitamin C (positive control).
Table 8. IC50 value for each tratment
| No. | Test Sample Solution | IC50 value (µg/ml) | Classification of antioxidant activity |
|---|---|---|---|
| 1. | P1 | 27,95 | Very strong |
| 2. | P2 | 17,46 | Very strong |
| 3. | P3 | 31,22 | Very strong |
| 4. | P4 | 23,87 | Very strong |
| 5. | P5 | 24 | Very strong |
| 6. | P6 | 31,65 | Very strong |
| 7. | Vitamin C | 5,98 | Very strong |
3.5 Antioxidant Activity Assessment
Antioxidant activity is quantified through the inhibitory concentration 50 (IC50), indicating the concentration of a substrate required to inhibit 50% of biochemical reactions. IC50 values are typically expressed in units of µg/ml, with lower IC50 values indicating higher antioxidant activity and greater suppression of free radicals [29]. The IC50 determination curves for each treatment group are depicted in the following figures (Figure 1-7).
The calculation of IC50 values for each treatment necessitates an analysis of the linear regression curve results. The highest IC50 value was recorded for treatment P2 at 17,46 µg/ml, while the lowest IC50 value was observed in treatment P6 at 31,65 µg/ml (Table 8). Remarkably, the combination of CT and AsA fertilizer exhibited a better 23.12% reduction in IC50 value for treatment P5. Conversely, treatment P6 experienced an increase in IC50 value by 32.59%. The combined application of MCT and AsA proved quite effective in enhancing the antioxidant activity of common beans, surpassing the results obtained without this combination. However, in the case of BCT, it exhibited better antioxidant activity when used alone compared to its combination with AsA. Interestingly, the antioxidant activity of common beans in both P3 and P6 treatments remained lower than that of P1, indicating that these treatments were not as effective in enhancing the antioxidant activity of common bean pods. This outcome may be attributed to the antibacterial properties of AsA, which might interfere with the stability of BCT, thereby reducing its effectiveness in enhancing common beans' antioxidant activity.
Antioxidant activity is categorized based on IC50 values as follows: very strong if IC50 < 50 ppm (1 ppm = 1 µg/ml); strong if IC50 is in the range of 50-100 ppm; moderate if IC50 is in the range of 100-150 ppm; weak if IC50 is in the range of 151-200 ppm; and very weak if IC50 > 200 ppm. A lower IC50 value indicates higher antioxidant activity [29]. The notable antioxidant activity of the AsA treatment can be attributed to the known antioxidant capabilities of vitaminC, acting as the positive control. Leaf spraying with AsA is known to stimulate the increased production of secondary metabolites in common beans, such as phenols, flavonoids, and tannins [4]. Elevated levels ofthese secondarymetabolitescan significantly enhance the antioxidant capacity of commonbeans [3].
Vitamin C, or ascorbic acid, is a gluconic acid lactone compound derived from the combination of glucuronic acid and water-soluble ketolactone, featuring two ionizable hydroxyl groups. In nature, vitamin C exists in two isomeric forms: the reduced form (D-ascorbic acid) and the active chemically oxidized form (L-ascorbic acid), which can readily interchange. This property enables ascorbic acid to serve as a nutritional supplement with potent antioxidant effects [19]. The exogenous application of ascorbic acid to common bean significantly enhances the activity of both enzymatic andnonenzymatic antioxidants (such as glutathione and ascorbicacid) in common bean. The increase in non-enzymatic and enzymatic antioxidants in common beans reinforces their defense against oxidative damage caused by ROS and elevates their tolerance to drought and salt stress [30].
4. Conclusion
This study reveals that the productivity response of common bean significantly differs for each treatment compared to the control, except for treatment P6. The highest productivity was achieved by treatment P2 at 8,13 ± 0,656 tons/ha/cycle, increased productivity by 19,03%, followed by P5 with a 9,22% increase, and P3 with a 3,95% increase compared to the control. However, treatment P4 did not demonstrate a significant increase and had a slight reduction in productivity by 3.95%. The combination of CT and AsA increased productivity by 5,07% for P5 and 4,63% for P6 compared to treatments without this combination.
The lowest IC50 value for the methanol extract of common bean pods was recorded for treatment P2 at 17,46 µg/ml. The combination of compost tea and ascorbic acid reduced the IC50 by 23,12% in treatment P5, while treatment P6
increased the IC50 value by 32,59%. Treatment P5 effectively enhanced the antioxidant activity of common bean pods with the combination of AsA and CT, while treatment P6 exhibited better results without this combination. The IC50 values of treatments P3 and P6 were lower than those of the control, indicating insufficient enhancement of common bean pod antioxidant activity.
Acknowledgments
We express our gratitude to PT Indofood Sukses Makmur Tbk. for providing essential material support in the form of research funds. Special thanks go to the supervisor, laboratory assistants, and Parongpong farmers for their valuable contributions, including facilities, infrastructure, and the overall success of our research activities conducted both in the field (Parongpong) and the laboratory.