
1. Introduction
In the last few decades, there has been a decrease in air quality caused by several factors, including the use of fuel in transportation and motorized vehicles [1]. The higher the population growth in an area, the more transportation needs will increase [2]. Bandung area is densely populated area, with the growth of the transportation sector rising by 11% peryear. The ratio of the number of vehicles to the population is 3:4, with 72% of all registered cars being motorcycles [3]. This can increase air pollution due to toxic emissions suchas particulate matter (SPM10), lead, CO, hydrocarbons (HC), SOx, Ox, and NOx that are released into the environment, which results in decreased air quality and impacts public health [4]. Therefore, the government has issued an air pollution control policy to monitor ambient air quality using continuously operating devices, and the data can be observed directly. The installation devices process requires more
costs and regular maintenance; therefore, its use isstill limited. Another approach as monitoring systems using physicochemical methods also limited to monitoring certain chemical compounds or pollutants and could not describe the effects of pollutants on living organisms [5]. Evaluating dynamic changes in environmental quality by observing at the response of living things systematically is a biomonitoring activity that uses the principle of repeated measurements on chemical/biochemical markers related to specific exposures to the observed bioindicators [6]. Bioindicators can reflect the quality of an environment or provide an overview of the ecologicalsituation through its presence, absence, or behaviour closely related to a specific environmental status [7]. One of the organisms that can be used as a bioindicator is lichen. Lichen is a symbiotic organism between fungi (mycobiont) and algae (photobiont). The mycobiont component strengthens the body and absorbs water and minerals, while the photobiont
Figure 1. Research Study Area
produces food by photosynthesis [8]. The interaction of these two organisms forms a unique morphology, reproduction,and classification system. Lichen is the most common organism used as an air pollution biomonitoring tool becauseit is proven effective in describing the conditions of various pollutants in the atmosphere. Lichens does not have a cuticle layer, stomata, and absorptive organs, therefore it passively absorbs water, air, and environmental nutrients into its intracellular tissues [3]. These characteristics make lichen susceptible to toxic or harmful compounds in the form ofair pollutants. In tropical countries, it has been demonstrated that environmental factors and air pollution directly affect lichen diversity and distribution [6]. Studies on lichen as a bioindicator of air quality have been carried out in various cities in Indonesia, such as Jakarta, Semarang, Pekanbaru, Kendari, and Medan. Among them is the discovery of the Lepraria incana species, a lichen species that can survive at lowto moderate air pollution intensities in Bandung [9]. Lichens respond to environmental changes by reflecting in their diversity, abundance, morphology, physiology, and pollutant accumulation in their thallus [6]. Therefore, biomonitoring ofair pollution using lichen could be based on two approaches, namely analysing the diversity of lichen and determining heavy metals concentration in lichen thallus in areas with different levels of pollution [10]. Thus, this study utilizes these two biomonitoring approaches to monitor air qualityin four regions of Bandung Raya. This approach was carried out by analysing lichen diversity and abundance analysis to analyse lichen response to air quality in Bandung Raya and calculate the Index of Atmospheric Purity (IAP) based onthe frequency of thallus lichen closure. IAP value calculation helps determine air quality in Bandung Raya. According to [11], IAP is a quantitative analysis used to evaluate the level of pollution affecting lichens. This research was conducted in January-September 2022 in Bandung Raya area. Two locations are in the Bandung city, namely Ir. Haji Djuanda
street (JD) (6o52'22"S;107o36'59"E) and Kebon kawung street (KK) (6o54'45"S;107o36'05"E), and two locations in West Bandung Regency, namely Padalarang street (PD) (6o 50'38"S;107o 29'11"E), and Curug Cimahi (CC) (6o47'55"S;107o34'32"E ) as comparison stations (Figure 1).
2. Methodology
2.1 Data collection
Lichen samples were taken purposively at each station. 10 sample trees were chosen with a minimum distance of 3 m between trees to avoid tree shade. The area of lichen observation was carried out on the surface of the bark on the side facing the road as high as ±130 cm from the ground surface, using a transparent plastic quadrant frame measuring 25x25 cm [12]. After installing the plastic quadrant frame on the tree trunk, the type and amount of lichen in the quadrants were recorded. Lichen samples were taken by scraping the bark using a knife, then stored in an envelope and labeled/ described in the form of name, date, and place of sampling, as well as color and life form of lichen for further analysis. The coordinates of sampling station were recorded using GPS.
Environmental data collection
The environmental factors measured were air temperature and humidity, light intensity, tree bark pH, tree distance to the main road, and the volume of vehicles passing through the observation area. Air temperature and humidity measured using a sling psychrometer while for light intensity, using a lux meter. Microclimate data collection was carried out with three repetitions starts at 09.00 – 11.00 at each station. pH measurements on tree bark were carried out based on the method [13] with modifications. Research [2] suggests that the method used for calculating traffic volume is carried out at peak hours at The traffic volume calculated only motorized vehicles at peak hours suggested by (2) that is 07.00-08.00 WIB or 16.00-18.00 WIB. Measuring the distance of trees to the road is done using a rolling meter.
2.2 Data Analysis
Lichen Diversity
The lichen species were identified by observing the morphology and anatomy of the lichen [14]. Then the diversity index from each observation station was calculated by the Shanon-Weiner (H') diversity index with the formula:
\[H' = \sum_{i=1}^{s} (pi)(\ln pi)\]
H' = Shannon-Wiener Diversity Index
\(Pi = \sum ni/N\)
Ni = Number of individuals (species)N = Number of individuals of all species
The calculation of lichen cover area is calculated based on the formula:
\[A = \frac{Wt}{Wi} \times 1 cm^2\]
A = Area of lichen closure
Wt = Total weight of HVS paper measured by area (mg)
Wi = Weight of HVS paper with an area of \(1 \text{ cm}^2\)
The lichen cover area is expressed in %, the closing percentage is calculated based on the formula:
Frequency (%) = \[\frac{A}{A_k}x\] 100%
A = Covering an area of lichen Ak = Area squared (25 cm x 25 cm)
Calculation of the value of IAP (Index of Atmospheric Purity)
Environmental quality assessed by Index of Atmospheric Purity (IAP)[13]:
\[IAP = \frac{1}{10} \sum_{i}^{n} (Qi \ x \ fi)\]
IAP = Index of Atmospheric Purity
Qi = Ecological index (average number of species i), calculated based on the number of species found in an area divided by the total number of species found in the entire observation area.
Fi = Index of combination between frequency and lichen cover in an area
The meaning of the IAP values will be represented by table 1 [12]
Table 1. Interpretation of the IAP (Index of Atmospheric Purity) values
| Pollution level | Criteria | Description |
| Level A | 0≥IAP≤12,5 | Very high pollution |
| Level B | 12,5| High pollution | |
| Level C | 25| Moderate pollution | |
| Level D | 37,5| Low pollution | |
| Level E | IAP>50 | Very low pollution |
Statistic Analysis
The relationship between environmental parameters such as humidity, light intensity, temperature, tree bark pH, and tree distance from emission sources (roads) with lichen cover frequency analyzed using Spearman's correlation and factor analysis using Principal Component Analysis (PCA). This analysis is one of the mathematical models to describe the relationship between air quality and microclimatic factors that can be used to understand how changes in microclimatic. The data analyzed statistically using Minitab 21.
3. Results and Discussion
3.1. The proportion of lichen species based on morphology Identification results showed that 24 species from 15 lichen families grew on tree substrates at observation stations in Bandung Raya. The number of lichens found at each stationis shown in Table 2. Lichens in Bandung Raya have varying colours, shapes, and thallus sizes. The lichen thallus colours included orange, green, grey, white, and yellow, with a talus size of \(\pm\) 4-40 cm2. The most common lichens were found at observation stations CC as controls, JD, and PD, and the least was found in KK. The lichen species found were from different families, and based on the morphology of the thallus, the lichens were grouped into crustose (62%), foliose (37%), and fruticose (1%) (Figure 2).
In this study, the lichens analysed were lichens attached to tree trunks with a circumference of \(\geq 50\) cm (Table 3). Each tree species has a different canopy and bark texture, so lichens also has preference living and growing on certain tree species. Lichen cannot be found in all types of trees because, according to research conducted by [13], differences in tree bark texture
Table 2. The total number of lichen species
| Lichen Species | Family | Morphological | ∑ Colony |
|---|---|---|---|
| Type | |||
| Cryptothecia striata | Arthoniaceae | Crustose | 26 |
| Bacidia viridifarinosa | Bacidiaceae | Crustose | 17 |
| Dirinaria applanate | Caliciaceae | Foliose | 4 |
| Dirinaria picta | Caliciaceae | Foliose | 18 |
| Buellia sp. | Caliciaceae | Crustose | 5 |
| Chrysothrix xanthina | Chrysotrichaceae | Crustose | 3 |
| Leptogium sp. | Collemataceae | Foliose | 5 |
| Collema subflaccidum | Collemataceae | Foliose | 6 |
| Graphis sp. | Graphidaceae | Crustose | 17 |
| Hemithecium chrysenteron | Graphidaceae | Crustose | 4 |
| Lecidella elaeochroma | Lecanoraceae | Crustose | 7 |
| Lecanora sp. | Lecanoraceae | Crustose | 14 |
| Megalospora tuberculosa | Megalosporaceae | Crustose | 4 |
| Parmelia sp. | Parmeliaceae | Foliose | 22 |
| Parmothrema sp. | Parmeliaceae | Foliose | 16 |
| Heterodermia japonica | Parmeliaceae | Foliose | 4 |
| Canoparmelia aptata | Parmeliaceae | Foliose | 5 |
| Phlyctis argena | Phlyctidaceae | Crustose | 23 |
| Fulgensia sp. | Phlyctidaceae | Crustose | 17 |
| Physcia sp. | Physciaceae | Foliose | 12 |
| Pyxine cocoes | Physciaceae | Foliose | 15 |
| Lepraria incana | Stereocaulaceae | Crustose | 50 |
| Xanthoria sp. | Teloschistaceae | Foliose | 3 |
| Ramalina sp. | Ramalinaceae | Fruticose | 4 |
Table 3. Lichen-growing substrate tree
| Research Area | ||||
|---|---|---|---|---|
| Tree Species | JD | KK | PD | CC |
| Artocarpus altilis | √ | √ | √ | √ |
| Swietenia mahagoni | √ | − | − | − |
| Filicium decipiens | − | √ | √ | − |
| Roystonea regia | √ | − | √ | − |
| Mimusops elengi | − | − | √ | − |
| Ficus benjamina | − | √ | − | − |
| Maesopsis eminii | − | − | √ | √ |
| Schima wallichii | √ | − | − | − |
| Toona sureni | − | − | − | √ |
| Eucalyptus deglupta | − | − | − | √ |
| Pterocarpus indicus | − | √ | − | − |
| Samanea saman | √ | √ | √ | − |
| Diospyros celebica | − | − | − | √ |
Figure 2. Crustose thallus lichen: (a) Lepraria incana, (b) Phlyctis argena, (c) Chrysothrix xanthina, (d) Lecidella elaeochroma, (e) Fulgensia sp., (f) Lecanora sp., (g) Graphis sp., (h) Buellia sp., (i) Hemithecium chrysenteron, (j) Cryptothecia striata, (k) Megalospora tuberculosa, (l) Bacidia viridifarinosa
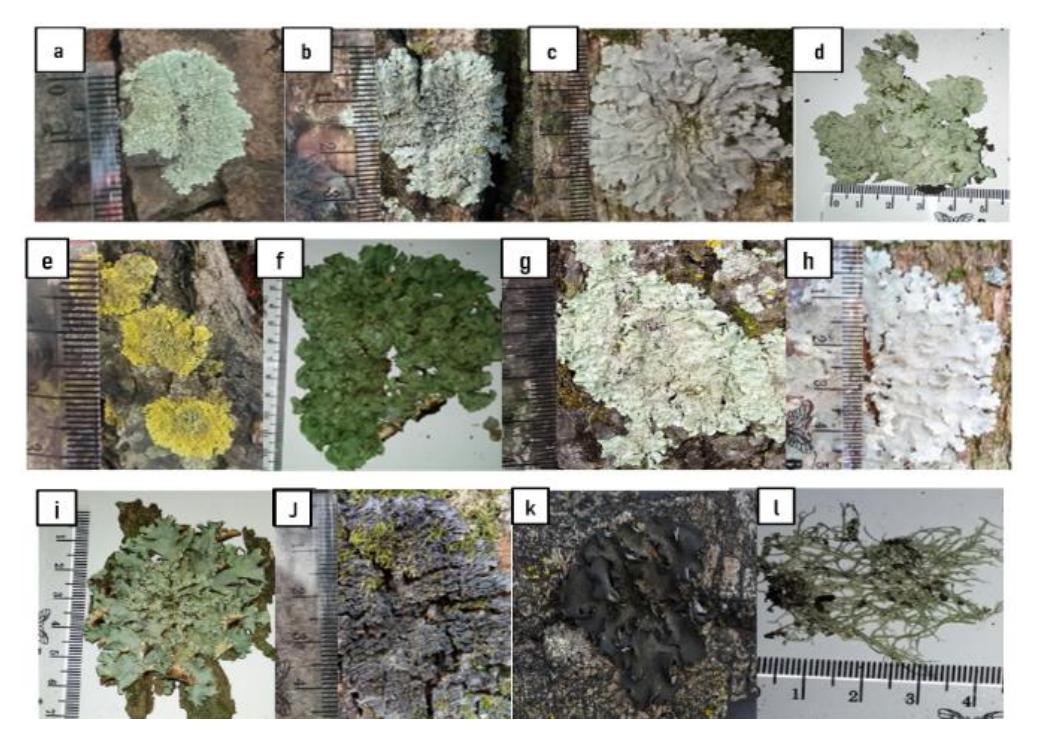
Figure 3. Foliose and fruticose thallus lichen: (a) Dirinaria applanata, (b) Dirinaria picta, (c) Pyxine cocoes, (d) Parmelia sp., (e) Xanthoria sp., (f) Parmotrema sp., (g) Canoparmelia aptata, (h) Physcia sp., (i) Heterodermiajaponica, (j) Collema subflaccidum (k) Leptogium sp. (l) Ramalina sp.
affect lichen growth regardless of the various pollutant factors exist around the study site. Differences in the type and texture of tree bark as a lichen substrate affect the type of lichen that can grow.
Lichens in Bandung Raya have varying in colours, shapes, and thallus sizes. The lichen thallus colours included orange, green, grey, white, and yellow with a thallus size of ± 4-40 cm2 . The highest number of lichens were found at the CC observation station as a control, following by station JD,PD, and the least in KK. Based on the morphology of the thallus, the crustose type has a higher number and found in allobserved tree species in Bandung Raya site. Crustose lichen isa type of lichen that is strongly attached within a colony shape to be rounded although sometimes has an irregular shape. The variation of lichen with a basic crustose form can be seen in figure 2.
Lichen foliose is a type of lichen with a thallus shape like a leaf blade. This type of lichen is commonly found in the CC area, and lichen fruticose is member of Ramalinaceae witha light green thallus. This species is often seen hanging from the bark of tree trunks at an altitude of > 1.2 meters from the ground. Research by [15] shows that this species grows in an open areas with low levels of air pollution, therefore, this species could also indicate of air pollution (Figure 3).
Number of Colonies and Frequency of Lichen Closure
Based on the number of colonies, species L. incana, D. picta, and P. cocoes had colonies that could be found in all observation sites. Meanwhile, Ramalina sp., H. japonica, M. tuberculosa, H. chrysenteron, and D. applanate were only found at one observation area and had fewer colonies than other species. The presence and absence of lichen species in an area indicate the potential of these species to become bioindicators of environmental quality. At each observation station, several lichen species have a higher frequency of closure than other species, related to the tolerance range of lichens to survive in various air pollution conditions and surrounding environmental conditions. Based on figure 4, it can be seen that the species in the KK and PD locations have fewer species than in JD and CC locations. Species in urban areas such as KK and PD areas are generally tolerant of air pollution. In general, susceptible species in this area experience an increase in frequency as air pollution increases.
The total frequency of lichen cover is much influenced by environmental factors such as humidity, light intensity, temperature [12], pH of tree bark, and tree distance to emission sources (roads), where the higher frequency of lichen cover indicates its ability to survive in the surrounding environment. In addition, lichen species are more chemically protected to
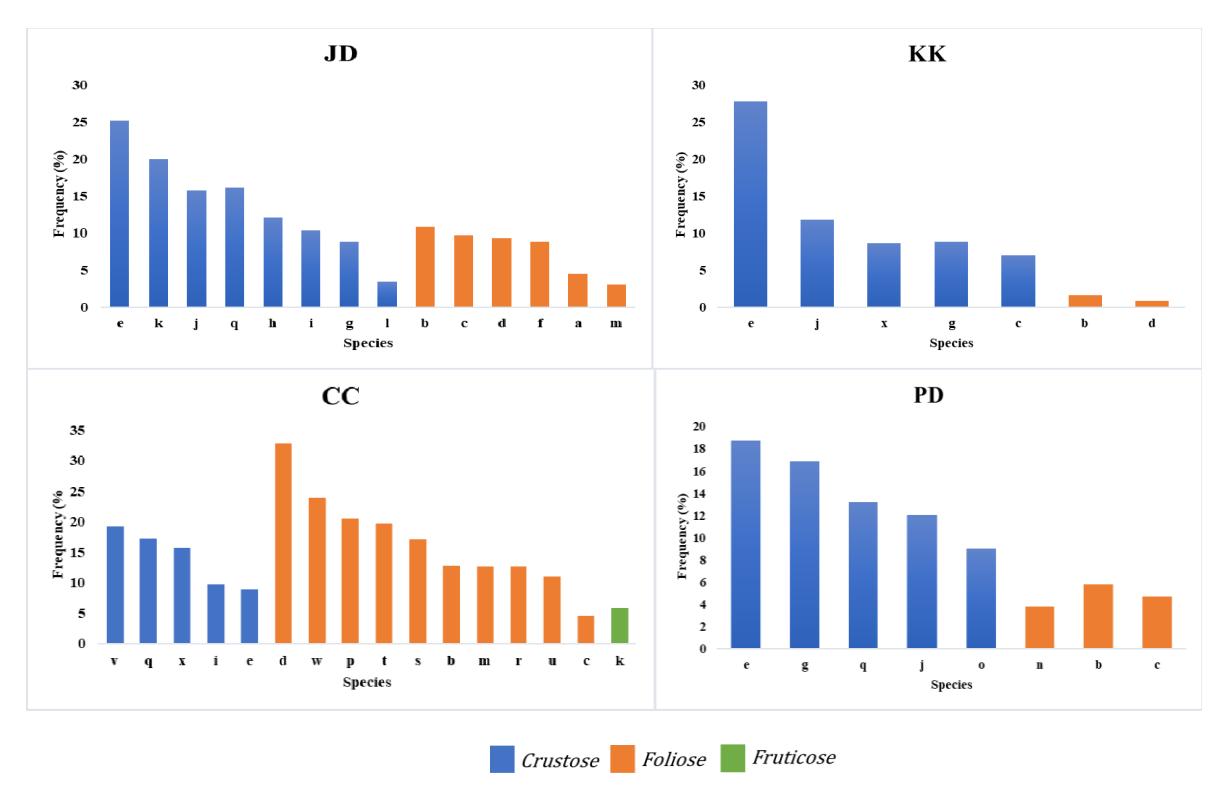
Figure 4. Frequency of lichen cover in all observation areas: (a) Dirinaria applanata, (b) Dirinaria picta, (c) Pyxine cocoes, (d) Parmelia sp., (e) Lepraria incana, (f) Xanthoria sp., (g) Phlyctis argena, (h) Chrysothrix xanthina, (i) Lecidella elaeochroma, (j) Fulgensia sp., (k) Lecanora sp., (l) Graphis sp., (m) Collema subflaccidum, (n) Buellia sp.,(o) Hemithecium chrysenteron, (p) Parmotrema sp., (q) Cryptothecia striata (r) Ramalina sp., (s) Leptogium sp., (t) Canoparmelia aptata, (u) Physcia sp., (v) Megalospora tuberculosa, (w) Heterodermia japonica, (x) Bacidia viridifarinosa
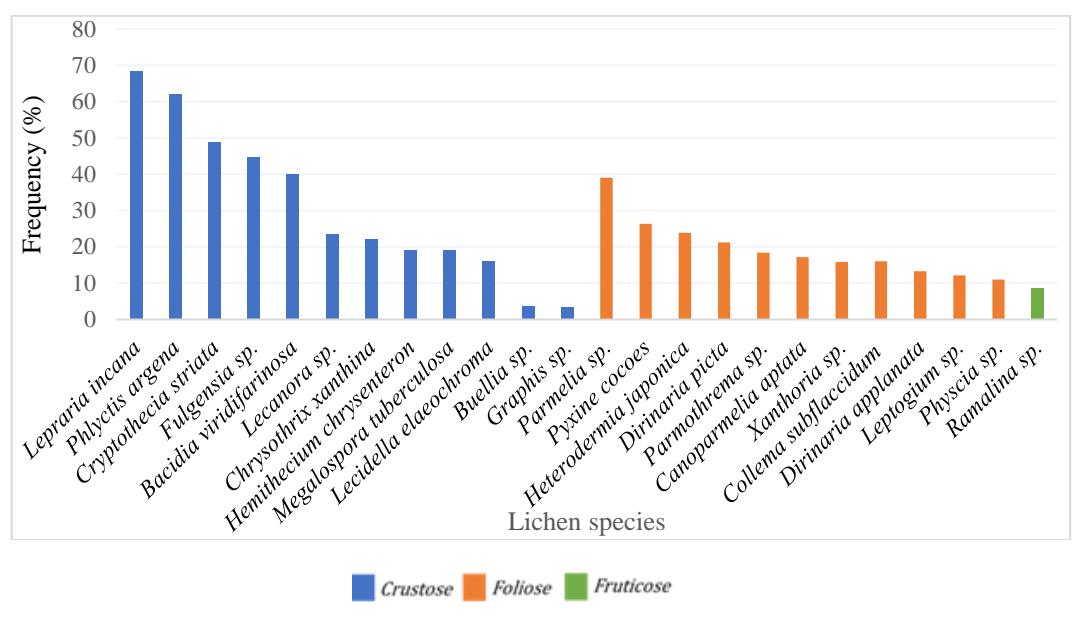
Figure 5. The total frequency of lichen cover
live in urban areas with higher pollution levels, drier, and more light intensity [12]. Figure 5 shows that there are three lichen species with the highest total coverage frequency for the crustose type, namely L. incana (68%), P. argena (62%), and C. striata (49%). In contrast, the foliose type is P. cocoes (39%), Parmelia sp. (26%), D. Picta (24%). This shows that the six lichen species were most often found in the observed trees. This indicates that the tolerance range of the six lichen species is large enough to grow in various environmental conditions. Lichens that are rarely found at observation stations are shown to have low-frequency values, including Ramalina sp. (0.09%), Graphis sp. (0.04%), and Buellia sp. (0.03%).
3.2. Correlation of lichen presence on microclimate factors, substrates, anthropogenic
The environmental conditions of an area can affect the diversity of lichens in that area. In this study, Principal Component Analysis (PCA) is a statistical technique that can be used to reduce the dimensionality of data while preserving as much variability as possible. In the context
** Correlation is significant at the 0.05 level (2-tailed).
of studying the presence of lichens, PCA can help identify the most important factors (variables) influencing lichen distribution, such as microclimate conditions, substrates, and anthropogenic influences. According to [3], lichen species richness is affected by the humidity, light intensity, and temperature of an area which is indicated by lower lichen species richness in drier places. To determine the correlation between the frequency of lichen cover and environmental factors consisting of average humidity, light intensity, temperature, pH of tree bark, and tree distance to emission sources (roads), the Spearman correlation statistical test was carried out (Table 4). The results show that humidity, tree bark pH, and tree distance to anthropogenic sources (roads) strongly correlate with lichen covering frequency. Humid air conditions indicate an increase in the frequency of lichen closure. The neutral pH of the substrate supports this because the acidity of the substrate is also affected by the distance of the substrate from anthropogenic sources. Meanwhile,light intensity, temperature, and vehicle volume negatively correlate with the frequence of thallus lichen closure. High light intensity will increase air temperature, decreasing the
Table 4. Correlation of lichen presence on microclimate factors, Variable Temperature Light intensity Distance Vehicle volume pH of tree bark Humidity Fr (%) Temperature 1 Light intensity 0.84** 1 Distance -0.614** -0.768** 1 Vehicle volume 0.660** 0.758** -0.918** 1 pH of tree bark -0.489* -0.625** 0.862** -0.763** 1 Humidity -0.656* -0.580 0.452 0.562 0.514* 1 Fr (%) -0.489* -0.625** 0.862** -0.763** 0.718** 0.614** 1 ** Correlation is significant at the 0.01 level (2-tailed).
frequency of thallus lichen closure [11].
The PCA results presented in Figure 6 show that Lepraria incana, Phlyctis argaena, Fulgensia sp., are in quadrant IV, together with Ficus benjamina and Pterocarpus indicus. Thevariables that characterise this quadrant are temperature andlight intensity. The three species are lichens identical to urbanareas with higher temperatures and light intensity, such as theenvironmental conditions in the KK area. In addition, researchby [16] showed that lichens that are tolerant to air pollution,such as Lepraria sp. and P. Argaena, will increase in the amountand frequence of thallus lichen closure along with increasingtemperature and light intensity with high transport activity. Asin the Philippines, Lepraria sp. predominates in cities close to intense transport circulation This happens because the talus can accumulate elements such as heavy metals up to 97% [17].Graphis sp., D. applanate, Parmelia sp., Lecanora sp., Xanthoria sp., Buellia sp., Physcia sp., B. viridifarinosa, M.tuberculosa, H. chrysteron, C. striata, L. elaeochroma species are in quadrant II, together with Swietenia mahagoni, Schimawallichii, and Samanea saman. Tree-to-road distance and tree bark pH characterised this quadrant. It issuspected that the 12species can be found in tree substrates which are more acidicand close to roads such as the JD area. Research conducted by
[3] stated that species that are close to highways found more acidic substrates have the potential to neutralise heavy metals in the air.
In quadrant I, C. sublaccidum, C. aptata, H. japonica, Leptogium sp., Ramalina sp., and Parmothrema sp. were found along with Eucalyptus deglupta, Diospyros celebica, Toona sureni. The variable that characterises this quadrant is air humidity. The presence of these species predominates in shady areas with high air humidity, such as the CC area. On the other hand, fruticose lichens, like Ramalina sp. found in quadrant I, namely lichen species is affected by moisture. This occurs because Ramalina sp. could not be found in all observation stations. After all, this group usually lives in moreundisturbed areas with higher moisture levels and a non-acidicbark pH [13]. Findings of several species, such as Ramalina sp. and Leptogium sp., which are only found in the CC area, shows that the area still has good air quality because this lichen is sensitive to acidification by air pollution [4]. CC hasmore closed-canopy treesthan other areas, making it easier fororganisms to grow. In Mediterranean forests, the growth and development of lichens are closely linked to environmental conditions such as low human disturbance, high shrub cover, and areas with steeper slopes. These factors contribute to creating more stable microclimates and lower levels of humanactivity, which are favorable for lichen communities. Forexample, lichen diversity tends to be higher in forests with dense canopies and lower human impact, as seen in certain oakforests in Spain. Shaded north-facing slopes and areas with reduced disturbance provide optimal conditions for epiphytic
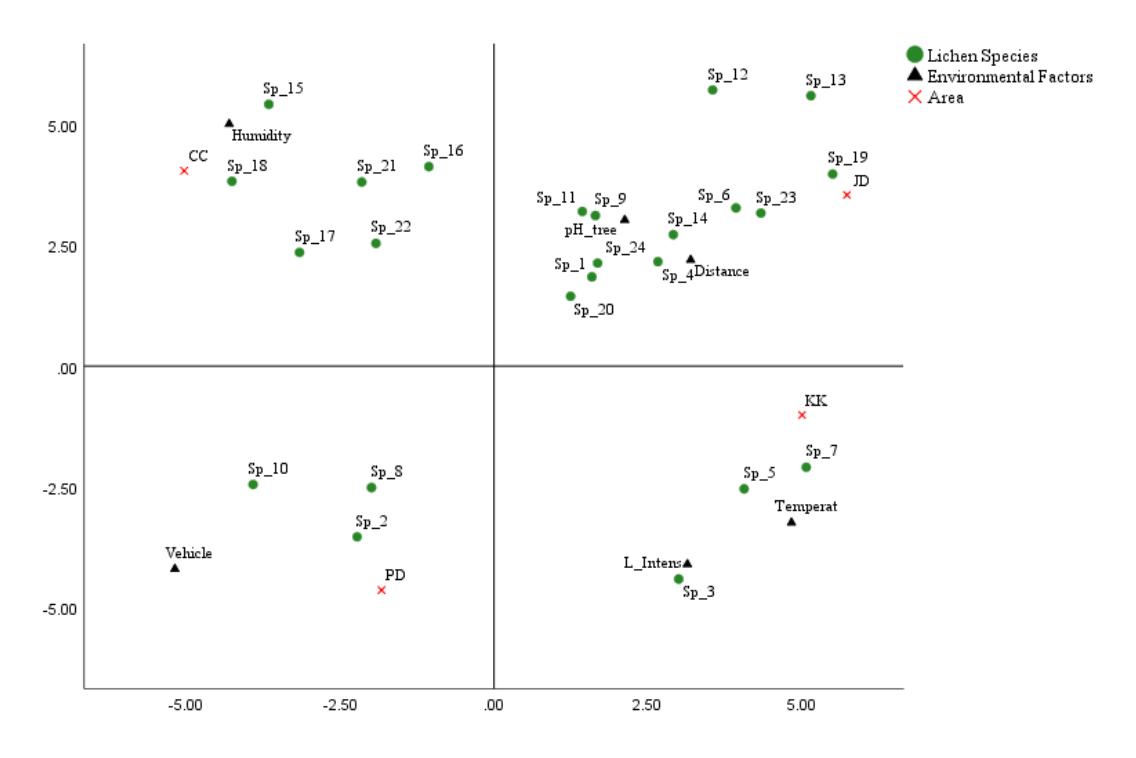
Figure 6. PCA results for lichen species data. Quadrant I (CC Area) consists of Sp 15: C. sublaccidum, Sp 16: C. aptata, Sp 17: H. japonica, Sp_18: Leptogium sp., Sp 21: Ramalina sp., Sp 22: Parmothrema sp.; Quadrant II (JD Area) consists of Sp 1 Graphis sp., Sp 4: D. applanate, Sp 6: Parmelia sp., Sp 9: Lecanora sp., Sp 11: Xanthoria sp., Sp 12: Buellia sp., Sp 13: Physcia sp., Sp 14: B. viridifarinosa., Sp 19: M. tuberculosa, Sp 20: H. chrysteron., Sp 23: C. striata., Sp 24: L. elaeochroma.; Quadrant III (PD Area) consist of Sp 2: P. cocoes, Sp 8: L. elaeochroma, Sp 10: H. chrysenteron; Quadrant IV (KK Area) consist of Sp 3: L. incana, Sp 5: P. argaena, Sp 7: Fulgensia sp.
lichens, allowing them to thrive due to higher air humidityand less exposure to direct sunlight [18]. In temperate forestsof India, Quercus semecarpifolia trees in open canopy forests exhibit the highest lichen cover, with figures reaching up to 70%, while trees in closed canopy forests show only about 40% lichen cover. This variation in lichen cover is influenced by several factors, including tree canopy openness, tree size, and the physical properties of the tree bark [19].
In quadrant IV, C. xanthina, P. cocoes and D. picta were found together with Roystonea regia, Artocarpus altilis, and Filicium decipiens. The variable that characterises this quadrant is the volume of vehicles. .these three species allow it to live in areas with high traffic volumes. Species L. incana, P. cocoes, P. argaena, Fulgensia sp., C. xanthina, and D. picta have the potential as bioindicators of medium-high air pollution because these species are lichens whose existence is found close to anthropogenic sources with high traffic density like in KK, PD, and JD.
the species diversity index value in KK and PD is included in criterion H'<1 namely low lichen species diversity. Based on the dominance index at JD and CC observation stations, the dominance of lichen species is low because there are no dominant lichen species in the area, while in PD and KK, the dominance of lichen species is moderate because there are several lichen species that dominate in the area.
Understanding an organism's pattern of diversity and dominance is critical in conservation and management. In recent years, the design of lichen diversity in Bandung Raya shows that the index value of lichen species tends to decrease along with poor air quality. Ecological factors are essential in lichen species' growth, development, distribution, and diversity. Variations in microclimate conditions, incredibly light, water, and nutrient intensity, driven by local disturbance sources such as roads or agriculture, different land uses, or habitat fragmentation, can affect lichen diversity. A study by [19] stated that metal concentrations accumulated in lichens
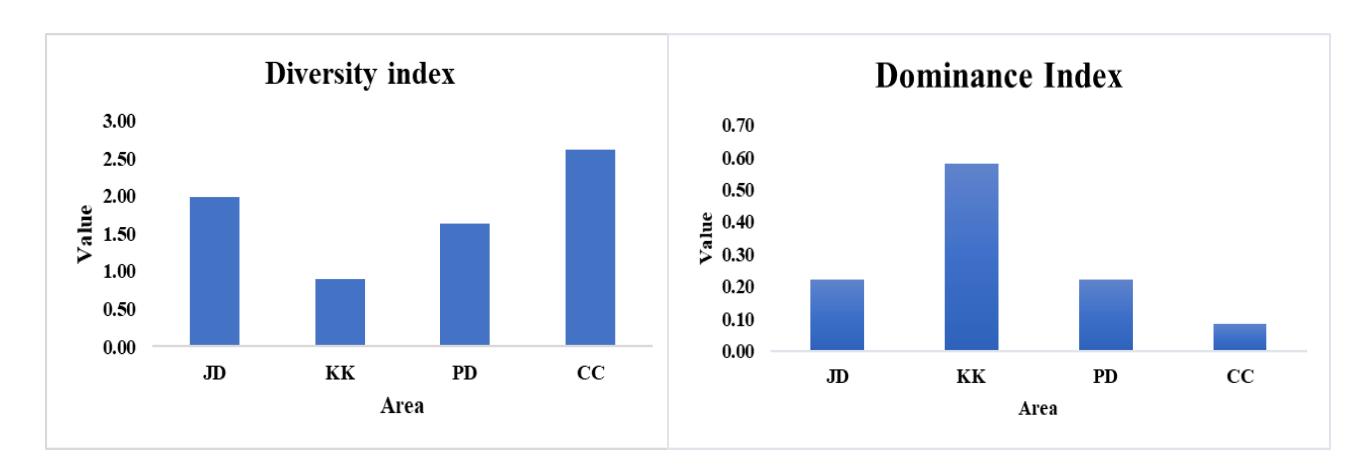
Figure 7. Diversity and dominance Index of lichen
| Table 5. Index of Atmospheric Purity measurement results |
|---|
| Area | IAP | Pollution level | Description |
|---|---|---|---|
| Djuanda street | 24,85 | Level B | High pollution |
| Kebon Kawung street | 10,21 | Level A | Very high pollution |
| Padalarang street | 17,70 | Level B | High pollution |
| Curug Cimahi | 46,65 | Level E | Very low pollution |
3.3. Diversity Index and Lichen Dominance
Diversity and lichen dominance can be taken as an estimate of air quality. The higher the diversity value and the lower the dominance value indicate good environmental conditions and vice [17]. In figure 7, the index value of lichen species diversity in CC is included in the index criteria H'>3, which indicates very abundant lichen diversity, JD has an index value of 1<H'<3 which is great lichen diversity, while correlated with distance to the source of pollution, climatic factors, and land cover, significantly impacting lichen diversity. One of the primary markers of anthropogenic pollution on earth is the decrease in lichen diversity demonstrated at the end of the 19th century in Paris.
3.4. Index of Atmospheric Purity
According to the categorization of air quality levels proposed by [3] ba sed on the IAP value, the observation stations with the highest to lowest levels of air pollution are KK, PD, JD, and CC (Table 5). The four observation stations show differences in vehicle emissions caused by differences in traffic volume and good air environmental conditions so that living organisms such as lichens can be maintained. This is to research conducted by [18] that highly disturbed city sites (urban areas with high disturbance) fall into the same category, namely levels A and B. In addition to the high traffic intensity and density that causes air pollution, urban areas alsohave limited availability of substrates, resulting in changes in microhabitat conditions that can affect biodiversity and lichen frequency. Lichen biodiversity and frequency will generally increase as the distance from the emission source are further away, and the IAP value will increase with the distance from urban areas. The distinguishing factor of the IAP value at these four observation stations is the difference in land use. According to [3] IAP in industrial areas, toll roads, and other urban areas tend to be lower than in areas with natural environmental conditions. Apart from the CC area, the other three regions have the same land use, so it is also observed that the IAP value reflects the similarity of lichen variety and closing frequency.
4. Conclusion
The objectives of research on lichens as air quality indicators are to understand and evaluate their ability to detect and monitor air pollution levels. Study different lichenspecies and their distribution across various environments to determine their sensitivity to air pollutants. A total of 24 species from 14 families with a total of 256 lichen colonies were found at the observation station. Based on their thallus morphology, (62%) percent lichen were grouped into crustose type (62%), foliose type (37%), and fruticose type (1%). Lichen species that were high in frequency in moderate to very high levels of pollution were Lepraria incana, Pyxine cocoes, Phlyctis argaena, Fulgensia sp., Chrysothrix xanthina, and Dirinaria picta. Those six species are identical to urban areas with higher temperatures and light intensity, such as environmental conditions in the KK area. On the other hand, the lichen Ramalina sp. is a species sensitive to air pollution, so it can only live in low pollution levels, such as areas in CC because this lichen is sensitive to acidification by air pollution. CC has more closed-canopy trees than other areas, making it easier for organisms to grow. The highest lichen diversity was found in the CC area (2.62), followed by JD (1.99), PD (1.63), and the lowest in KK (0.90). The lowest IAP result was in KK (10.21), followed by PD (17.70) and JD (31.85). The location with the highest IAP was obtained at CC (46.65), indicating that the environmental conditions were still good, while other locations were polluted. Environmental factors like humidity, tree bark pH, and tree distance to anthropogenic sources (roads) are strongly correlated with the frequency of lichen closing, while light intensity, temperature, and vehicle volume are negatively correlated with the frequency of thallus lichen closure.category, namely levelsAand B. In addition to the high traffic intensity and density that causes air pollution, urban areas also have limited availability of substrates, resulting in changes in microhabitat conditions that can affect biodiversity and lichen frequency. Lichen biodiversity and frequency will generally increase as the distance from the emission source are further away, and the IAP value will increase with the distance from urban areas. The distinguishing factor of the IAP value at these four observation stations is the difference in land use. According to [3] IAP in industrial areas, toll roads, and other urban areas tend to be lower than in areas with natural environmental conditions. Apart from the CC area, the other three regions have the same land use, so it is also observed that the IAP value reflects the similarity of lichen variety and closing frequency.
Acknowledgments
We are grateful to Bandung Institute of Technology and The School of Life Sciences and Technology for providing us with laboratory instruments for conducting this research.