

Abstrak
Gula merupakan zat yang berasa manis, larut dalam air, berbentuk kristal yang dapat diperoleh dari berbagai sumber antara lain bit gula dan tebu. Sebagai sumber karbohidrat, pemanis dan pengawet dari makanan, dan penyebab diabetes, maka kandungan gula perlu ditentukan. Tujuan dari penelitian ini adalah untuk verifikasi kesesuaian penentuan kadar gula dalam jus buah menggunakan Kromatografi Cair Kinerja Tinggi (KCKT). Buah segar kecuali stroberi dikupas kemudian dipotong dan dicampur dengan menggunakan homogenizer. Setelah disaring, 12.5mL jus segar dan 12.5mL jus kemasan diencerkan dengan asetonitril dan air suling (50:50). Jus segar dan jus kemasan kemudian dilewatkan melalui tabung C18 Sep-Pak. Fruktosa, glukosa dan sukrosa kemudian dianalisis menggunakan KCKT detektor Indeks bias, kolom NH2, 10µm (250µm × ID 4.6mm) dan suhu kolom 43.5ºC, fase gerak asetonitril dan larutan natrium fosfat 10mM (78:22) dan laju aliran adalah 1.0mL/min. Metode validasi menunjukkan linearitas persamaan yang baik untuk fruktosa, glukosa dan sukrosa yaitu y = 3833208,4806x – 94721,0361, y = 3782886,4708x – 101683,4708, y = 3770593,9638x – 82870,9083 dengan koefisien korelasi, r2 adalah 0,9995, 0,9997 and 0,9996 masing-masing. Koefisien fungsi regresi yang dihitung (Vx0) untuk fruktosa, glukosa dan sukrosa adalah 0,0152, 0,0112 dan 0,0132 %. Persentase perolehan kembali untuk fruktose, glukosa dan sukrosa berada dalam rentang masing-masing 86,681 – 89,888, 86,898 – 90,029, dan 94,541 – 97,885%. Kandungan fruktosa, glukosa dan sukrosa dapat ditentukan dengan menggunakan kromatografi cair kinerja tinggi dengan detektor indek bias. Fruktosa, glukosa dan sukrosa jus segar mengandung 0,469 – 1,431, 0,454 – 1,286, 0,544 – 1,861% sementara pada jus kemasan mengandung masing-masing 0,309 – 1,587, 0,261 – 0,762, 0,063 – 0,898%.
Kata kunci: Fruktosa, glukosa, sukrosa, jus buah, HPLC.
Introduction
Refering to the Best of Health by Sheldon Zerden, it showed that a rise in sugar consumption lead to diabetes mellitus. Diabetes mellitus has been increasingly rapidly along with increases in obesity and cardiovascular diseases. In 1985, it is estimated that approximately 30 million people worldwide had diabetes. A decade later, this estimate had risen to 135 million. In 2000, this estimate had risen to 171 million. This is projected to increase to at least 366 million by the year of 2030.
In 2009, American Heart Association (AHA) released new guidelines limiting the amount of added sugar considered acceptable for a healthy diet. It should consume no more than 100 calories of added sugar for women and no more than 150 calories of added sugar for men. These numbers average out to about 6-9 teaspoons, or 25-37.5g, of sugar a day. Preschoolers with a daily caloric intake of 1200-1400 calories should not consume more than 170 calories, or about 4 teaspoons, of added sugar a day. Children ages 4-8 with a daily intake of 1600 calories should consume no more than 130 calories, or about 3 teaspoons, of added sugar a day. As the child grows into his preteen and teen years, and his caloric range increases to 1800-2000 a day, the maximum added sugar in his daily diet should be 5-8 teaspoons (Sheldon 2004; Bazzano 2004).
According to Food and Drug Administration (FDA) in 1993, sugar analysis on monosaccharides and disaccharides is a necessity for all of the food industry. Previous reports on sugar analysis of food products were based on total sugar or sucrose, with little emphasis on the other individual sugars (Ferrier 2003).
Recently, high performance liquid chromatography has become the preferred methods for quantitating simple sugars in a variety of food products (Perez et al. 1997; Graves and Peckham, 1995; Angustin and Khor 1986; Ellefson 2002).
Therefore, the aim of the study was to verify the suitability of determination of sugar contents in fruits using High Performance Liquid Chromatography (HPLC).
Experiment
Materials
Glucose (Merck), fructose (Merck), sucrose (Merck), acetonitrile HPLC grade (J.T Beaker), distilled water, 10mM sodium phosphate (monobasic) solution, fruits (apple, guava, kiwi, orange and strawberry), packed fruit juices (apple juice, guava juice, kiwi& grape juice, orange juice and strawberry juice).
Equipments
Weighing paper, weighing machine, spatula, volumetric flask (10mL, 25mL, 100mL), funnel, glass rod, measuring cylinder (10mL, 100mL), beaker (50mL, 100mL, 500mL), knife, homogenizer, porcelain dish, Whatman No.1 filter paper, C18 Sep-Pak cartridge, conical flask (100mL, 250mL), 0.45µm Nylon filter, syringe filter, micropipette, HPLC system containing RI detector (Hitachi), amine polar bonded phase column, 10µm (250mm × 4.6mm I.D.).
Glucose/ Fructose/ Sucrose Stock Solution
2.5g of glucose, fructose and sucrose were accurately weighed. Each of them was dissolved in 25mL volumetric flask respectively with acetonitrile and distilled water (50:50) to the mark. Each of volumetric flasks was shaken vertically until all glucose, fructose and sucrose were completely dissolved to produce 10% glucose, fructose and sucrose stock solution.
Glucose/ Fructose/ Sucrose Standard Solution
The glucose, fructose and sucrose standard solutions, of 0.5, 1.5, 2.5, 3.5, 4.5 and 5.5 %, were prepared in 10mL volumetric flask respectively, by diluting 0.5, 1.5, 2.5, 3.5, 4.5 and 5.5 mL of glucose, fructose, and sucrose stock solution with acetonitrile and distilled water (50:50) to the mark respectively. Each of volumetric flasks was shaken vertically until the solutions were homogenized. The standard solutions of mixture of fructose, glucose and sucrose, at 0.167, 0.5, 0.833, 1.167, 1.5 and 1.833 % were prepared respectively, by pipetting 2mL of each homogenized solution from 0.5, 1.5, 2.5, 3.5, 4.5 and 5.5 % standard solutions of glucose, fructose and sucrose respectively into a vial.
Preparation of Mobile Phase
156.01mg of sodium phosphate was accurately weighed and dissolved in 100mL volumetric flask with distilled water to the mark to produce 10mM sodium phosphate (monobasic) solution. 78mL acetonitrile and 22mL 10mM sodium phosphate (monobasic) solution were mixed in a 250mL beaker. Degassing of solution was done by using ultrasonic bath.
Preparation of Sample from Fresh Fruit Juices
All fruits except for strawberries were peeled, and cut into small pieces. The fruits were then blended for 3- 5min at maximum speed with a homogenizer. The homogenate was vacuum-filtered through Whatman No.1 filter paper. Then, 12.5mL filtrate was diluted with acetonitrile and distilled water (50:50) in a 50mL volumetric flask to the mark. The diluted fresh fruit juice was filtered through C18 Sep-Pak cartridge. Total sugars of fresh fruit juices were contained in the eluate. The eluate was filtered through 0.45 µm nylon filter before HPLC analysis.
Preparation of Sample from Packed Fruit Juices
12.5 mL of packed fruit juice was diluted with acetonitrile and distilled water (50:50) in a 50mL
volumetric flask to the mark. The diluted packed fruit juice was filtered through C18 Sep-Pak cartridge. Total sugars of packed fruit juices were contained in the eluate. The eluate was filtered through 0.45µm nylon filter before HPLC analysis.
Result and Discussion
Table 1. Results of Percentage of Purity and Water Content on Fructose, Glucose, and Sucrose
| Tests | Fructose | Glucose | Sucrose |
|---|---|---|---|
| Purity (%) | 98.69 | 90.01 | 102.5 |
| Water Content (%) | 0.8862 | 9.2675 | 0.1357 |
Purity tests of fructose, glucose and sucrose were conducted to know the percentage purity of the standards. Purity test was done by comparing the peak area response of sample and analytical standard solutions. Water determination test was conducted for fructose, glucose and sucrose using Karl Fischer Method. Based on Table 1, purity of fructose, glucose and sucrose were 98.69, 90.01, and 102.5% respectively whereas water content of fructose, glucose and sucrose were 0.8862, 9.2675, and 0.1357%, respectively.
System suitability tests were applied to analytical instrument. They were designed to evaluate the components of the analytical system in order to show performance indicator of the system in comparison to standards required by the method. Repeatability, resolution, capacity factor, theoretical plate and tailing factor were some common parameters that used in system suitability parameters (Kazakevich and LoBrutto 2007; David 2005)
Table 2 showed results of inter-day test for fructose, glucose, and sucrose. The inter-day test of retention time and Area Under The Curve (AUC) for fructose, glucose and sucrose showed percentages of coefficient of variance of less than 2%. Hence, the inter-day test was fulfilled the requirement for repeatability.
Based on Table 3, values of resolution, capacity factor, theoretical plate and tailing factor for fructose, glucose and sucrose were fulfilled the requirement for each parameter.
Method validation of process was carried out to confirm that the method was suited for its intended use. Linearity, limit of detection, limit of quantification, precision, accuracy, and recovery, were the parameters involved in method validation process. (David et al. 2005; Ahuja and Dong 2005).
The calibration curve of fructose, glucose and sucrose was constructed by plotting peak area versus concentration. The peak area was measured as average peak area which was obtained from three replicates of each concentration. In Table 4, the percentage of coefficient of variance for each concentration of fructose, glucose and sucrose was less than 2%.
Table 2. Results of Inter-day Test for Fructose, Glucose, and Sucrose
| Fructose | Glucose | Sucrose | ||||||
|---|---|---|---|---|---|---|---|---|
| Sample | tR (min) | AUC | tR (min) | AUC | tR (min) | AUC | ||
| 1 | 8.733 | 3762052 | 10.013 | 3639734 | 14.600 | 3687240 | ||
| 2 | 8.773 | 3755846 | 9.993 | 3654855 | 14.587 | 3595730 | ||
| 3 | 8.727 | 3652159 | 9.987 | 3580006 | 14.560 | 3523888 | ||
| 4 | 8.727 | 3718690 | 9.987 | 3596950 | 14.560 | 3620536 | ||
| 5 | 8.673 | 3724392 | 9.927 | 3614296 | 14.427 | 3618626 | ||
| 6 | 8.547 | 3719256 | 9.740 | 3567071 | 13.973 | 3547333 | ||
| % CV | 0.921 | 1.051 | 1.033 | 0.945 | 1.676 | 1.618 | ||
*tR (Retention Time)
Table 3. Results of System Suitability Test for Fructose, Glucose and Sucrose
| Parameter | Fructose | Glucose | Sucrose | Requirement |
|---|---|---|---|---|
| Resolution | 10.064 | 2.017 | 6.196 | > 1.5 |
| Capacity Factor | 1.460 | 1.847 | 3.150 | 1 – 20 |
| Theoretical Plate | 4081 | 2460 | 5769 | > 2000 |
| Tailing Factor | 1.093 | 1.081 | 1.167 | 0.9 – 1.4 |
Table 4. AUC of Stand ard Solution for Fructose, Glucose and Sucrose
| Concentration | AUC | ||
|---|---|---|---|
| Concentration | Fructose | Glucose | Sucrose |
| 0.167 | 546890.667 | 527443.000 | 556941.667 |
| 0.5 | 1751401.667 | 1746825.000 | 1742849.333 |
| 0.833 | 3185830.333 | 3100595.333 | 3084566.667 |
| 1.167 | 4379239.000 | 4311246.667 | 4385018.000 |
| 1.5 | 5665955.333 | 5607440.000 | 5545969.000 |
| 1.833 | 6901607.667 | 6793668.000 | 6810993.667 |
Table 5. Results of Inter-day and Intra-day for Fructose
| Day | tR (min) | CV (%) | AUC | CV (%) | CV (tR) Intra-day (%) | CV (AUC) Intra-day (%) |
|---|---|---|---|---|---|---|
| 8.733 | 3762052 | • • • • • • • • • • • • • • • • • • • • | ||||
| 8.773 | 8.773 | 3755846 | ||||
| 1 | 8.727 | 0.921 3652159 1.051 | ||||
| 1 | 8.727 | 0.921 | 3718690 | 1.031 | ||
| 8.673 | 3724392 | |||||
| 8.547 | 3719256 | 1.104 | ||||
| 8.880 | 3740475 | 1.250 | ||||
| 8.767 | 3708196 | 1.024 | ||||
| 2 | 8.720 | 0.910 | 3707436 | |||
| 2 | 8.693 | 0.910 | 3741330 | 1.024 | 1.230 | 1.104 |
| 8.673 | 3696471 | |||||
| 8.673 | 3637714 | |||||
| 8.780 | 3825449 | |||||
| 8.767 | 3686158 | |||||
| 3 | 2 8.707 1.710 3715942 1.201 | 1.301 | ||||
| 3 | 8.667 | 1.710 3713942 1.30 3726348 3723996 | 3726348 | 1.301 | ||
| 8.480 | ||||||
| 8.433 | 3707677 |
Table 6. Results of Inter-day and Intra-day for Glucose
| Day | tR (min) | CV (%) | AUC | CV (%) | CV (tR) Intra-day (%) | CV (AUC) Intra-day (%) |
|---|---|---|---|---|---|---|
| 10.013 | 3639734 | _ | ||||
| 9.993 | 3654855 | |||||
| 1 | 9.987 1.033 3580006 0.945 | |||||
| 1 | 9.987 | 1.033 | 3596950 | 0.943 | ||
| 9.927 | 3614296 | |||||
| 9.740 | 3567071 | |||||
| 10.133 | 3650452 | |||||
| 10.027 | 3590183 | 1.329 1.84 | 1 945 | |||
| 2 | 9.980 | 0.821 | 3642876 | 0.844 | ||
| 2 | 9.947 | 0.821 | 3655404 | 0.844 | 1.643 | |
| 9.920 | 3637500 | |||||
| 9.920 | 3586810 | |||||
| 9.993 | 3771510 | |||||
| 10.013 | 3639734 | 0.625 | ||||
| 3 | 9.993 | 1.670 | 3654855 | |||
| 3 | 9.987 | 3580006 | 0.033 | |||
| 9.987 | ||||||
| 9.927 | 3614296 |
Linearity was a visual representation of the relationship between detector response and the analyte concentration. (Yuri and Rosario 2007) The sensitivity was directly derived from a response versus concentration plot. A very sensitive method had a large slope, so that a small change in concentration results in a large shift in the response. Meanwhile, a low sensitivity showed a small change in response for a similar change of concentration.
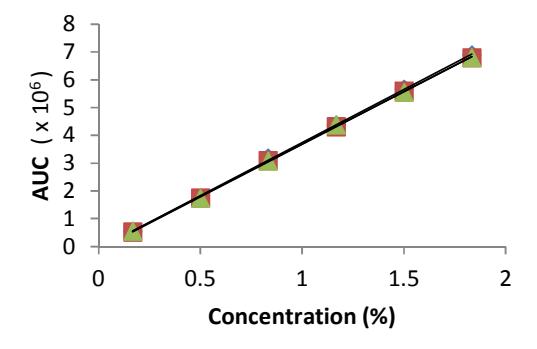
Figure 1. Calibration Curves of Fructose, Glucose and Sucrose.
From Figure 1 showed that the obtained regression equations for fructose, glucose and sucrose were y = 3833208.4806x - 94721.0361, y = 3782886.4708x - 101683.4708, y = 3770593.9638x - 82870.9083 with regression coefficients, \(r^2\) of 0.9995, 0.9997 and 0.9996 respectively. The calculated regression function coefficients, Vx0 for fructose, glucose and sucrose were 0.0152, 0.0112 and 0.0132 %. The requirement for linearity is \(r^2 \sim 1\) and Vx0 less than 2%. Hence, the requirement for linearity of fructose, glucose and sucrose were fulfilled.
Limit of detection (LOD) was the smallest amount of an analyte which can be detected by a particular method. Limit of quantification (LOQ) was the smallest amount of analyte which can be quantified reliably. A good LOD and LOQ had a value which was smaller than the lowest value in concentration range in calibration curve. (David 2005) The calculated LOD and LOQ from calibration curve for fructose, glucose and sucrose were 0.0457 and 0.1523, 0.0336 and 0.112, 0.0397 and 0.1324, respectively. Thus, the LOD and LOQ for fructose, glucose and sucrose had a value smaller than the lowest value in concentration range in calibration curve which was 0.167%.
Precision expressed the closeness of the agreement between a series of measurements obtained from multiple sampling of the same homogenous sample under the prescribed conditions. The precision was determined by calculating the percentage coefficient of variance for inter-day and intra-day. In general, the percentage coefficient of variance of less than 2% was desirable. (Ahuja and Dong 2005) Based on Table 5, Table 6 and Table 7, the percentage of coefficient of variances for inter-day and intra-day of retention time and AUC show less than 2%. Thus, the requirement of precision was met.
Table 7. Results of Inter-day and Intra-day for Sucrose
| Day | tR (min) | CV (%) | AUC | CV (%) | CV (tR) Intra-day (%) | CV (AUC) Intra-day (%) | |
|---|---|---|---|---|---|---|---|
| 14.600 | 3687240 | ||||||
| 14.587 | 14.587 3595730 | ||||||
| 1 | 14.560 | 1.676 | 3523888 | 1.618 | 1 610 | ||
| 1 | 14.560 | 1.070 | 3620536 | ||||
| 14.427 | 3618626 | ||||||
| 13.973 | 3547333 | - | |||||
| 14.747 | 3578225 | ||||||
| 14.640 | 3615586 | ||||||
| 2 | 14.560 | 0.821 | 0.627 | 1.868 1. | 1.461 | ||
| 2 | 14.493 | 3643338 | 0.037 | 1.000 | 1.401 | ||
| 14.440 | 3598837 | ||||||
| 14.453 | 3609794 | ||||||
| 14.440 | 3715819 | ||||||
| 14.413 | 3688972 | ||||||
| 3 | 14.360 | 1.972 | 3695772 | 0.707 | |||
| 3 | 14.133 | 1.972 | 3678408 | 0.707 | |||
| 13.880 | 3637320 | ||||||
| 13.800 | 3686271 |
Table 8. Results for Accuracy and Precision in Apple Juice
| Components | C (%) | Average AUC | C' | Recovery (%) | Average Recovery (%) | CV (%) |
|---|---|---|---|---|---|---|
| 0 | 2677542.000 | 0.723 | ||||
| Fructose | 0.5 | 4338870.333 | 1.157 | 86.681 | 88.572 | 1.896 |
| Fructose | 1 | 6094727.667 | 1.615 | 89.147 | 1.890 | |
| 1.5 | 7845935.000 | 2.072 | 89.888 | |||
| 0 | 1864804.667 | 0.520 | ||||
| C1 | 0.5 | 3508422.667 | 0.954 | 86.898 | 88.836 | 1.906 |
| Glucose | 1 | 5253554.333 | 1.416 | 89.581 | ||
| 1.5 | 6973367.000 | 1.870 | 90.029 | |||
| 0 | 5027264.333 | 1.355 | ||||
| Sucrose | 0.5 | 6809644.333 | 1.828 | 94.541 | 06150 | 1 7 10 |
| 1 | 8648328.333 | 2.316 | 96.034 | 96.153 | 1.742 | |
| 1.5 | 10563505.000 | 2.824 | 97.885 |
Table 9. Results of Fructose, Glucose, and Sucrose Contents in Packed Fruits
| Packed | Concentration (%) | |||||
|---|---|---|---|---|---|---|
| Juices | Fructose Glucose Sucrose | |||||
| Orange | 0.469 | 0.454 | 1.861 | |||
| Apple | 0.714 | 0.468 | 1.389 | |||
| Kiwi & | 1.303 | 1.233 | 0.889 | |||
| Grape | ||||||
| Strawberry | 1.222 | 1.169 | 0.556 | |||
| Guava | 1.431 | 1.286 | 0.544 | |||
Table 10. Results of Fructose, Glucose, and Sucrose Contents in Fresh Juices
| Packed | Concentration (%) | |||||
|---|---|---|---|---|---|---|
| Juices | Fructose Glucose Sucrose | |||||
| Orange | 0.309 | 0.261 | 0.898 | |||
| Apple | 1.587 | 0.745 | 0.334 | |||
| Kiwi & | 0.826 | 0.762 | 0.324 | |||
| Grape | ||||||
| Strawberry | 0.466 | 0.357 | 0.063 | |||
| Guava | 0.579 | 0.285 | 0.505 | |||
Accuracy was an agreement between the result obtained with method being validated and an accepted reference value. Accuracy was reported as percentage recovery in relation to known amount of analyte added to the sample or as the difference between the known amount and the amount determined by analysis (Yuri and Rosario 2007; Ahuja and Dong 2005). Therefore, the percentage recovery of fructose, glucose and sucrose added into the apple juice was calculated. The precision of sample was determined by calculating the percentage coefficient of variance. The percentage of coefficient of variance of less than 2% was desirable.
Based on Table 8, the percentage recovery of fructose, glucose, and sucrose using standard addition method was found to be in a range of 86.681 – 89.888, 86.898 – 90.029, and 94.541 – 97.885 %. The percentage of coefficient of variances for fructose, glucose, and sucrose were 1.896, 1.906, and 1.742%. The percentage of coefficient of variances were less than 2%. Thus, the precision of sample was met.
Results of fructose, glucose and sucrose in packed juices were shown in Table 9. Guava juice contained the highest percentage of fructose and glucose, but contained the lowest percentage of sucrose. Orange juice contained the highest percentage of sucrose, but contained the lowest percentage of fructose and sucrose.
Table 10 showed the results of fructose, glucose, and sucrose contents in fresh juices. Orange juice contained the lowest percentage of fructose and glucose, but contained the highest percentage of sucrose. While apple juice and kiwi juice contained the highest percentage of fructose and glucose
respectively. Strawberry juice contained the lowest percentage of sucrose.
Conclusion
High performance liquid chromatography was suitable to determine sugar content in fruit juices. The optimum conditions for the analysis were as follow: a NH2 polar bonded phase column, 10 µm (250 mm × 4.6 mm I.D.) and the column temperature was 43.5 °C, a mobile phase composed of acetonitrile and 10mM sodium phosphate (monobasic) solution (78:22), a flow rate of1.0mL/min, a Refractive Index detector, and injection volume was 20 µL. The method validation showed good linearity of equations for fructose, glucose and sucrose were y=3833208.4806x–94721.0361, y=3782886.4708x– 101683.4708, y=3770593.9638x–82870.9083 with regression coefficients, r2 of 0.9995, 0.9997 and 0.9996 respectively. The calculated regression function coefficients, Vx0 for fructose, glucose and sucrose were 0.0152, 0.0112 and 0.0132 %. The percentage recovery of fructose, glucose, and sucrose was found to be in a range of 86.681 – 89.888, 86.898 – 90.029, and 94.541 – 97.885 %. Fructose, glucose and sucrose of fresh juices contained 0.469 – 1.431, 0.454 – 1.286, 0.544 – 1.861 %, whereas that of packed juices contained 0.309 – 1.587, 0.261 – 0.762, 0.063 – 0.898 %, respectively.
References
Ahuja S, Dong MW, 2005, Handbook of Pharmaceutical Analysis by HPLC, 6th ed., Elsevier Academic Press, London, 19-45.
Angustin MA, Khor KL, 1986, Determination of Sugars in Soft Drinks by HPLC, Pertanika 9(1): 119- 123.
Bazzano LA, 2004, Dietary Intake of Fruit and Vegetables and Risk of Diabetes Mellitus and Cardiovascular Disease, dissertation, Department of Medicine, Beth Israel Deaconess Hospital, 1-66.
David GW, 2005, Pharmaceutical Analysis, 2nd ed., Elsevier Churchill Livingstone, Philadelphia, 1-17 & 267-314.
Graves F, Peckham J, 1995, Sugar: Functional Properties and Physical Attributes in Food, Canadian Sugar Institute 99: 114-126.
Ellefson W, 2002, Current Protocols in Food Analytical Chemistry: HPLC Of Mono- and
Disaccharide Using Refractive Index Detection, John Wiley & Sons Inc., E1.2.1–E1.2.9.
Ferrier RJ, 2003, Carbohydrate Chemistry, 34th ed., The Royal Society of Chemistry Cambridge, 33-54.
Kazakevich Y, LoBrutto R, 2007, HPLC for Pharmaceutical Scientists, 1st ed., John Wiley & Sons, Inc., New Jersey, 459-495.
Perez AG, Olias R, Espada J, Olias JM, Sanz C, 1997, Rapid Determination of Sugars, Non-Volatile Acids, and Ascorbic Acid in Strawberry and Other Fruits, J. Agric. Food Chem. 45(9): 3545-3549.
Sheldon Z, 2004, The Best of Health, Warren H. Green Inc., U.S.A., 326-327.
Yuri K, Rosario L, 2007, HPLC for Pharmaceutical Scientists, 1st ed., John Wiley & Sons Inc., U.S.A., 459-495.