

PENGARUH MADU PADA MENCIT SWISS WEBSTER (MUS MUSCULUS) SEHAT DAN DIABETES TERINDUKSI ALOKSAN DENGAN ATAU TANPA GLIBENKLAMID
*Correspondence
ABSTRAK
Andy S. Ifada diyah.ifada@gmail.com
Madu merupakan zat alami yang diketahui memiliki banyak manfaat seperti sebagai antibakteri dan peningkat energi untuk mengobati diabetes. Penelitian ini bertujuan untuk mengetahui efek madu terhadap kesehatan dan mencit diabetes terinduksi aloksan. Penelitian ini terdiri dari uji kualitas madu, uji toleransi glukosa (UTG) dan diabetes terinduksi aloksan. Pada UTG, mencit sehat diberikan madu murni, madu 20% dan 50%, dimana kadar gula darah diukur setiap 30 menit selama 3 jam. Mencit diinduksi aloksan dosis 50 mg/kg bb untuk mendapatkan kadar gula darah rentang 400-500 mg/dL. Madu dan kombinasinya dengan glibenklamid diberikan selama 21 hari. Glibenklamid dosis 0,65 mg/kg bw digunakan sebagai obat standar. Kadar gula darah diukur pada hari ke-10, 17, dan 24. Selanjutnya, hewan dikorbankan dan pankreas diisolasi. Madu murni, madu 20%, dan 50% menunjukkan peningkatan kadar gula darah dimana mencit yang diberikan madu murni berada pada kadar normal yaitu 140 mg/dL hingga 180 menit pengamatan, berbeda secara signifikan dari kelompok glukosa 20% (p<0,05). Madu dan kombinasinya dengan glibenklamid pada mencit diabetes terinduksi aloksan tidak menyebabkan penurunan kadar gula darah secara signifikan terhadap kelompok sakit (p>0,05). Madu menjadi kadar gula darah pada mencit sehat pada kadar normal 140 mg/dL hingga 180 menit. Pada uji diabetes terinduksi aloksan, baik mencit yang diberikan madu ataupun kombinasinya dengan glibenklamid tidak menunjukkan penurunan kadar gula darah secara signifikan berbeda terhadap kelompok sakit.
Kata kunci: Diebetes mellitus, madu, aloksan, uji toleransi glukosa
INTRODUCTION
Increasing cases of Diabetes Mellitus should be followed by public awareness not only in treatment but also diet, especially the habit of consume high sugar food. International Diabetes Federation (IDF 2015) estimates there are 415 million people, or about 8.8% of the world population aged 20-79 years living with diabetes in 2015, where about 193 million people undiagnosed. This number is expected to rise to 10.4%, or about 642 million by 2040. Indonesia is in the seventh position in the world by the number of people with diabetes reach 10 millions.
Honey as a natural substance that has been known to have many benefits such as antibacterial and energy enhancer is often promoted to help treat diabetes. Studies on the efficacy of honey have been done, one by Erejuwa et al (2012) who explained that honey can help improve the condition of diabetes mellitus due to the content of antioxidant compounds which counteract free radicals that damage beta cells of the pancreas. This is interesting because diabetes is a pathological condition in which blood glucose levels are above normal values so that the administration of a substance containing a high percentage of sugar in fear it would worsen the patient's condition.
This study was conducted to see the effect of honey on healthy animals and animals with diabetes. In diabetic animal, honey given as a single and a combination with oral antidiabetic glibenclamide. Honey used is an origin honey from Sumbawa, West Nusa Tenggara.
MATERIALS AND METHODS
Honey of Apis dorsata from Sumbawa, which has been done the quality test refer to the documents of Standar Nasional Indonesia (SNI) 3545: 2013, technical grade of glucose and fructose, distilled aqua, alloxan, Na CMC, 70% ethanol, formalin solution, glibenclamide, and glucose test strips One Touch Ultra®. Measurement of blood glucose levels using a glucometer One Touch Ultra®. Male Swisswebster mice (Mus musculus), aged 2-3 months, weighing 25-35 grams were used with the approval of Animal Research Ethics Committe-Institut Teknologi Bandung. Animals were healthy and have normal activity. They were fed standard pellet diet and water ad-libitum.
Glucose Tolerance Test
Mice were fasted overnight (16 hours) but still have a drink, pedestal chaff replaced with sawdust. Each mouse was weighed to determine the administration volume and initial blood sugar
levels was measured. Solution of 20% glucose given orally using sonde. Blood sugar levels are measured again every 30 minutes up to 180 minutes. After blood sampling at minutes of 180, the animals are fed. The same test carried out on the substances 20% fructose, 20% and 50% honey and pure honey. While the negative control group was only given NaCMC suspension.
Alloxan-induced Diabetic
Animals injected alloxan monohydrate (50 mg/kg bw) which dissolved in normal saline. Normal group injected physiological saline. Before induction, the animals fasted overnight but still given water ad libitum and the initial blood glucose level has to measured. Every day the animals were observed to see the symptoms diabetes such as polyphagia, polydipsia and polyuria. Three days after the induction of alloxan, the blood glucose levels were checked. Mice with blood glucose values were significantly different from the normal group can be used in this study. Blood glucose levels were measured on days as follows 10, 17 and 24. The diabetic mice were divided randomly into six groups of five mice they were:
Group 1a served as sore group (only given NaCMC) Group 1b mice were given standard antidiabetic drug glibenclamide
Group 2a mice were treated by glibencamid + honey 0.2 mL/20 g BW (pure honey)
Group 2b mice were treated by glibenlamid + honey 0.1 mL/20 g BW (honey diluted 50%) Group 3a mice were given honey 0.2 mL/20 g BW Group 3b mice were given honey 0.1 mL/20 g BW
Collection of blood samples from the animal
Animals put in a restrainer and left tail dangling out. The area over the tail was cleaned with antiseptic scrub. The blood samples were obtained by injuring tail using a syringe equipped with 27 gauge needle. First blood came out was cleaned and blood that comes out next absorbed using strip test. Blood volume that is absorbed in accordance with the needs of One Touch Ultra® glucometer.
Pancreatic Histology
Pancreatic histological preparations made using trichrome staining to differentiate alpha cells and beta cells of the pancreas Langerhans islands.
Parameters
Body weight of the animals was noted in everyday. Blood glucose levels were measured on days 10, 17 and 24. Pancreatic histology was conducted for some representative animals.
Table 1. Blood glucose levels of mice on glucose tolerance test
| Groups | Blood glucose level (mg/dL), minute | |||||||
|---|---|---|---|---|---|---|---|---|
| 0 | 30 | 60 | 90 | 120 | 150 | 180 | ||
| Glucose 20% | 88,50±9,88 | 145,00±6,37a | 130,00±12,62 | 125,50±7,93 | 119,50±12,36 | 109,00±10,64 | 101,00±7,11 | |
| Fructose 20% 102,25±21,60 | 127,00±25,01a 127,50±21,25 | 122,25±16,66 | 120,00±19,25 | 119,25±12,03 | 110,50±17,25 | |||
| Honey 20% | 86,00±22,55 | 154,75±25,41a 137,75±26,89 | 125,00±30,01 | 116,25±27,83 | 107,00±24,58 | 106,00±23,02 | ||
| Honey 50% | 83,00±17,26 | 152,25±33,18a 167,00±40,60 | 145,00±30,62 | 127,00±29,40 | 128,75±27,80a | 135,25±37,66ab | ||
| Pure Honey | 83,00±14,85 | 141,75±35,41a 163,50±31,72 | 160,50±22,39 | 145,75±22,76 | 145,00±29,94ab | 140,00±33,24ab | ||
| Control (-) | 84,75±15,56 | 100,75±25,90 | 94,75±11,20 | 84,75±23,59 | 80,00±25,36 | 62,75±18,24 | 63,75±15,52 | |
statistically different (p<0,05) compared to control (-) statistically different (p<0,05) compared to glucose 20%
Table 2. Blood glucose levels of aloxan-diabetic mice
| Groups | Blood Glucose Levels (mg/dL) in treatment period (day) | |||||||
|---|---|---|---|---|---|---|---|---|
| 0 | 3rd | 10th | 17th | 24th | ||||
| Normal | 103,33±20,98 | 106,67±32,08* | 75,67 ± 9,61* | 61,67 ± 11,01* | 82,00 ± 8,54* | |||
| 1a | 114,33±17,61 | 475,67±28,02 | 360,33 ±126,67 | 373,00 ± 91,01 | 395,00 ± 80,98 | |||
| 1b | 91,33±23,11 | 480,33±37,00 | 216,67 ±100,28 | 190,33 ± 89,80* | 166,00 ± 70,02* | |||
| 2a | 104,67±20,84 | 501,67±38,83 | 415,00 ± 82,48 | 436,33 ±100,77 | 370,33 ± 94,29 | |||
| 2b | 115,67±20,55 | 484,67±38,42 | 365,33 ±111,56 | 405,67 ± 52,08 | 281,67 ± 42,36 | |||
| 3a | 107,67± 4,51 | 490,67±18,55 | 401,00 ± 55,97 | 371,67 ± 23,28 | 318,67 ±104,21 | |||
| 3b | 105,67±13,20 | 485,33±59,60 | 368,00 ± 82,71 | 346,00 ± 79,05 | 362,67 ± 5,68 | |||
*) statistically different (p<0,05) compared to sore group
RESULTS AND DISCUSSIONS
The sugar content in this honey amounted to 63.50%, this level is a total reducing sugar content, where the percentage is still smaller than the value of reducing sugar levels specified in SNI 3545: 2013. The content of glucose and fructose in a wide variety of honey varies greatly but still in very high numbers between 65-70% (SNI 2013). Glucose tolerance test used pure glucose and fructose in concentration of 20% and also pure honey and honey diluted 20% and 50%.
Table 1 shows all groups that given contained sugar can increase blood glucose levels in the 30th minute which was statistically different to control group (-). The increase of blood glucose values in the control group (-) possibility is the body's normal response to stressful situations in which substances administered orally using sonde, it was not significantly different compared to the value of blood glucose levels before being treated. This is supported also by a decrease in blood glucose levels immediately in the control group (-). The blood glucose level falls to the lower value
compared with the value in minutes 0. Honey in various concentrations indicate a difference in blood glucose level rises.
Honey diluted 20% showed patterns of change in blood glucose levels equal to 20% glucose administration, while the pure honey and honey 50% have shown increases in blood glucose levels in the minute 30 and achieve the highest level on the minute 60.
Due to the results on GTT, pure honey and honey diluted 50% were used in alloxan diabetic-mice. These substances were given as a single and combination with glibenclamide
Table 2 shows that he highest blood sugar levels decrease occurred in the group receiving glibenclamide only. While the group treated with honey and combination glibenclamide with honey did not show any significant differences with the sore group.
According to the table and graph above shows that honey treatment, single or in combination with standard drugs are not able to lowering blood
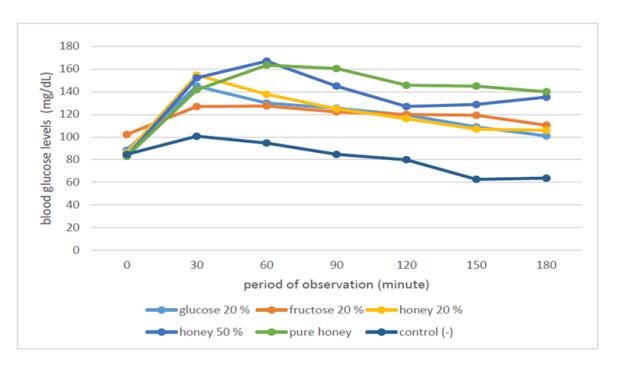
Figure 1. Chart of blood glucose level declines on glucose tolerance test.
glucose levels closer to normal values as the decline that occurred with the administration of glibenclamide.
After 24 days treatment, animal were sacrified and pancreas were isolated to carried out pancreatic histology.
According to Figure 1, minutes 60 is the peak of blood glucose levels. Then, it was the time when blood glucose levels decrease in all groups. However, blood glucose levels in the group receiving the pure honey and honey 50% experienced a slower decline than other groups. The group that received honey despite decreased blood glucose levels, but generally the blood glucose levels are still high. Observations until minute 180 showed level of blood glucose in 140 mg / dL, where the value is still higher than the results of testing of blood glucose levels in healthy male Swiss-Webster mice using the same glucosemeter tool(Soemardji 2004).
However, this high value is still considered a normal value according to the literature (Mitruka and Rawnsey 1977) which states normal blood glucose levels in mice ranges from 68-175 mg / dL. High levels of blood glucose that gets the honey group has shown that honey has a high sugar content. Besides that the metabolism of sugars contained in honey is not as fast as metabolism of glucose, honey has been known to contain more fructose than glucose.
Alloxan diabetes is one of the easiest way to establish animal models of diabetes. Research on chemicals that can cause diabetes in animals was done by Creutzfeldt Frerichs. This type of diabetes is generally based on the condition of insulin deficiency due to the chemicals that destroy pancreatic β cells (toxicity to cells β). Hyperglycemia and glucosuria after administration of alloxan seen in some species such as dogs, rabbits, rats and other species (Muller 2008) . These symptoms were also observed in mice in this study. In addition, the normal group is important in pharmacological testing to see the
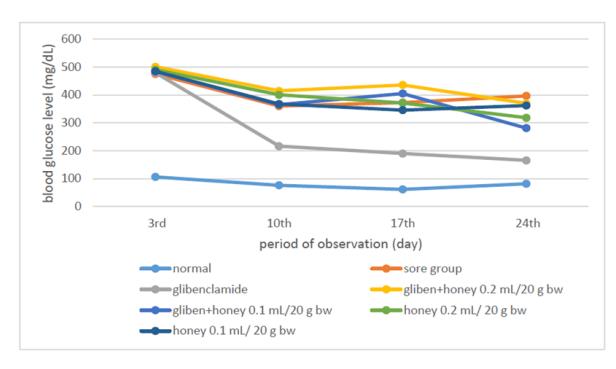
Figure 2. Changes in blood glucose level on alloxan diabetic-mice
success of induction. Alloxan induction dose of 50 mg / kg bw cause a rise in blood glucose levels between 400-500 mg / dL, where the value is significantly different from the normal group. Blood glucose levels are high enough this resulted in the death of some animals in the sore group (group induced of alloxan but only given suspension Na CMC), while the other group were given glibenclamide, glibenclamide + honey 0.2 mL/ 20 g bw, glibenclamide + honey 0.1 mL/ 20 g bw, honey 0.2 mL / g bw and honey of 0.1 mL / g bw there is no death. In addition to the measurement of blood glucose levels has also been conducted weighing the weight of the animals every day in which the weighing results showed that the body weight of the animals did not change significantly after administration of glibenclamide, honey or a combination of glibenclamide with honey for 21 days.
Until observations on the 24th day, the group given a honey and a combination of glibenclamide + honey were still showing a high blood glucose levels. In the group of a combination honey + glibenclamide 0.1 mL / 20 g BW, blood glucose levels day-24 decrease compared with the initial glucose values, but not statistically significantly different from the sore group. Based on Table 2 and Figure 2 above showed that honey treatment, alone or in combination with standard drugs are not able to lower blood glucose levels closer to normal values as the decline that occurred with the administration of glibenclamide. This indicates that the honey as an ingredient with high sugar content potentially raise blood glucose levels.
While Figure 3 shows that all groups of animals who initially had conditions of hyperglycemia induced by alloxan can decrease blood glucose levels with or without treatment of glibenclamide. But the decline did not differ significantly from the initial conditions. This is important in pharmacological testing, in which the existence of the sore group can validate effects resulting from the administration of the test material and the comparator drugs. The substance was said to have an effect if they describe different values when
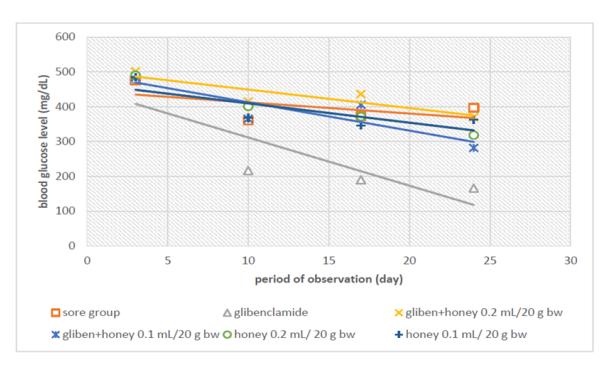
Figure 3. Changes in blood glucose level on alloxandiabetic mice on linear regression
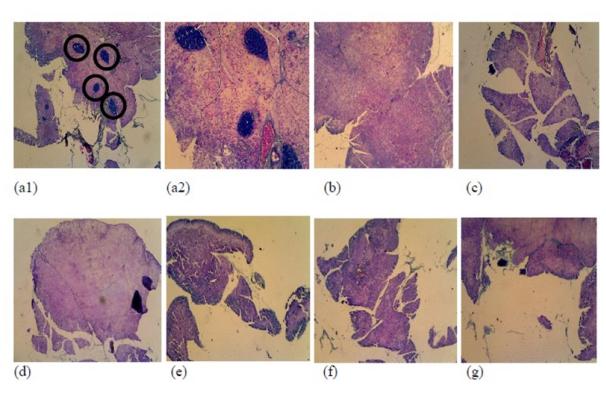
Figure 4. Pancreatic histological of mice with trichrome staining (a1) (a2) normal; (b) sore; (c) glibenclamide; (d) glibenclamide + honey 0.2 mL / 20 g bw; (e) glibenclamide + honey 0.1 mL/ 20 g bw; (f) Honey 0.2 mL / 20 g bw; (g) honey 0.1 ml / 20 g bw (magnification of 40, except (a2) magnification of 100).
compared with the pain group. The use of comparator drugs can show whether the test method used was appropriate. The giving of glibenclamide showed a decrease in blood glucose levels. Glibenclamide is an antidiabetic drug that has activity decrease in blood glucose levels which quite large.
The histology of the pancreas in Figure 4 was done to see the condition of the islands of Langerhans in animals with diabetes mellitus induced by alloxan. The observation of pancreatic histology showed that there is a real difference between the normal group (not induced alloxan) compared to group induced alloxan. Langerhans was difficult to found in all the groups who have diabetes mellitus induced by alloxan, even in those who experienced a decrease in blood glucose levels after therapy. A decrease in blood glucose levels in the group receiving glibenclamide therapy is not associated with an improvement in the beta cells of the pancreas.
CONCLUSIONS
Honey maintains blood glucose levels of healthy mice on a normal value of 140 mg / dL until 180
minutes. In alloxan diabetes test, combination of glibenclamide and honey did not show a decrease in blood glucose levels that significantly different to the sore group. Honey treatment combination with glibenclamide may affect the action of glibenclamide. In other words, when a material containing high levels of sugar was given to diabetic-animals that undergoing treatment with oral antidiabetic such as glibenclamide, then the drug's ability to lower blood glucose levels will be difficult to be observed because there is a tendency in blood glucose levels remain high because of sugar intake.