
INTRODUCTION
Problem-based learning (PBL) is one of the educational methods used at the Christelijke Hogeschool Nederland (CHN) in Leeuwarden, the Netherlands. The system has been used at CHN since 1987. In 1969, PBL as a method was introduced at the Medical School of McMaster University in Hamilton, Canada. Barrows (1988), one of the founders of this educational method, formulates the most important advantages as follows: in problem-based learning, three important goals of professional education are advanced at the same time: acquiring knowledge that can be retrieved and applied, learning to learn (self-directed learning) and learning to analyze and solve problems. Problem-based learning (PBL) is an approach to professional that stresses the use of real - life problems as a stimulus for learning (Van Berkel & Schmidt, 2000, p. 231). The introduction of PBL in a professional school has serious consequences for the way in which student's learning process is organized (Van Berkel & Schmidt, 2000). The realities of the PBL system require a suitable attitude of both students and tutors. The success of PBL is determined by tutors' role and student participation in PBL sessions.
The International Hospitality Management (IHM) - a part of CHN - is a four-year undergraduate program. The IHM admits 350 students annually. Each of the first three years consists of six
Address correspondence to Lintje Siehoyono, Petra Christian University, Hotel Management, Jl. Siwalanmkerto 121- 131, Surabaya, 60236, Indonesia. Tel (031) 8494830-31, Fax (031) 8491868. E-mail: slintje@peter.petra.ac.id
integrated thematic problem-based modules of six weeks each. The fourth year is a 10-month industrial placement. In PBL system, students have two meetings per week, each meeting lasting 100 minutes (Eringa, et al., 2002). In the curricula of the CHN, the academic year is divided into periods of six weeks, called "themes" or "modules". Each module covers one particular theme, such as the "Hospitality Experience" in the first year program or "Operation Management" in the second year program. An interdisciplinary team of teachers called "module teams" is responsible for the module's contents and produces what are called, "module books". The module book contains all the "tasks" relevant to module's themes. Moreover, it includes relevant references to textbooks or other learning resources such as articles in magazines, journals, videotapes, computer programs specifically Excel and SPSS or on-line searches that are provided as "tools" in school. Students meet twice a week together in "groups" of eight to fourteen students in called "PBL group". These tutorial groups are randomly formed and their composition change after each module. Each group has a member of staff as a "tutor". The tutor has the task of controlling the quality of the work within the group, without concerning him/herself with the content of discussion. In other words, despite tutors are not experts they still supervise and answer questions during the session. As illustrated by Barrows (1988) and Solomon (1994 cited in Schmidt et al., 1992), in problem-based format, the teacher forsakes his or her accustomed role as authoritarian instructor and, instead, becomes a tutor, whose responsibility is to act as a facilitator of the group learning process, not to impart information or dictate the course of learning. The ability of a tutor to guide the learning process and offer appropriate feedback is critical in the success of the problembased design (Barrows, 1988). The tutor's task is to stimulate discussion, to provide students with some subject matter information whenever necessary to evaluate progress being made, and to monitor the extent to which group member contributes to the group's objectives.
Students will deal with a problem or a task, using prior knowledge or "talent" in an initial effort to understand it. The purpose of this first attempt is to activate prior knowledge and elaborate on what is known to build a provisional model or "theory" of the phenomena described in a given problem (Schmidt et al., 1989 cited in Van Berkel & Schmidt, 2000). Furthermore, the students may be required to formulate questions, purposes or learning goals for self-directed learning activities and engaged usually for two days, in individual study. As mentioned by Allen et al. (1996 cited in Miller, 2001), problem-based learning requires students to work in small groups to solve the case problem and meet the learning objectives. The students must be self-directed, that is, they must be willing to take on the responsibility for their own learning and act on it (Albanese & Mitchell, 1993; Vernon & Blake, 1993 cited in Miller, 2001).
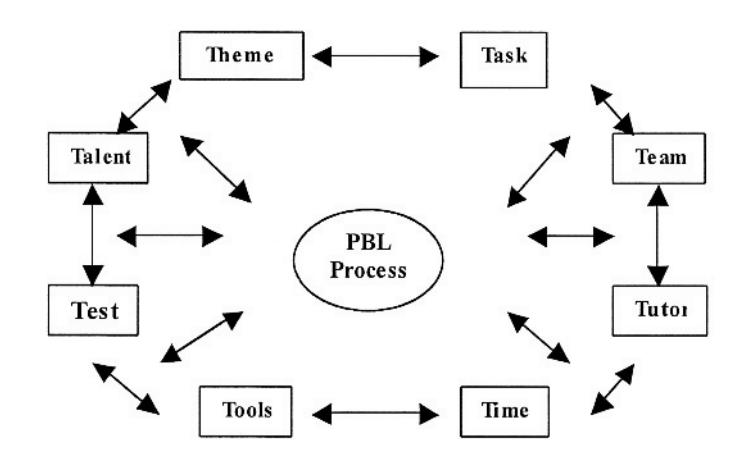
During the two-days of individual study, the students will spend their "time" to use the facilities or "tools" as learning resources in the school in order to find relevant references for giving solution to their learning goals. Students are encouraged to use as many and varied learning resources as possible, including textbooks, journals, the internet, videos, faculty members, other students, as well as traditional lectures (Miller, 2001, p.31). Subsequently, students meet again and share knowledge gained, exchange points of view, and make clear on the subjects that may be vague to some. As mentioned by Albanese & Mitchell (1993) and Vernon & Blake (1993), students are expected to engage in collaborative independent study, in which they each take responsibility for dealing with a part of the problem individually, and then share information and insights with other members of the group. When a problem has been sufficiently solved, the group will proceed to the next problem, and so on. At the end of the module, final module assignments usually will be used as summative evaluation to measure knowledge that student have acquired during the module. As summary, the process of PBL is illustrated in the Figure 1 below. It is called the drivers of Problem-Based Learning (Zwaal, 2001).
Through the development of multicultural competencies within the areas of awareness, knowledge, and skills, the probability of teachers using assessment and treatment strategies that meet the needs of a wide range of culturally diverse group increases. The need for flexible and culturally sensitive assessment techniques have continued to be stressed by many in the field (Facundo et al., 1994; Nuttal et al., in press). The IHM in the CHN, Leeuwarden develops instruments to assess the performance of both activities in the school setting and the activities in hospitality operations in a project called "Assessing Competencies in the School for Hotel Management." The implementation of this new assessment approach meant training and coaching 1,100 students and 60 tutors in assessment and feedback. Both students and staff have international backgrounds; 25% of the students are not Dutch, coming from 42 different countries. A growing number of students comes from China (60 students annually), and other Asian countries. In addition, there is more or less about 25% of IHM staff are non-Dutch with 29 countries of origin, ranging from Jamaica to Turkey, France, Indonesia, USA and Russia (Eringa et al., 2002).
Since most group activities in PBL requires a variety of skills and knowledge, heterogeneous groups may have some advantage over homogenous groups. Shaw (1976) has claimed that when a group is heterogeneous in terms of gender, personalities, opinions, abilities, skills and perspective, there is an increased probability that the group will possess the needed characteristics to complete its tasks effectively (p. 356). As supported by Robbins (2000), he concludes that heterogeneous groups - those composed of dissimilar individuals - would be more likely to have diverse abilities and information, even though they may have more conflicts because of diverse positions and backgrounds, but evidence generally supports the conclusion that heterogeneous groups perform more effectively than do those that are homogeneous (p. 96).
Diversity created by racial or national differences affects groups' performance. In business settings, evidence indicates that these elements of diversity interfere with group processes, at least in the short term (Watson, et al., 1993, pp. 590 - 602). According to Robbins (2000), although cultural diversity seems to be an asset on tasks that call for a variety of viewpoints, members of culturally heterogeneous groups have more difficulties in learning to work with each other and solving problems. The good news is that these difficulties seem to dissolve with time. Watson et al., (1993) strengthens this idea by claiming that although in the beginning newly formed culturally diverse groups do not perform as well as newly formed culturally homogeneous groups, the differences disappear after about "three months." Although it may take more time to reach a decision (Hoffman, Harburg & Maier, 1962 cited in NCRVE, 1999) heterogeneous groups are more likely to seek a full range of possible solutions to the problem than a homogeneous group (Ellis & Fisher, 1994 cited in NCRVE, 1999). Given the suggestions that heterogeneous groups need at least three months' to reach their full capacity than homogeneous groups, and that thematic PBL modules are carried out in only one and a half months per theme, it is questioned whether heterogeneous groups could perform to their full.
Studies by Chang (1996, 1999) and Sax (1996) have specifically examined whether the ethnic or gender composition of the students on a campus, in an academic major, or in a classroom has the educational benefits claimed by Rudenstine, Bollinger and others (cited in Terenzini et al., 2001, p. 511). Chang's analysis exposes the relationship among structural diversity, student interactions and experiences, and educational outcome. He discovers that there is a cause-effect relationship between a campus's ethnic heterogeneity and learning outcomes through students' diversityrelated experiences, particularly, socializing with peers from different racial/ethnic backgrounds. Whether the degree of ethnic diversity of a campus or classroom has direct effect on learning outcomes, however, remains an open question (Terenzini et al., 2001).
According to Terenzini et al. (2001), there is a shortage of information on the role of ethnic composition in a classroom toward students' learning outcomes. Most studies examine diversity's influence on various dimension of students' psycho-social development, including (but not limited to) racial/ ethnic attitudes and values, academic and social self-concepts, civic behaviors and racial /ethnic awareness and knowledge. Moreover, there are only far fewer studies such as by Cohen, 1994; Cohen et al., 1997; MacPhee et al., 1994; Slavin, 1995 (cited in Terenzini et al., 2001) explore the influence of diversity in the classroom or in other small groups on students' development of academic or intellectual knowledge and skills.
Furthermore, Terenzini et al. (2001) in the findings of their study suggests that the relation between diversity and student learning is at least "modestly detectable" in individual classrooms (p. 528). This leads to the purpose of this study that are (1) to examine whether there is a relationship between cultural composition of the PBL groups (the first and second year students) and students' performance as evaluated by the IHM assessment instrument, (2) to identify the factors contributing to significant difference in the result of student performance and (3) to investigate the influence of student gender, tutor backgrounds and student attendance may influence the assessment.
The cultural composition of the PBL groups in this study is defined as either homogenous or heterogeneous. The dimension that is used to differentiate these categories of group is country of origin (nationality). However, it cannot be refuted that cultural differences can be influenced not only by country of origin or ethnics but also how long a student has been living in the present country which is not considered in this study. The examination of cultural composition of the PBL groups is important to this study in identifying factors contributing to significant difference in the result of students' performance. Students' performance is evaluated using IHM assessment instrument at the end of every PBL session (PBL points). It is hoped that the result of evaluation will demonstrate the same level as shown in the final assessment (learning outcomes), which is shown in the result of total points at the end of the module (total points).
The study also investigates different background of the students (gender), tutor (tutors' nationality, gender and level of experience) and group attendance may influence the process and the result of the assessment. The study is focused on two important drivers of the PBL process namely students and tutors.
METHOD
Four indicators of heterogeneity were applied in this research based on the previous studies by Terenzini et al. (2001) and Eringa et al. (2002). Student performance was measured by learning process assessment (PBL participation points) and learning outcomes assessment (Total points for the module). Eight hypotheses were tested based on two levels of group cultural compositions. The first four hypotheses were examined based on "student nationalities" (Dutch and non-Dutch students), regardless which PBL groups the students belong to, within the module:
- l. There is a significant mean difference between student nationalities (Dutch students and non-Dutch students) on student performance.
- 2. There is a significant relationship between student gender and student performance.
- 3. There is a significant relationship between the tutor backgrounds (gender, nationality and level) and student performance.
- 4. There is a significant relationship between student nationalities and student attendance.
The second four hypotheses were examined based on group cultural compositions both for "culturally homogeneous groups and culturally heterogeneous groups" (group level):
- 5. There is a significant mean difference between the cultural compositions of groups and student performance.
- 6 There is a significant relationship between the compositions of student gender within the group and student performance.
- 7. There is a significant relationship between the tutor backgrounds (gender, nationality and level) and student performance in the group.
- 8. There is a significant relationship between cultural compositions of the PBL groups and student attendance.
Table 1 Research Hypotheses
| Hypot | hesis . |
|---|---|
| H1 | There is a significant mean difference between student nationalities (Dutch students and non- |
| Dutch students) on student performance | |
| H2 | There is a significant relationship between student gender and student performance |
| H3a | There is a significant relationship between the tutor gender and student performance |
| H3b | There is a significant relationship between the tutor nationality and student performance |
| Н3с | There is a significant relationship between the tutor level student performance |
| H4 | There is a significant relationship between student nationalities and student attendance. |
| H5 | There is a significant mean difference between the cultural compositions of groups and student |
| performance | |
| H6 | There is a significant relationship between the compositions of student gender within the group |
| and student performance | |
| H7a | There is a significant relationship between the tutor gender and student performance in the group |
| H7b | There is a significant relationship between the tutor nationality and student performance in the |
| group | |
| Н7с | There is a significant relationship between the tutor level and student performance in the group |
| H8 | There is a significant relationship between cultural compositions of the PBL groups and group |
| attendance. |
A conceptual framework has been developed and comprised of seven domains: student background, tutor background, group composition, specified modules, tutorial group functioning, assessment result and learning outcomes. With this conceptual framework, the study endeavors to investigate hether there is significant mean difference between cultural compositions of PBL
groups on student performance. In order to get the answer from this problem statement, there are eight hypotheses are examined. The hypotheses are defined into two categories, which based on students' nationalities (Dutch and non-Dutch students) and group cultural compositions (culturally homogeneous and culturally heterogeneous groups) in module samples. Variables included in each domain of this framework are listed below. The variable names used in this research are italicized.
"Student Backgrounds" can be built from the "primary" and "secondary" dimensions of diversity as defined by University of Maryland (cited in Eringa et al., 2002) such as cultural backgrounds (nationalities), gender, learning styles, prior knowledge, language levels and industry/working experience. In this paper, only two "primary" dimensions of diversity are employed that are "nationality" and "gender". The study attempts to investigate whether there is a significant mean difference in the result of student performance between Dutch students and non-Dutch students in the modules sample (hypothesis 1). Moreover, the study also examines whether there is a significant relationship between student gender and student performance (hypothesis 2) and the relationship between composition of student gender in the PBL groups and student performance (hypothesis 6).
"Tutor backgrounds" consists of three dimensions of diversity that are cultural background (nationalities or country of origins), level of experience and gender. Cultural background refers to nationality regardless the condition if the tutors have stayed in the recent country, which is not his or her country of origin or the condition in which he or she has been living in several different countries. Level of experience refers to the status of the tutors whether she or he is lecture-tutor or student tutor. The last is gender that refers to the sex of the tutors whether it is male or female. Nationalities and gender are primary dimensions of diversity and level of experience is determined as one of the secondary diversity dimensions (University of Maryland cited in Eringa et al., 2002). With these variables, the study tries to examine the relationship of tutor backgrounds and student performance (hypothesis 3 and 7), either based on student nationalities (Dutch or non-Dutch) or group cultural compositions in the module samples.
"Group compositions " consist of culturally homogeneous group and culturally hetrogeneous group (labeled HETERO). A "culturally homogeneous group" is defined as a PBL group that consists of a number of students from the same nationality or cultural background (in this case Dutch nationality). In the statistical analysis, the homogeneous group will be remarked as 0 percent that shows there are no international students (labeled as COUNTRY) and one in DIVERSITY that refers to only one nationality in a PBL group meaning Dutch. A "culturally heterogeneous group" is defined as a PBL group that consists of a number of students from different nationalities or from a wide range of countries. The percentage of non-Dutch students in a PBL group (labeled COUNTRY), number of nationalities in a PBL group (labeled DIVERSITY), the categories of percentage for non-Dutch students in a PBL group (labeled HET LEV/ Heterogeneous level) are used as parameters to measure how diverse a PBL group. In this research, there are no homogeneous or heterogeneous groups differentiated by gender. With these four indicators of heterogeneity, the study attempt to investigate whether there is a significant mean difference between group cultural compositions on student performance (hypothesis 5).
"Modules samples" refers to the year of the students and modules in which the data were collected. For example, 1.1 refers to the first year student and module period 1. Participation points in PBL groups are taken from data of the 1` and 2"° year students and module period 1,5 and 6. The illustrations for the modules are given below. There are only two modules (ISS and IVA) consist of culturally homogeneous groups with all Dutch students. These modules are functioned as control groups. The other modules (IHE, IHR, IOM and IIS) are assembled from culturally homogeneous PBL groups and culturally heterogeneous PBL groups. The four indicators of heterogeneity are applied in these modules to examine whether there is a significant mean difference between group cultural compositions on student performance.
The groups were not randomly selected. First, the chosen modules for this research had PBL sessions in the modules either for the first year or second year programs. Secondly, the learning outcomes which are measured by the total points for the module in the chosen modules above consists of PBL participation points and points for the final module assignment which are graded partly by module coordinators or lectures and tutors. In other words, these chosen modules have the same structure when assessing student performance.
"Tutorial group functioning" determines the PBL process itself. Students (team), tutors and themes (module) as the three main drivers of PBL process (see Figure 1) determine how success the PBL method is carried out in supporting student-centered learning. The qualitative research will be conducted to determine student attitudes and activities toward PBL system and IHM assessment. In addition, this study also inquires about students' attitudes toward group process and the tutors.
"Student attendance" refers to "missing sessions", which were counted out from 11 PBL sessions in each thematic module. Student attendance is not considered as one of the PBL drivers that may influence student performance. It is realized that one student may have high missing sessions but his or her total performance could be better than another student who did not have any missing sessions. For example, student A had been absent for 2 times out of 11 PBL sessions and her total PBL points were still higher (considered she had got 3 points for every session which led to the result equal to 27 points) than student B who was present for the whole module (considered that he has got 2 points every PBL session which lead to the result equals to 22 points). However, this study tries to examine whether there is a significant relationship between student nationalities and student attendance (hypothesis 4) and between group cultural compositions and student attendance (hypothesis 8).
"Assessment result" (student participation points) was recorded based on consensus among self, peer and tutor in the PBL evaluation in every modules sample.
Finally, "learning outcomes" were measured by the total points that the student attained at the end of the module. The total points consist of student participation points and points for the module assignment. Points for the module assignment in this study were collected before the students had to re-do their assignment if they had failed in the related modules.
Table 2 The Chosen Modules for the Research
| 03-09-2001 Module period 1 | 25-03-2002 Module period 5 | 13-05-2002 Module period 6 | |
|---|---|---|---|
| The first year | Hospitality | Support | Value Adding |
| Modules | Experience | Systems | (1.6) |
| 100 | (1.1) | (1.5) | |
| The second | Hospitality | Operations | Innovation in |
| year Modules | Relations | Management | Services |
| (2.1) | (2.5) | (2.6) |
• Culturally Homogeneous Groups
The conceptual framework is presented below with some remarks:
- The interaction of PBL drivers: Students, tutors and Modules ( )
- The influence which leads to the learning process assessment and the learning outcomes assessment ( )
- The possible relationship between student nationalities or group cultural compositions and student attendance. Student attendance may negatively or positively influence student performance ( )
- Tested hypothesis: l, 2, 3, 4, 5, 6, 7 and 8
Figure 1 Conceptual Model
SAMPLE AND DATA COLLECTION
Quantitative and qualitative data were gathered from cohorts of both the first and second year students, together with tutors who were involved in student teaching and learning. Evidence for the study came from 796 students enrolled in the six thematic modules of the IHM program. The students' average age is between 17 to 20 years old with 60% are female students and 40% are male students. Data were collected from September 2001 through June 2002. Students and tutors' background, student participation points from PBL assessment result and total points from modules Hospitality Experience (IHE), Hospitality Relations (IHR), Support System (ISS), Operation Management (IOM), Value Adding (IVA) and Innovation in Services (IIS) in module period 1, 5 and 6. At the same time, observation of the PBL activities (March 2002 through June 2002) and interviews about student attitudes and activities toward PBL system (May 2002 - June 2002, module IVA and IIS in module period 6) enhanced the study.
Table 3 Modules Sample
| 03-09-01 | 25-03-02 | 13-05-02 | |
|---|---|---|---|
| Module period 1 | Module period 5 | Module period 6 | |
| The first | Hospitality Experience | Support Systems | Value Adding |
| year | (IHE) | (ISS) | (IVA) |
| modules | (1.1) | (1.5) | (1.6) |
| 208 students | 244 students | 183 students | |
| 23 groups | 23 groups | 16 groups | |
| The second | Hospitality Relations | Operations | Innovation in |
| year | (IHR) | Management (IOM) | Services (IIS) |
| modules | (2.1) | (2.5) | (2.6) |
| 189 students | 118 students | 190 students | |
| 18 groups | 17 groups | 16 groups | |
| Total | 397 students (12% Non- | 362 students (5% | 373 students (6% |
| Dutch) | Non-Dutch) | Non-Dutch) | |
| , |
• Culturally Homogeneous Groups
Module Support Systems (period 5) and Module Value Adding (period 6) were chosen as representatives of culturally homogeneous groups because of all groups in these two thematic modules consisted of Dutch students. These groups were used as control groups in this study. The other modules such as Hospitality Experience, Hospitality Relations, Operation Management and Innovation in Services consisted of mixed non-Dutch students and Dutch students. These modules are treated as culturally heterogeneous groups. The table below presents the number of groups based on group cultural compositions, tutor gender, tutor nationality and tutor level.
The Netherlands was selected as the culturally homogeneous norms for two reasons. First, this study was conducted in the Netherlands and the sample pool was readily available. It was felt that a study comparing the Dutch groups with mixed cultural groups would be of considerable research value in PBL educational systems since the CHN (IHM) institute has started to present its internationalization policy. Second, the culture of the Netherlands places it at the quite extreme of several of Hofstede's cultural dimensions (the Netherlands scores low in femininity and high in individualism). According to Hofstede (2001), compared to Asian countries, the Netherlands ranks somewhat in the bottom for power distance (rank 40 of 53) and in the middle for short/long term dimensions (rank 10 of 20).
Table 4 Sample-Group Cultural Companion and Tutor Background
| Criteria | Module period 1 | Module period 5 | Module period 6 | ||||
|---|---|---|---|---|---|---|---|
| IHE | IHR | ISS | IOM | IVA | IIS | ||
| Group cultural | 0 | 13 | 7 | 23 | 11 | 16 | 6 |
| compositions | 1 | 10 | 11 | - | 6 | - | 10 |
| Tutor gender | 0 | 13 | 6 | 9 | 9 | 5 | 6 |
| 1 | 10 | 12 | 14 | 8 | 11 | 10 | |
| Tutor | 0 | 17 | 12 | 22 | 7 | 9 | 7 |
| Nationality | 1 | 6 | 6 | 1 | 10 | 6 | 9 |
| Tutor Level | 0 | 15 | 14 | 20 | 10 | 12 | 9 |
| 1 | 8 | 4 | 3 | 7 | 4 | 7 | |
| Total number of groups | 23 groups | 18 groups | 23 groups | 17 groups | 16 groups | 16 group | |
ANALITYCAL METHOD
In order to measure the effect of cultural diversity on performance in PBL groups, heterogeneity in PBL groups must be defined. The question is: What makes a group culturally homogeneous or heterogeneous? This is not easy to answer since students come from over 40 different countries, and some countries may have their own cultural diversity. Ideally, it would be better to make a profile of every student on some well-defined dimensions (Eringa et al., 2002). Hofstede's dimensions might serve as such. The next step would be to calculate the difference of every group member to all the other members in the group and to take the sum of all these scores as a measure for heterogeneity in the group. According to Eringa et al. (2002), because of dimensions for diversity in an educational setting are not at all clear, it is decided for the time being to use a simpler measure. Since most of the students are still from the Netherlands, to be precise, 75%, and the other 25% at:e from 40 different countries, the first distinction was between groups that were more or less Dutch, with the percentage of non-Dutch students as an indicator. It was realized that this was an ethnocentric approach, taking one's (Dutch) background as a measure.
In short, as suggested by Eringa et al. (2002) and Terenzini et al. (2001), the percentage of non-Dutch students in the PBL group will be operationalized in this study by using a "heterogeneous index" creating by dividing the number of students who reported their identity to be non- Dutch by the total number of students in the PBL group. In order to examine the level of heterogeneity more easily, the heterogeneous index was used to develop four categories of "group heterogeneity" as it is applied in the study by Terenzini et al., (2001). The four categories and the range of the group heterogeneity levels within each category are explained as followed:
- Zero (0) is determined as "Homogeneity" or "No Heterogeneity", meaning there is no diversity at all.
- One (1) is determined as "Low Heterogeneity", with the number of non-Dutch students between 1 % to 20% of the total number of the students in the group.
- Two (2) is determined as "Medium Heterogeneity", with the number of non-Dutch students between 21 % to 40% of the total number of the students in the groups.
- Three (3) is determined as "High Heterogeneity", with the number of non-Dutch students between 41 % to 100% or in other words above 41 % of the total number of the students in the groups. To some extent, if the heterogeneity index approaches 50% level, it can be considered the highest diversity. In fact, if there are more than 50% non-Dutch of the total number of students in a group, the Dutch students will become "minority" in this group. Somehow, it can be interpreted that there
Data sheets were collected, coded (country/student nationality, group diversity, PBL points, total points, missing sessions, student gender, tutor nationality, tutor gender and tutor level), and entered into a computerized database. Response rates within various groups were calculated. The mean scores of the PBL points and mean scores of total points for the module (total points) as dependent variables are used within each group and Country, Diversity, Hetero and Het_level/ Heterogeneity index as independent variables.
- COUNTRY shows the percentage of non-Dutch student within the group,
- DIVERSITY shows the number nationality in the group,
- HETERO shows the group is culturally homogeneous or heterogeneous,
- HET _LEV / Heterogeneity index shows the category level of the COUNTRY.
"Mean of missing sessions" (group attendance) of the module, "student gender", "tutor gender", "tutor nationality", "tutor level" between culturally homogeneous and culturally heterogeneous groups; 15` year and 2"d year students for each evaluation form are also used as independent variables to make further comparisons.
The student data from module period 1, 5 and 6 for PBL points and total points were analyzed using descriptive statistics. For the objective of this research, the relationship between culturally homogeneous groups and culturally heterogeneous groups was analyzed by using two different statistical methods. The first method of analysis was (1) Correlation Analysis: Pearson product-moment (r) to test correlations between dependent and independent variables. PBL points, total module points and group attendance (missing sessions) were classified as dependent variables and students nationalities, four indicators of heterogeneity, student-gender, compositions of student gender, tutor-gender, tutor-level, tutor- nationalities as independent variables. The second analytical methods used (2) ANOVA to test whether there are significant mean differences on student perfomance (PBL points and total points for the module) based on student nationalities and the four indicators of heterogeneity.
These two different statistical methods were used to present three different results of analysis:
- The Dutch students and non-Dutch students within the modules on student performance. HETERO 1 is the independent variable to differentiate students' nationality (0 = Dutch students and 1 = non-Dutch students) in modules IHE, IHR, IOM and IIS.
- The group cultural composition within the modules (group level) on student performance. As mentioned above, the homogeneous and heterogeneous groups within the modules (IHE, IHR, IOM and IIS) are defined into four independent variables COUNTRY, DIVERSITY, HETERO (0 =Culturally homogeneous groups; 1 = Culturally heterogeneous groups) and HET LEV (0 = No heterogeneity, 1 = Low heterogeneity, 2 = Medium heterogeneity and 3 = High heterogeneity).
- The group cultural composition on student performance in the first year and second year modules. The comparison among three modules in the first year (IHE, ISS and IVA) and second year (IHR, IOM and IIS) modules are examined. Descriptive statistics, Correlation analysis, T-test and ANOVA present the result of analysis.
RESULTS OF THE ANALYSIS
In this section, the results of analysis of variance and the correlation analysis each of the links in the conceptual model are reported (Table 7). The results have shown that only two hypotheses are accepted which are hypotheses 1 and hypotheses 2.
1. Student Nationalities and Student Performance
In the modules Hospitality Experience, Hospitality Relations, Operations Management and Innovation in Services, the results indicates that there is a statistically significant mean difference between student nationalities (Dutch students and non-Dutch students) and PBL performance in all modules (p=0.05 and p= 0.0 l level). On the other hand, there are no statistically significant differences between Dutch students and non-Dutch students on total points and missing sessions. Can it be summarized that the effect of the students' nationality within the groups only takes place on PBL performance in which student participation in the group process play important role to get the points?
Table 5 The Result of Hypothesis 1
| Hetero 1 (Dutch and non-Dutch students) | |||||||
|---|---|---|---|---|---|---|---|
| IHE | IHR | IOM | IIS | ||||
| PBL | Students perform better | Dutch | Non-Dutch | Non-Dutch | Non-Dutch | ||
| Points | Significant level | .004**, | .02*, | .002**, | .05*, | ||
| F (1,206)= 8.30 | F (1,187)= 5.98 | F (1,116)= 10.14 | F (1,188)=3.88 | ||||
| Total | Students perform better | Dutch | Non-Dutch | Non-Dutch | Dutch | ||
| Points | Significant level | .000** F (1,206)= 17.45 | .23 (n.s) F (1,187)= 1.47 | .16 (n.s) F (1,116)= 2.05 | .21 (n.s) F (1,188)= 1.62 | ||
| Missing | Students who have less | Dutch | Non-Dutch | Non-Dutch | Non-Dutch | ||
| Sessions | absents Significant level | .001** F (1,206)= 11.38 | .052 (n.s) F (1,187)= 3.81 | .10 (n.s) F (1,116)= 2.71 | .17 (n.s) F (1,188)= 1.95 | ||
In addition, only module IHE (The first module in the first year program) demonstrates statistically significant mean differences on student performance and missing sessions (p. 53). Another assumption can be raised by comparing the results among the modules between the first year program (IHE) and the second year program (IHR, IOM and IIS). It seems that the effect of students' nationality as independent variable on student performance and missing sessions plays important roles in the first year program. With the result shows that Dutch students outperform non-Dutch students in the beginning of the first year program, can it be interpreted as an indicator that non-Dutch students need more time to adjust themselves in the new culture and the new learning environment? The result of this study is consistent with the study by Watson et al. (1993), Ellis and Fisher (1994, cited in Terenzini et al., 2001) and Robbins (2000), that stated culturally heterogeneous groups are likely to need more time to adjust to a new group and learning environment.
Moreover, there was a significant relationship among the four indicators for cultural heterogeneity; the number of nationalities in a group (labeled DIVERSITY), the percentage of non-Dutch students per group (labeled COUNTRY), culturally homogeneous or heterogeneous groups (labeled HETERO) and the categories of percentage for non-Dutch students (labeled HET LEV/ Heterogeneity level). The ANOVA result showed there was no significant mean difference between the four indicators of heterogeneity and student performance.
An interesting result shows that the effect of student gender and tutor backgrounds only occurs in module IVA and I SS in which consist of Dutch students only although the relationship is weak but it is statistically significant. In general, modules THE, IHR, IOM and ITS do not show any significant relationships between student gender or tutor background (gender, nationality and level) and learning process (PBL points). However, the result shows that there is statistically significant relationship between student gender and total points for the module (p= 0.01 in modules ISS, IVA and ITS and p=0.05 in modules THE and IOM). These statistically significant relationships appear in all modules except module IHR. They demonstrate positive relationships between female students and total points. Yet, there was no statistically significant relationship between either the compositions of student gender in PBL groups or tutor backgrounds and student performance.
Table 6 The Result of Hypothesis 2
| IHE | IHR | IOM | IIS | ISS | IVA | ||
|---|---|---|---|---|---|---|---|
| Total points | Student gender | 14 * | 09 (n.s) | 23* | 21** | 20** | 24** |
To sum up, based on the attaining result, the first four hypotheses were tested and the findings from the study conclude that:
- 1. a. There are significant mean differences between student nationalities (Dutch and non-Dutch students) on PBL performance.
- b. There are no significant mean differences between student nationalities (Dutch and non Dutch students) on total performance.
- 2. a. There are no significant relationships between student gender and PBL performance.
- b. There are significant relationships between student gender and total performance.
- 3. There are no significant relationships between the tutor backgrounds (gender, nationality and level) and student performance.
- 4. There are no significant relationships between student nationalities on student attendance.
2. Group Cultural Composition and Student Performance
There are four indicators of heterogeneity were applied in this study namely COUNTRY, DIVERSITY, HETERO and HET_LEV. In general, based on these four indicators of group cultural compositions, the result shows that there are no any significant mean differences between group cultural composition and student performance. However, the result shows that in module IHR and IOM, groups with low level of heterogeneity perform the best. The findings of this study at the same time oppose the conclusion that was drawn by Terenzini et al. (2001) and Glaser (2002) that "medium level" of heterogeneous group outperforms other levels in group skills and problemsolving skills. It also demonstrates there are no significant relationships between group cultural composition and group attendance (missing sessions). Furthermore, the results show there are no significant relationships between composition of student gender or tutor backgrounds and student performance. In other words, based on the attaining result, the second part of four hypotheses were tested and the findings from the study concluded that:
5. There are no significant mean differences between cultural compositions of the groups on student performance.
- 6. There are no significant relationships between the composition of student gender and student performance.
- 7. There are no significant relationships between the tutor background (gender, nationality and level) and student performance.
- 8. There are no significant relationships between cultural compositions of the PBL groups and group attendance.
Based on the result in the interviews, students in the first year program, particularly Asian students, mentioned that they need more time to adjust themselves to the new culture and learning environment. Most Asian students who are accustomed to the traditional way of teaching find it difficult to accept the self-directed approach of PBL. Moreover, regardless the level of proficiency in the used-language, they are not used to speak up in the class unless the teacher or tutor appoints them. The IHM assessment is viewed as a "motivator" for non-Dutch students (Asian students) especially for the first year students to be able to express themselves about their ideas and opinions. If they do, they will get the participation points. After some time, they have more self-confidence in expressing their opinions compare to the first time they have just arrived in this country. The PBL system has drawn the attention of non-Dutch students in the new learning environment. Furthermore, related to missing sessions, another possible reason that non-Dutch students have the highest missing sessions in PBL sessions in module period 1, Hospitality Experience (IHE), just because some non-Dutch student have late arrival when the school started.
I remember when I started my role as a tutor in the module period 1, there were two non- Dutch students who had missed some PBL sessions because of late arrivals. They were nervous and shocked with the way of study in PBL class. They were silent throughout the period and would not say anything until the chairperson appointed one of them to express his opinions regarding the task in the module. After the class, they were confused and did not know what to do. They were afraid if they could not catch up with they had missed, thus feeling insecure. At this stage, it can be assumed that the students were in the culture shock. However, we decided to spend more time after PBL session to check how they felt and discuss what they were confused about related to the task or assignment. At the end of module period I, they passed the module. Some months went by, I met them again and asked how they were doing. They looked happier and it seemed they have already got used to studying in this learning environment. Moreover, they mentioned that they had more self-confidence in expressing themselves. They were not afraid as it used to be.
The effect of nationalities does not appear in the second year programs. The non-Dutch students outperform Dutch students (the mean differences are not statistically significant) in module IHR and IOM. However in module IIS, the Dutch students outperform non-Dutch students. In addition, the results from qualitative research also reveal that the IHM assessment instrument is a good tool to measure student participation in PBL sessions in the international learning environment. First year students, particularly non-Dutch students, feel that the IHM assessment instrument is a "motivator" for them to prepare for tasks and express their opinions in the PBL sessions. After some time, they are more confident about expressing themselves. However, second year students comment that every student was responsible for his own learning. The use of the IHM assessment is good to evaluate group performance but sometimes they felt that implementation of the assessment system cost a great deal of time. The ability to work together and to carry out the evaluation among themselves, peers and tutors in groups demanded particular skills, which needed training and monitoring. The most striking result, in the first or the second year modules, is that the students felt uncomfortable in assessing their peers. It is difficult for them to engage in argumentative discussion because they did not want to create "enemies" among group
members. This result hardly supports the study by Love (1981 cited in Miller, 2001), which claimed that peer assessment was not biased by friendship.
Table 7 The Correlation Result of 8 Hypotheses
| Hypothesis | Measured Link | Result | Statistical significance |
| H1. There is a significant |
| Significant |
|
| mean difference between | and PBL points. | and 0.05 level | |
| student nationalities on student performance |
|
| • NA |
| and total points. | N . 61 . 16 | 27. | |
| H2. There is a significant relationship between student | Student gender and |
| • NA |
| gender and student | PBL points. | G::G |
|
| performance |
|
| and 0.05 level. |
| H3a. There is a significant | Tutor gender and PBL | Not Significant | • NA |
| relationship between the | points. | • Not Significant | • NA |
| tutor gender and student | Tutor gender and total |
| • NA |
| performance | points. | - 140t Significant | · NA |
| H3b. There is a significant | Tutor nationality and | Not Significant | • NA |
| relationship between the | PBL points. | Tion origination | 1111 |
| tutor nationality and student |
|
|
|
| performance | total points. | ||
| H3c. There is a significant |
| Not Significant | • NA |
| relationship between the | points. | _ | |
| tutor level student |
|
|
|
| performance | points. | ||
| H4. There is a significant |
|
|
|
| relationship between student | and student attendance | ||
| nationalities and student |
|
|
|
| attendance. | and student attendance | ||
| H5. There is a significant | Group cultural |
|
|
| mean difference between the | compositions and PBL | significant (1 module) | Management, r= 0.57, |
| cultural compositions of groups and student | points. |
| significant at 0.05 level. |
| 0 1 | Group cultural |
| |
| performance | compositions and total | ||
| H6. There is a significant | points. Student gender | Not significant | • NA |
| relationship between the | composition and PBL |
| • NA |
| compositions of student | points. | ||
| gender within the group and | Student gender | Not Significant | • NA |
| student performance | composition and total | 1 Tot biginneum | TA TA |
| points. | |||
| H7a. There is a significant | Tutor gender and |
| • NA |
| relationship between the | average PBL points in | · · | |
| tutor gender and student | the group. | ||
| performance in the group |
|
|
|
| average total points in | |||
| the group. | |||
| H7b. There is a significant |
|
| • NA |
| relationship between the | average PBL points in | 14 | |
| tutor nationality and student | the group. | ||
| performance in the group |
|
|
|
| 1 | average total points in | ||
| H7c. There is a significant | the group. Tutor level and average | Not significant | • NA |
| relationship between the | PBL points in the |
| • NA |
| tutor level and student | group. | ||
| performance in the group. | Tutor level and average | Not Significant | • NA |
| 8 | total points in the | Tot Digitaleant | = 146 |
| 1 | group. | ||
| H8. There is a significant | Group cultural | Not significant | • NA |
| relationship between cultural | compositions and | ||
| compositions of the PBL | group attendance | ||
| groups and group | Group cultural |
|
|
| attendance. | compositions and | ||
| group attendance |
IMPLICATION FOR PRACTICE
Some specific experiences regarding the culture's effect, PBL process and assessment that can be learnt are as follows:
- Student populations will only increase in diversity; the most effective tutors will recognize this and adapt their teaching to optimize student learning and academic achievement. PBL tutors need to have better understanding about meaningful ways of assessing student work to motivate the learning.
- Students need to understand the rationale of PBL immediately in their first week of school, and the message has to be reinforced throughout the module. Experienced tutors with critical thinking skills play important part as role models in supervising group processes and assessing students' performance especially for formative purposes. Moreover, they should pay attention to the cultural influences brought by international students and their adjustment to the new environment. • Remediation of performance in the group is a process of learning new behavior and skills rather than changing students' personalities. These behaviors and skills are specific and relatively easy to learn with practice. When students improve their group participation and learning skills, their self-efficacy will also improve, providing the basis for ongoing learning. Self, peer-and tutor assessment can be applied as a formal system to support the remediation process.
- Criteria and standards for assessment of participation (1, 2, 3 or 4 points) must be explicit, clear and consistent with the philosophy of PBL. Students and tutors must understand that these standards will be applied without exception but that support is available to help students in both the process of learning and the acquisition of an adequate knowledge base.
- Assessment of learning outcomes should provide a basis for decisions, clear purposes must be determined, communicated to the tutors and students, and focused on specific achievement targets.
- Appropriate assessment methodologies should be selected with input from student and tutors.
From the results, it can be learnt about the selection of the group members, validity of assessment and socialization of students. There lessons have had a profound effect upon PBL practices ever since. It has become clear that student understanding of the purpose, method and outcome of assessment is crucial to its success (Mennin et al., 2001, p. 162).
DISCUSSION OF LIMITATIONS
The result of this study has lead to several limitations. First, only two modules (module 5 and 6, March 25'h , 2002 until June 24'", 2002) have been observed. Second, the composition of the group samples for culturally homogeneous and heterogeneous groups in the modules are not equal since the writer takes all the PBL groups in all modules as group samples.
Third, the influences of age, learning style, prior knowledge, skills and working experience as parts of student background are ignored in this study due to time limitation. As suggested by Miller (2001), "Cultural differences would be influenced not only by country of origin, but also by how long the student has been living in the present country." Only nationality or country of origin is used as the cultural dimension of student background to differentiate cultural composition of PBL groups in IHM program. How long the student has been living in the present country and how many times he or she has visited or stayed in various countries are underestimated in this study in which leads to as a limitation.
Fourth, the study's design and database are cross-sectional. The concept of learning, attitude, development, or adapting to the new environment implies change over time. Moreover, the impact of group diversity may also vary over time. Interview and observation was only carried out within one academic period. As mentioned above, questions about people's opinions and attitudes always potentially suffer from low reliability because they may change over a periods of time depending on what they have heard, seen and experience. Students develop their learning and performance over time and at varying rates. This study is limited by the fact that changes in the student performance were examined only one academic year. A longitudinal design will provide a more rigorous test of whether cultural composition of a group is related to student performance. Fifth, the measurements of student performance in this study are based on the result of student participation points (based on consensus among self, peer and tutor assessment) and the total points of the module (module assignment and PBL participation points). The assessment results and learning outcomes may be more subjective measures than other objective measures of student learning such as the use of standardized tests or examinations.
Sixth, as noted by Eringa et al., (2002), "It is better that the group reaches consensus on criteria that slightly deviate from the prescribed instrument (external accountability), than that will be confusion within the group about the criteria." If the criteria are differently structured in every PBL groups, then multiple groups cannot be easily compared to each other in this study. Finally, the study examines the influence of different levels of group heterogeneity on student performance only in relation to the effect of no group heterogeneity at all. Some levels of heterogeneity may be more or less, positively or negatively, related to learning gains (Terenzini, et al., 2001). The future research on this matter is strongly encouraged.
What direction should future academic and other research take? Reflecting the issues, five suggestions are offered below:
- Replicating the study design particularly for first year students with the groups (both culturally homogenous and heterogeneous) that will remain together for a longer period of time (such as for two modules or three months instead of six weeks) to determine whether the students will develop their own group culture, their own way of solving problems and working together. As claimed by Watson et al. (1993) that although newly formed culturally diverse group does not perform as well as newly formed culturally homogeneous group, the differences disappear after about three months.
- Investigating whether there is an effect of interaction among student gender, tutor backgrounds and group attendance on student performance and how it may different in culturally homogeneous and heterogeneous groups by using more advanced statistical instruments such as multivariate analysis of variance (MANOVA) and regression analysis which were absent in this study.
- Identifying possible relationships between ethnic diversity and students' preferred learning styles on student academic performance.
- Examining the level of agreement among self, peer and tutor assessment in Problem-Based Learning in order to serve as a valid triangulated system of evaluation (Miller, 2001).
- Examining the relationship among self, peer and tutor assessment using a qualitative form of assessment, such as a questionnaire as suggested by Miller (2001).