
INTRODUCTION
In service industry, where services are often characterized by a transaction between service providers and consumers, the quality of the service providers or so called internal service have a direct and momentous influence on the service delivery process and customer satisfaction. Bohl et al., (1996) claimed that after years of organisational re-structuring and work re-engineering, management comes to recognize that a superior internal service quality is increasingly important to attain sustainable competitive advantages for business organisations on a global basic. For example, Roth and Jackson (1995) empirically found that internal service quality is directly linked with business performance in using data from a banking company.
Heskett et al. (1997) propounded the service profit chain as a series of causal relationships which results in profit performance and growth. The model captures the relationship between employee and customer satisfaction with their similarity of the "satisfaction mirror", which clearly conveys the notion that business success results from employee satisfaction being "reflected" in term of customer satisfaction. The notion was supported by Schlesinger and Heskett (1991) that the
Address correspondence to Lientje Siehoyono, Petra Christian University, Hotel Managemant, Jl. Siwalankerto 121-131, Surabaya, 60236, Indonesia. Tel (031) 8494830; Fax (031) 8491868. E-mail: slintje@peter.petra.ac.id
staff frustrations lead to high turnover and cause customers' dissatisfaction. The strength and richness of the service profit chain lies in the fact that the model interlinks and integrates many drivers of performance, drawing together many unrelated claims about these inter-dependencies. Its strength, apparently, starts with the internal service quality.
The service profit chain is a theoretical concept and teaching framework that hold a set of hypotheses about how companies make money. The service profit chain links employee, customer outcomes, and financial performance at the unit level in the organisations. Simply put, the service profit chain hypothesizes that profit and growth is directly linked to customer loyalty and satisfaction, the value provided to customers, the productivity and quality of the work of employees, employees loyalty, employees satisfaction, and the capability with which employees are able to deliver a service (Heskett et al, 1997). The relationship is shown in figure 1. Based on the framework of the Service Profit Chain, various studies have tried to identify the relationship of internal service quality to employee satisfaction. Rucci, Kim, and Quinn (1998) attempted to describe the application of the "Employee-Customer-Profit Chain at Sears". In particular, the model shows that a 5 percents improvement in employee attitude will lead to 1.3 percent improvement in customer satisfaction, which in turn will result in a 0.5% improvement in revenue growth. According to Loveman (1998), the service profit chain was tested and yielded the high correlation of internal service quality and employee satisfaction in the retail banking industry. In hospitality industry, the study by Heinhuis et al. (1998) also suggested that there is a strong relationship between internal service quality and employee satisfaction. So far, there has not been found any studies, which investigate the application of service profit chain framework in food and beverage service industry.
Several models and theories are considered to approach the people development issues such as Balance Score Card, ISO 9002, European Excellent Model, Service Profit Chain and some others. However, the Service Profit Chain model is particularly chosen due to (1) generally, the model
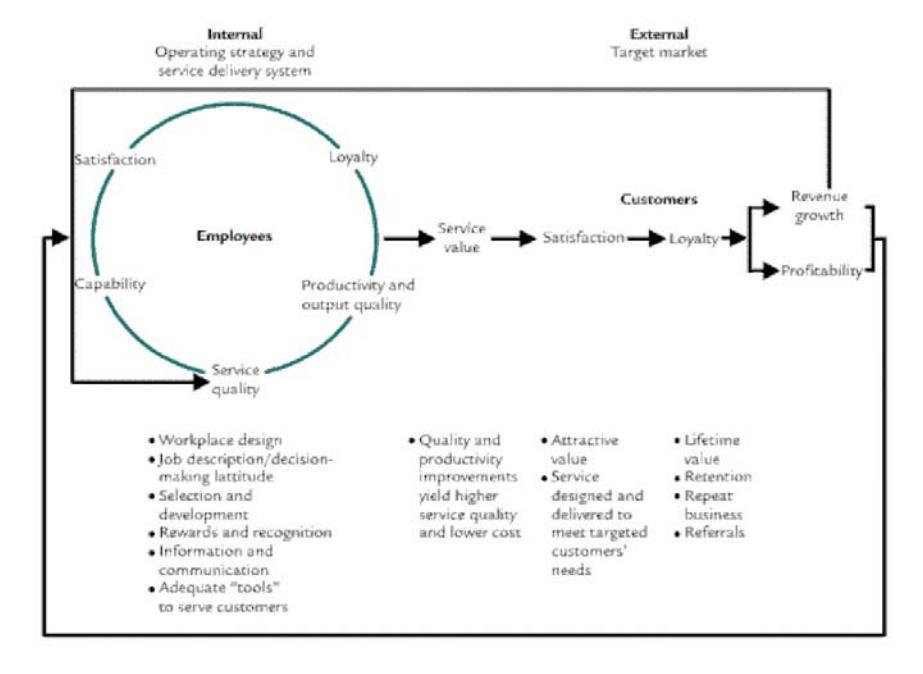
Figure 1 Service Profit Chain Frameworks
engages an obvious link between people, operation and marketing or namely revenue. Simply put, the service profit chain model is the most suitable to the service marketing concept of the company (2) in particular; the model reflects the relationship between employee satisfactions, employee retention and employee productivity. Heskett et al. (1994) referred "internal service quality" to the quality of work environment that contributes to employees' satisfaction. Particularly, Robbins (1989) defined the ISQ as "a process by which an organisation responds to employee needs by developing mechanism to allow them to share fully in making the decisions that design their lives at work" (p.207).
Despite the view of Robbins from internal marketing perspective which means how company serves the employees, Heinhuis et al., (1998) advocated the definition of ISQ from the internal customer perspective, which means how employees serve other employees, as: the ability and willingness experienced by employees to perform the services as the required levels. According to Zeithaml et al., (1991) internal service quality is divided into seven sub-measures: teamwork, employee job fit, technology job fit, perceived control, supervisory control systems, role conflict and role ambiguity. The employee satisfaction (ES) is defined as "the degree of satisfaction of the personnel with different organisation roles" (Heinhuis et al., 1998). Miller (1991) divided the employee satisfaction into 3 sub-measures: Company involvement, intrinsic job satisfaction and financial and job status.Three management functions play central and interrelated roles in meeting customers' needs including marketing, operations and human resources, and the firms whose managers succeed in developing and integrating these functions will have a better chance of surviving and prospering. Moreover, the fact shows that managing people is one of the most challenging tasks. In the old time of central planning economy, tasks were fully directed in which the management should plan and inform the subordinates what to do step by step. In the current market economy, the employees are required to be more pro-active and independent in the job. The economy's transformation has caused many difficulties in understanding from both sides, employee and employer. The company is, therefore, constructing the master strategy to achieve those objectives. Importantly, in order to have a valid and reliable strategy in people development, the present situation should be well analysed, concluded and recommended for the managerial implications. There are a few issues in which the company is looking for:
- The current level of the employees' satisfaction regarding the job in the company.
- The drivers that have influence on employee satisfaction.
- The key drivers that have the most influence on employee satisfaction
Based on the perspective above, a conceptual framework has been developed and comprised of three domains: Employee backgrounds, Internal Service Quality and Employee Satisfaction. With this conceptual framework (Figure 2), the study endeavours to investigate whether there is a significant correlation between internal service quality and employee satisfaction. Moreover, the influence of employee backgrounds (demographic factors) on employee satisfaction are also explored in this study.
a. Employee background
The employee background (personal characteristics) consists of age, education qualifications, and length of employment.
b. Internal service quality (ISQ)
The internal service quality applies the dimensions developed by Zeithaml et al., (1991) which are teamwork, employee job fit, technology job fit, perceived control, supervisory control system, role conflict and role ambiguity.
c. Employee satisfaction
As suggested by Miller (1991), sub-measurements of employee satisfaction including company involvement, financial and job status and intrinsic job satisfaction are used in this study.
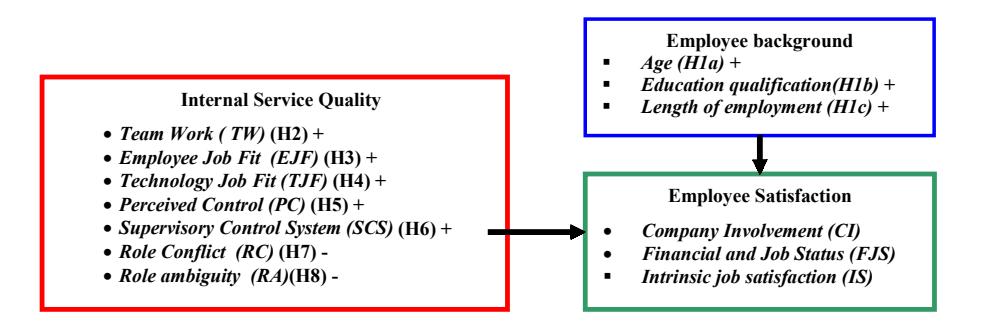
Figure 2 Conceptual Framework
The purpose of the study is to examine the relationship between Internal Service Quality and Employee Background on Employee Satisfaction in a Vietnamese Food and Beverage Service Industry. The insights into this relationship, then, will be exploited to construct the people development strategy for the future expansion of the company. To answer the problem statement and attain insight in the purpose of the study, three research questions are developed.
- 1. Is there a relationship between employee background (age, education qualification, and length of employment) and employee satisfaction?
- 2. Is there a relationship between Internal Service Quality and Employee satisfaction?
- 3. What are the most important measurements of Internal Service Quality, which influence the Employee Satisfaction?
THEORITICAL PERSPECTIVE
Employee Background and Employee satisfaction
The studies by Kalleberg (1977), Lee and Wibur (1985) and Martin and Hanson (1985, cited in Dickie at al., 2003) proposed that the characteristics of employee interact with internal and external characteristics portrayed in the job features which are important in attaining employee job satisfaction. These features refer to the 'good jobs' as the creators of satisfaction such as internal rewards (having diverse and challenging work), external rewards (bonus and other fair compensation), or other affective variables such as the good mood or feeling good while working. The positive feeling about working either the job itself or the atmosphere can determine level of satisfaction. The realisations of personal characteristics (e.g. age, education levels and length of employments) have a different affect on job satisfaction as suggested by Blackburn and Bruce (1989). Some studies have inconsistent result towards the relationship between employee backgrounds and employee satisfaction. For example, some has claimed that there is a positive relationship between age (Rhodes, 1993; Lee et al, 1985; Mottaz , 1987; Weaver, 1980 cited in Dickie at al., 2003), education qualification (Oldham et al., 1986; Arnold, 1982 cited in Dickie at al., 2003) and overall employee satisfaction. Conversely, the studies by Reudavey (2001) affirmed that there is no significant relationship between age or education qualification and employee satisfaction. In addition, length of employment has no significant relationship with employee satisfaction (O' Reilly and Roberts, 1975; Bedein et al., 1992 cited in Dickie et al., 2003) but there is a weak negative correlation found in the study by Reudavey (2001). It would appear that from previous researches, there does not seem a consistent explanation as to which correlations of employee backgrounds reliably influence employee satisfaction. For this study, however, it is believed that employee backgrounds particularly age, education levels and length of employment have positive correlation with employee satisfaction. For examples, the older employees have tendency to be more satisfied than the younger employees (Doering et al., 1983); employees convey the desire to maintain their positions by employing their knowledge, skills and education in the company where they spend their time the most. If they cannot apply their knowledge based on previous education background to their job, they will be dissatisfied; and the length of employment concerns with a number of years working within the same company. It relates to what we call loyalty. If the employees are praised and rewarded fairly for their work and feel comfortable with their working environment, they will not tend to look for another job. To sum up, it is considered that the employees' age, education qualification, and length of employment have positive correlation with employee satisfaction.
H 1a: E m plo yees' age is positively co rrelated w ith em p lo yee satisfaction
H 1 b : E m p lo y e e s' e d u c a tio n q u a lific a tio n is p o sitiv e ly c o rre la te d w ith e m p lo y e e sa tisfa c tio n
H 1 c : E m p lo y e e s' le n g th o f e m p lo y m e n t is p o sitiv e ly c o rre la te d w ith e m p lo y e e sa tisfa c tio n
Teamwork and Employee satisfaction
Greenberg and Baron (2003) defined a team as "A group whose members have complementary skills and are committed to a common purpose or set of performance goals for which they hold themselves mutually accountable". The literatures suggested that effective teamwork has the potential to provide such benefits as improved and sustained organizational out-put (Harris and Harris, 1996), refocused product design processes on the customer (Valdez and Kleiner, 1996), and helped develop competitive advantage (Twomey and Kleiner, 1996). Moreover, a major benefit of teamwork is greater coordination of departments and synergy that creates (Nurim, 1996). The advantages for the teams and team members include greater job satisfaction and companionship as well as self-esteem and self-actualization (Stainforth, 1996). Interestingly, study of Loveman (1998) in retail banking urged that teamwork is the one of the contributors to employee satisfaction besides quality of the bank, rewards and customers focus. The result is also supported by a study of Heinhuis et al., (1998) in the hospitality industry, which confirmed the relationship between teamwork and employee satisfaction. In sum, it can be argued that teamwork is positively correlated with employee satisfaction.
H2: Teamwork is positively correlated with employee satisfaction
Employee Job Fit and Employee Satisfaction
According to Mottaz (1998), employee job fit involves an employee's skill and ability to perform the job, but refers also to the employee's motives, as being well trained and fit for the job can be considered as a benefit from his/her relationship with the organizations. Employee job fit illustrates how important job design, employee selection and development are in service performance. A study of Chenet et al. (2000) in two European Airlines suggested that in order to enhance the service performance, service employees must be qualified for the job, in terms of both "serviceminded" abilities and competence (skills, experience, and motivation) and they must receive proper training in service delivery, understanding of customers' needs, recovery procedures and others. Zeithaml et al (1991) propounded the employee job fit emphasis on matching the employee to the job through selection processes and the consequent ability or skill of employees to perform the job well.
H3: Employee job fit is positively correlated with employee satisfaction
Technology Job Fit and Employee Satisfaction
Technology job fit relates to the appropriateness of the tools or technology the employees use to perform the job. Research shows that there is a causal relationship between tighter technological coupling, intrinsic job satisfaction and commitment (Corbett et al., 1989). Simply put, the benefits from the use of efficient technology increase job satisfaction and commitment. On the contrary, poor technology job fit can interfere with inadequate employee performance.
H4: Technology job fit is positively correlated with employee satisfaction
Perceived Control and Employee Satisfaction
Perceived control represents the relationship between an individual's reaction to stress and the potential for controlling these situations. (Geer, Davidson, and Gatchel, 1970; Straub, Tursky, and Schwartz, 1971; cited in Zeithaml et al., 1991). According to Averill (1973, cited in Zeithaml et al, 1991), there are three forms of control (1) behavioural control is the ability to make responses that influence threatening situations (2) cognitive control is the ability to reduce stress by the way information is processed by an individual (3) decisional control involves a choice in the selection of outcomes or goals. The higher the ability to deal with the perceived control the higher satisfaction will occur.
H5: Perceived control is positively correlated with employee satisfaction
Supervisory Control System and Employee Satisfaction
Zeithaml et al (1991) professed the view on supervisory control that is to determine the activities of supervising employees, which implies control but also all facets of social support. In a simpler term, supervisory control system is referred to the extent to which employees are evaluated on what they do (behaviours) rather than solely on output quantity. Bell and Zemker (1989) described the recent role of the supervisor as a "service coach" and believe that gaps between expected service performance and delivered service performance may be caused by a disparity between the role and the person, a lack of clarity, task priority and competence or insufficient feedback. According to Butler (1999), supervision also has a role play in co-ordinating co-operation among employees: group cohesiveness can be efficiently supported by managers if they are prepared to reward team efforts and make themselves available and visible to the team.
In addition, Study of Heinhuis et al., (1998) confirmed a strong relationship between employee satisfaction and supervisory control system. Loveman (1998), in particular, referred the supervisory control system to the customer focus and quality of the management as how the management perceived the quality and quantity of the employees' work and the leadership ability in a retail banking study. The result advocated that the SCS was one of the most important facets which contributed to employee satisfaction.
H6: Supervisory control system is positively correlated with employee satisfaction
Role Conflict and Employee Satisfaction
The role attached to any position in an organisation characterizes the set of behaviours and activities to be performed by the person in that position. The role is defined through the expectations, demands, and pressures communicated to employees by individuals (Katz and
Kahn, 1978; cited in Zeithaml et al, 1991). Role conflict arises when a disproportion exists in job requirements or between the job's demands and the employee's value and expectations (Schultz and Schultz, 2002). For example, when a supervisor is told to allow subordinates to participate in decision making and at the same time is pressured to increase production, the supervisor encounters an obvious conflict or when the job requires behaviours that contradicts an employee's morale code, such as when a salesperson is asked to sell a product known to be inferior or dangerous, role conflict can develop. In addition, due to the fact that contact employees are the connections between the organisation and the customer, they must satisfy the needs of both. The expectations of the organisation and the expectations of the consumer, sometimes, conflict. The role conflict also can arrive when the management of service organisation creates excessive paperwork or unnecessary internal obstructions (Zeithaml et al, 1991). Researches have shown that role conflict is related positively to feeling of job-related tension and anxiety and negatively to job satisfaction. In particular, role conflict can lead to less work effort and performance from employees (Lusch and Serpkenci, 1990; Lau and Huang, 1999; Chung and Schneider, 2002).
H7: Role conflict is negatively correlated with employee satisfaction
Role Ambiguity and Employee Satisfaction
Role ambiguity arises when the scope and responsibilities of the job are unstructured or poorly designed. The employee are uncertain about what managers or supervisors expect from them and how to satisfy those expectations or because they do not know how their performance will be evaluated and rewarded (Schultz and Schultz, 2002; Zeithaml et al, 1991). Many organizational variables moderate the role ambiguity experienced by service employees. The occurrence, quality, and precision of downward communication are likely to affect the service employee's role ambiguity. Downward communication engages messages used primarily by managers to direct and influence personnel at lower levels in the organization. The more frequently managers provide clear and unambiguous communication about these topics; the lower employees' role ambiguity will be (Zeithaml et al, 1991). Besides the important of communication, Chenet et al. (2000) suggested that the employee trust and commitment on company policies also play a significant influence on the employee's role ambiguity. In the line with role conflict, Behrman and Perreault (1984) postulated that role conflict and role ambiguity are not necessarily independent constructs, but the role conflict contributes to increased levels of role ambiguity. Additionally, Boshoff and Mels (1995) found that the role ambiguity has a negative influence on organizational commitment, participation in decision making of employee, and employee satisfaction. Specifically, in testing the service profit chain model in retail banking, Loveman (1998) referred the role ambiguity to the communications flow in the organisation. He claimed that the communications influenced satisfaction with the company but had no significant effect on rating of the job satisfaction.
H8: Role ambiguity is negatively correlated with employee satisfaction
RESEARCH DESIGN AND METHODOLOGY
In order to investigate the relationship between the internal service quality and employee background on employee satisfaction, a formal study which consists of quantitative research and qualitative research are conducted to examine this relationship. The formal study begins with a hypothesis or research question and involved precise procedures and data source specifications. The goal of a formal research design is to test the hypotheses or answer the research questions proposed (Cooper and Schindler, 2001). The authors, however, suggests that the formal study also contains at least an element of exploration which tends to loose structures with the objective of discovering future research task. As a matter of fact, the study is constructed to test a part of the Service Profit Chain namely, internal service quality and employee satisfaction, in an experiment with a small qualitative interview component in the data collection phase.
The dominant-less dominant design is the most appropriate one because it gives the advantage to present a consistent paradigm picture in the study and still gathers limited information to probe in detail one aspect of the study (Creswell, 1994). The dominant-less dominant design may, however, lead to the disadvantage of misusing the qualitative paradigm because the central assumptions of the study would not link or match the qualitative data collection procedure. To overcome this problem, the qualitative instrument (semi-structured interview) is developed based on the theoretical framework of the quantitative study (questionnaire as the instrument by applying 5-point Likert scale). In particular, qualitative instrument is constructed based on the measurement of internal service quality and employee satisfaction. Furthermore, in this study, the emphasis is not only on testing the theory but also on examining and exploring the relationship between internal service quality and employee satisfaction. For that reason, descriptive study and exploratory study are employed.
The sample for this study was the total employee population of a Vietnamese Food and Beverage Service Industry. The population was 140 employees currently working in the company. A total of 109 employees responded to the questionnaires, giving a response rate of 77.8%. This rate is considered to be on a satisfactory level as Water (2001) stated "a survey can expect to get replies from about 20% of the questionnaires".
The study received considerably more responses from female employees (74.3%) than male employees (25.7%), with the highest average age between 18 and 24. This can be explained by the fact that, its nature being F&B service industry in Vietnam, the company tends to employ more female than male. Up to this writing, the company workforce consists of 30% male and 70% female respectively. Consequently, the result indicated that there was an absence of any bias toward the quality of the gender responses. Prior to conducting the data, official approval was obtained from the management of the company in Ho Chi Minh City. During the data collection period, the communication was opened at least three times a week to ensure the accurateness of the procedure. Feedbacks, instructions and information were extensively provided during the collection period. Additionally, the data collectors were only trained with basic skills of interview techniques due to the limitation of time.
As aforementioned in the research design with regard to the quantitative and qualitative design, the data analysis procedure is divided into two parts including quantitative analysis that analyses the data scores from the questionnaires and qualitative analysis that analyses the data from the interview. To analyse the quantitative data, the first method is (1) correlation analysis: Pearson product-moment (r) to test the correlations between independent variables (employee backgrounds and internal service quality) and dependent variables (employee satisfaction) (2) factor analysis and regression model to answer the question of the most important facets of internal service quality which contribute to employee satisfaction. Besides, the qualitative data is analysed by using the content analysis method to get an insight understanding of how employees perceive the satisfaction level.
RESULTS
One hundred and forty employees of the company were surveyed with the questionnaire that collected information of the employee background and employee opinions regarding the quality of internal service of the organisation. Using this instrument and with a response rate of 77,8%, the study resulted in Cronbach's coefficient alpha-value of 0,7 for the internal service quality sub-measurements, and alpha-value of 0,8 for the employee satisfaction sub-measurements.
Employee background and employee satisfaction
The results show that there are no correlations between age (-.148, not significant), education qualification (.041, not significant) and length of employment (.071, not significant) on employee satisfaction. The results contradict with the study of Schultz and Schultz (2002) which advocates that older employees tend to be more satisfied in the job than the younger ones. However, the findings lend some support to Chibili (2002) contention that age does not have influence on the employee job satisfaction. The possible explanation is that the company is rather a young organisation, which was opened only few years ago. The employees' age, qualification and length of employment therefore, do not have any influence on their satisfaction. The concept, however, may change over time. In a nut shell, it can be concluded that there is no influence of employee backgrounds on employee satisfaction.
Internal Service Quality and Employee Satisfaction
There are significant correlations between internal service quality and employee satisfaction (hypothesis H2, H3, H4, H5, H6, H7, and H8). The correlation results demonstrate the importance of internal service quality towards the employee satisfaction in a Vietnamese food and beverage service industry. The interview results also support the statistic results. Noticeably, the result of hypothesis 7 yields the positive correlation between role conflict and employee satisfaction. Due to the low correlation among the items of role conflict, the interview data is suggested to use instead in testing the hypothesis. The employees agree that when the role conflict rises they tend to get more stress and less job satisfaction. Particularly, role conflict occurs frequently between the management expectation and the customer expectation. This is, therefore, concluded that the role conflict is negatively significantly correlated with employee satisfaction. This lends some support to studies of Lusch and Serpkenci, (1990); Lau and Huang, (1999); Chung and Schneider, (2002) which suggested that role conflict have positively relation to job tension and anxiety and negatively to job satisfaction and performance outcomes.
In addition, the high internal consistency among the items of the questionnaire (alpha-value of 0.7 and 0.8) upholds the notion that it is possible to apply the measurement of external service quality on internal service quality (Parasuraman et al., 1988; Zeithaml et al., 1990; and Bitner, 1996). These findings suggest that in order to achieve a certain level of employee satisfaction, the company should satisfy the employees' needs by providing a good quality of internal service. This finding at the same time is congruent to the conclusions drawn by Loveman (1998), Heinhuis et al., (1998), and Heskett et al. (1994) which tested the first part of the Service Profit Chain, the link between internal service quality and employee satisfaction. Specifically, the company should create internal service quality, which enhances the team spirit, recruits the right person for the job, provides sufficient equipment and training and suitable management system, reduces the stress and conflict in the jobs and creates a clear flow of communication. To a broaden thinking, the concept of internal service quality towards employee satisfaction is applicable in Vietnamese food and beverage service industry and Vietnamese employee context.
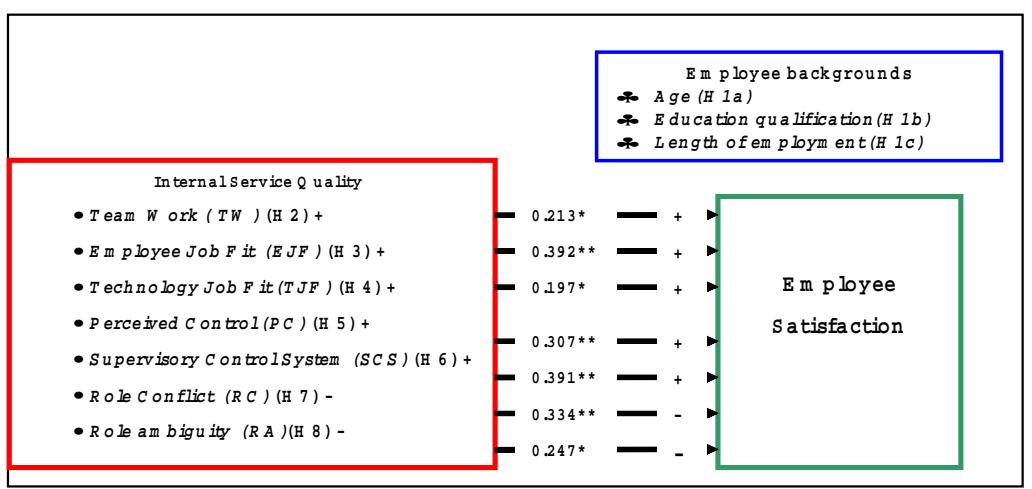
** Correlation is significant at the 0.01 level (2-tailed), * Correlation is significant at the 0.05 level (2-tailed).
Figure 3 The Result
The main issues of Employee Satisfaction
The last research question addresses the need for a better understanding of the most important dimensions of the internal service quality which influence the employee satisfaction. To address this issue, the regression analysis is proposed. The problems, however, are arisen as there are strong significant correlation levels between the measurements of the internal service quality (TW, EJF, TJF, PC, SCS, RC, and RA) in Table 1. For that reason, the exploratory factor analysis of the 24 independent items of internal service quality is conducted using a principle components analysis and Varimax with Kaiser Normalization. The results are explained as follows.
Table 1 Correlation matrix - Internal Service Quality
| TW | EJF | TJF | PC | SCS | RC | RA | |
|---|---|---|---|---|---|---|---|
| TW | 1.000 | ||||||
| EJF | .249** | 1.000 | |||||
| TJF | .448** | .378** | 1.000 | ||||
| PC | .372** | .524** | .262** | 1.000 | |||
| SCS | .496** | .576** | .337** | .495** | 1.000 | ||
| RC | .305** | .579** | .323** | .728** | .496** | 1.000 | |
| RA | .270** | .510** | .111 | .654** | .590** | .721** | 1.000 |
** Correlation is significant at the 0.01 level (2-tailed).
* Correlation is significant at the 0.05 level (2-tailed).
a. Data Reduction
Based on the relationships in the correlation matrix, the construction of a new set of variables is computed (table 2). The result of six factors explained 64.64 percent of the variance in the data. In general, the table 2 shows that factor one accounts for the largest percentage of 28.6 of the variance in the data. To follow, the second principle component, which accounts for 13.35 % of the variance in the data, is the best linear combination of variables for explaining the variance not accounted for by the first factor. The last factor, number six, accounts for only 4.6% of the variance in the data. Based on the factor analysis, six items are dropped from the original set of independent variables of internal service quality.
Table 2 Principle Components Analysis
| Initial Eigenvalues | Extraction Sums of Squared Loading | |||||
|---|---|---|---|---|---|---|
| Component | Total | % of | Cumulative | Total | % of | Cumulative |
| Variance | % | Variance | % | |||
| 1 | 6,865 | 28,603 | 28,603 | 6,865 | 28,603 | 28,603 |
| 2 | 3,205 | 13,354 | 41,957 | 3,205 | 13,354 | 41,957 |
| 3 | 1,687 | 7,028 | 48,985 | 1,687 | 7,028 | 48,985 |
| 4 | 1,436 | 5,982 | 54,966 | 1,436 | 5,982 | 54,966 |
| 5 | 1,206 | 5,024 | 59,991 | 1,206 | 5,024 | 59,991 |
| 6 | 1,116 | 4,650 | 64,641 | 1,116 | 4,650 | 64,641 |
| 7 | 0,867 | 3,612 | 68,253 | |||
| 8 | 0,857 | 3,571 | 71,823 | |||
| 9 | 0,718 | 2,991 | 74,814 | |||
| 10 | 0,699 | 2,911 | 77,725 | |||
| 11 | 0,671 | 2,796 | 80,521 | |||
| 12 | 0,620 | 2,581 | 83,103 | |||
| 13 | 0,569 | 2,370 | 85,472 | |||
| 14 | 0,461 | 1,920 | 87,392 | |||
| 15 | 0,441 | 1,836 | 89,228 | |||
| 16 | 0,431 | 1,794 | 91,023 | |||
| 17 | 0,387 | 1,611 | 92,634 | |||
| 18 | 0,339 | 1,411 | 94,044 | |||
| 19 | 0,303 | 1,264 | 95,309 | |||
| 20 | 0,294 | 1,223 | 96,531 | |||
a. Factors Explanations
In the rotation stage, the factors are transformed to make them less ambiguous and uncomplicated to explain. The correlation coefficients or so called loadings are computed between factors and the variables to observe the meaning of the factors.
Correlation - Factor one and the Independent Items
There are strong correlations between factor one and RC1, RC2, RA2, and RA3 (table 3). The details of the RC1, RC2, RA2 and RA3 are
RC1: I am not able to provide prompt responds to the customers or my colleagues due to the large amount of the administrative works
RC2: My Company emphasises on selling products to the customers so much which makes it hard for me to talk to them
RA2: I often have the feeling I do not understand the package of service, hich my company offers to the customers
RA3: I feel that our company does not offer proper training on how their employees should deal with customers and colleagues
The name of "Customer Responses -CR" for factor one is formulated based on these four statements. Customer responds is an appropriate label because this factor relates to how well the employees respond to the customers' needs and wants either with internal or external customers regarding the products, services, enquiries and others.
Table 3 Correlation - Factor one and independent items
| Factor 1 | Factor loading |
|---|---|
| RC1 | 0.86 |
| RC2 | 0.81 |
| RA2 | 0.73 |
| RA3 | 0.61 |
Correlation - factor two and the Independent Items
There are strong correlations between factor two and TJF1 and TJF2 (table 4). The factor two, therefore, accounts for the technology job fit dimension, which are
TJF1: I have received sufficient facilities and equipments to do my job
TJF2: The facilities and equipments in my department are working properly
Table 4 Correlation – Factor two and independent items
| Factor 2 | Factor loading |
|---|---|
| TJF1 | 0.87 |
| TJF2 | 0.83 |
Correlation - Factor three and the Independent Items
There are strong correlations between factor three and TW1, TW2, TW3, and TW4 (table 5). The factor three, therefore, accounts for the teamwork dimension.
TW1: I feel that I am a part of the team in the company
TW2: The service we provide for our guests is a mutual effort (everybody is involved)
TW3: A part of my responsibility is to help my colleague's to do their jobs
TW4: My colleagues and I work together more than that we compete
Table 5 Correlation - Factor three and independent items
| Factor 3 | Factor loading |
|---|---|
| TW1 | 0.75 |
| TW2 | 0.76 |
| TW3 | 0.6 |
| TW4 | 0.6 |
Correlation - Factor four and the Independent Items
There are strong correlations between factor four and SCS2 and SCS3 (table 6). The factor four, therefore, accounts for the supervisory control system dimension.
SCS2: The company gives extra wages or appreciation for the extra efforts I give to my customers and my colleagues
SCS3: In my company the employees who are willing to go the extra mile for customers or colleagues have a bigger chance of being rewarded than the other employees
Table 6 Correlation - Factor four and independent items
| Factor 4 | Factor loading | |
|---|---|---|
| SCS2 | 0.65 | |
| SCS3 | 0.78 | |
Correlation - Factor five and the Independent Items
There are strong correlations between factor five and PC2, RA1 and RC4 (table 7). The details of the PC2, RA1, RC4 are
PC2 In my job, I have the freedom to deliver the desires and wishes of customers or colleagues
RA1 The Company and I share the same philosophy on how I should do my job
RC4 I get enough information from the management about what they expect from me in my job.
The name of "Delivering Service Value -DSV" for factor five is formulated based on these three statements. The components include having sufficient knowledge about the jobs in order to delivery excellent service value to the internal or external customers.
Table 7 Correlation - Factor five and independent items
| Factor 5 | Factor loading | |
|---|---|---|
| PC2 | 0.6 | |
| RA1 | 0.55 | |
| RC4 | 0.77 | |
Correlation - Factor six and the Independent Items
There are strong correlations between factor six and EJF3, SCS4 and RA3 (table 8). The details are
EJF3 The company' hiring and recruiting practices are fair and unbiased
SCS4 I receive useful feedback about improving my performance
RA3 I feel that our company does not offer proper training on how their employees should deal with customers and colleagues
The name of "Human Resource policies-HRP" for factor six is formulated based on these three statements. HRP is an appropriate label because this factor relates to the human resource policies of the company on such functions like selection and recruitment, performance appraisal, training and others.
Table 8 Correlation - Factor five and independent items
| Factor 6 | Factor loading |
|---|---|
| EJF3 | 0.46 |
| SCS4 | 0.75 |
| RA3 | 0.6 |
Summary of the factors' labels
The factors' labels are summarized as in table 9 below
Table 9 Summary of the factors' labels
| Factors | Labels | Abbreviations |
|---|---|---|
| Factor 1 | Customer Responses | CR |
| Factor 2 | Technology Job Fit | TJF |
| Factor 3 | Teamwork | TW |
| Factor 4 | Supervisory Control System | SCS |
| Factor 5 | Delivering Service Value | DSV |
| Factor 6 | Human Resource Policies | HRP |
The results of the factor analysis are used to construct regression models relating the six factors of internal service quality (independent variables) to the employee satisfaction (dependent variables). The main reason to apply the six factors into the regression models is that the six factors are uncorrelated, which means the effects of each factor (expressed in the regression coefficients) can uniquely be attributed to the separate factors. The factors can, therefore, be ranked in terms of importance.
The findings reveal several regression models (\(Y_{Company\ Involvement}\), \(Y_{Financial\ Job\ Satisfaction}\), \(Y_{Intrinsic\ Job\ Satisfaction}\), and \(Y_{Overall\ Satisfaction}\)) to predict the important factors that contribute to the level of employee satisfaction. The models are
\(Y_{CI} = 3.786 + 0.226CR + 0.298TJF + 0.108TW + 0.253SCS + 0.182DSV + 0.174HRP\)
\(Y_{FJS} = 3.786 + 0.238CR + 0.03TW + 0.236SCS + 0.160DSV + 0.111HRP\)
\(Y_{LIS} = 3.850 + 0.226TJF + 0.180SCS + 0.147DSV\)
\(Y_{OS} = 8.633 + 0.465CR + 0.438TJF + 0.7DVS\)
These models are analysed based on the two satisfaction outcome processes that reviewed in the literature.
a. The physical process
It seems that the technology job fit plays an important role in the satisfaction outcome of the employee. In particular, with very high coefficients on \(\mathbf{Y}_{\text{CI}}\), \(\mathbf{Y}_{\text{IJS}}\) and \(\mathbf{Y}_{\text{OS}}\) (0.298, 0.226 and 0.438), employees tend to be more satisfied with the company and their jobs when the equipment and tools are sufficiently provided. In relation to the interview finding, employees show great concerned regarding the insufficient equipment, tools and suggestions how to improve the situation.
Interestingly, the result at the same time contradicts to the finding of Loveman (1998) in which the technology job fit has a negative and little impact on the employee satisfaction. The possible explanation is that the study of Loveman (1998) was constructed in the large retail banking corporation. The company, therefore, was able to allocate reasonable resources to the entire departments. In this study, the company, however, is a small enterprise with limited resources. The employees appear to receive inadequate resources to carry out the jobs. For that reason, employees in the small organisations tend to perceive the technology job fit as an important issue which contribute to company and job satisfaction.
b. Psychological process
It seems that the "Delivering service value" appears in all the four models. Importantly, the DSV plays a significant contribution to the overall satisfaction of the employees. Delivering service quality is about having sufficient knowledge about the jobs in order to delivery excellent service value to the internal or external customers. In exploring the interview data, employees claimed that the communication is the central point of the DVS. The finding, however, appears that communications are unclear in the organisation. Employees do not understand precisely what management expected from them. The explanation may answer why employees perceived that DVS is the most important issue in the psychological process. In addition, the "Customer Responses" and "Supervisory Control System" also have large contributions to employee satisfaction. Importantly, the CR plays a second important role after the DVS to overall employee satisfaction. The qualitative data reveals that despite the positive attitude regarding administration system and training on the job, professional training is not provided adequately. The SCS, on the other hand, refers to the poor performance appraisal system. The performance evaluation is not conducted in a systematic and logical way. Employees do not often receive constructed feedbacks on their performance. This issue, once again, is related to the poor communication system. These findings at the same time are congruent to the conclusions drawn by Loveman (1998), which referred to customer focus and quality of management were the largest incremental contributors to employee satisfaction in retail banking. Interestingly, the "Teamwork" plays only a little impact to employee satisfaction. The notion is also supported by Loveman (1998) which referred to low contribution of teamwork in American retail banking The result contradicts with the interview finding in which teamwork is a strong predictor for level of satisfaction. To some extent, the employees even overstate the importance of teamwork by saving that they are willing to leave the position to help their friends. The opposition in the findings seems to have the association with the low level of explained variability (R square) in the regression model in which the teamwork does not appear to have relationship with the employee satisfaction. In addition, the finding of qualitative data is supported by the study of Hofstede (2001) of individualism/collectivism dimension. In the collectivistic culture (Vietnamese cultures or Asian cultures), employees tend to value the teamwork as an important satisfaction outcome. It can be hypothesized that there is a cultural change from 'team work' to independent working procedure occur in this organisation.
To sum up, the adequate tools and equipment, communication, constructed feedbacks, training, and teamwork are the most the important issues to employee satisfaction in the organisation.
MANAGERIAL IMPLICATIONS
The key findings in the study suggest a number of managerial implications for the company expansion strategy
- First, managers can increase employee satisfaction by providing clear communication line including top-down and bottom-up communication. Employee should be able to receive general information regarding the company's situation and especially the company's development plan. Some basic methods could be applied for instance, the employee bulletin, daily staff briefing, and weekly staff meeting. Divisions, however, need to find an appropriate communication mechanism for their particular organisations and the task on hand. Essentially, managers and supervisors should be well trained in communication skills in order to provide comprehensible and accurate information to employees. In addition, the effective communication can somehow give solution to the problems of inadequate tools and equipment as recommendations and suggestions for improvement are collected from the employees. The company, therefore, will have a clear understanding on how the resources should be allocated regarding the technology job fit.
- Second, managers should treat "jobs as products", that is, designing jobs with features that prospective employee value rather than just concentrating on task requirements of the job. This is the only way of attracting and retaining the best staff. In addition, job description need to be clearly written and taught to personnel. Job descriptions need to indicate what actions can and cannot be taken. This will eliminate the unnecessary "overstated teamwork action" such as leaving the position to help others. Clear job descriptions also reduce conflicts among employees and between employees and management.
- Third, company should construct a solid performance appraisal system. The system can be simple or complex depending on the available resources. Importantly, managers and supervisor, once again, should be well trained on assessing the employee performance. Additionally, the feedbacks on employee performance should be given recurrently and be related to employee rewards and benefits. Managers and supervisor should also be aware of the different forms of rewards and benefits. Non-financial rewards should be applied efficiently in the apprising employee performance. In relation to communication mechanism, effective performance appraisal may lead to higher satisfaction level of employee job status.
- Finally, training should be provided in more professional approaches to employees. Currently, the "on the job training" is conducted mainly in the organisation without monitoring and evaluation.
- The record system should be implemented to monitor the training process. In addition, products training can be conducted by the suppliers with low cost. In the long run, however, the company should have a budget for training purposes.
LIMITATION AND RECOMMENDATION
The outcome of this study has been affected by a certain number of limitations. First, this is a cross-sectional study of employee satisfaction due to the time restriction. The concept of employee satisfaction implies change over time. The questionnaires were only distributed one time in the period of two weeks. As aforementioned, employees' perception about satisfaction level may change over a period of time depending on what they had seen, heard and experienced. This condition creates a limitation on the results application which means the results may not be accurate by the time the expansion strategy is formed. A longitudinal study will provide a more rigorous result of internal service key drivers and employee satisfaction.
Second, the quantitative instrument was constructed based on the study of Heinhuis et al., (1998). The instrument, however, was only modified based on the available literature and it shows the weakness on the measurement of role conflict and role ambiguity with low correlation among the items. In addition, the limitation of the instrument also has led to the fact that the factor analysis result only accounted for 64.4 percent of the variance in the data.
Based on the limitations, the findings suggest several directions for further research
- To replicate the study with further comprehensive modification of the instruments.
- To construct a longitudinal study in order provide more concrete results of internal service quality, employee background (such as gender and status) and employee satisfaction.
- To examine further links of the service profit chain within the organisation such as the employee satisfaction and profit, employee satisfaction and productivity.