
INTRODUCTION
Tourism Service Quality (TSQ) as a field of research is a relatively young academic discipline (Crompton, Mackay and Fesenmaier, 1991; Stevens, Knutson and Patton, 1995; Augustyn and Ho, 1998; Tribe and Snaith, 1998; Frochot and Hughes, 2000; Tsaur, Chang and Yen, 2002; Gursoy, Chen and Kim, 2005; Hwang, Lee and Chen, 2005). It has received relatively little attention in the service literature (Fick and Ritchie, 1991; Chadee and Mattsson, 1996). However, the general literature, addressing services, can be related to the tourism industry. The early quality studies have been dominated by the manufacturing sector; to the neglect of the services. Nevertheless, research in the service sector attracted an enormous interest in the 1980's which has resulted in a developing body of general literature (Parasuraman, Zeithaml, and Berry, 1985; Jarvis and Mayo, 1986; Mackay and Crompton, 1990; Crompton, et al.,1991; Frochot and Hughes, 2000; Tsaur et al., 2002; Hwang et al., 2005).
Many tourism service researchers have concentrated on specific tourism sectors like hotels (Knutson, Stevens, Wullaert, Patton and Yokoyama, 1990), ski areas (Cronin and Taylor, 1992), lodging industry (Richard and Sundaram, 1993), food service industry (Knutson, Stevens, and Patton, 1995), restaurant services (Johns and Tyas, 1996), hospitality-oriented and sports-oriented business (Nicholls, Gilbert, and Roslow, 1999) and airline service (Tsaur et al., 2002; Gursoy et al., 2005). Chades and Mattsson (1996) investigated how different service attributes affect the overall satisfaction of tourists. Their study, however, puts little emphasis on TSQ which influences the tourist's satisfaction level (Parasuraman, Zeithaml, and Berry, 1990; Gursoy, et al., 2005). Fick and Ritchie's study is comparatively comprehensive as it involved a multi-service segment (1991). It
Address correspondence to Wanjohi Kibicho, MOI University, Department of Tourism P.O Box 3692, Eldoret, Kenya. Tel: (+254) 734-443501/720-6884387, Fax: (+254) 321-63133/63257.E-mail: kibichowanjohi@yahoo.co.uk
examined airline services, hotel services, restaurant services and ski services which are some of the major sectors of the tourism industry.
This study applied the SERVQUAL model as developed by Parasuraman and his co-researchers (1985) to examine the tourists' perceptions of the TSQ in Malindi, Kenya (Figure 1). This model has been widely used and indeed cited in the management field (Parasuraman et al., 1985; 1990; Zeithaml, Parasuraman and Berry, 1990; MacKay and Crompton, 1990; Crompton, et al., 1991; Stevens, et al., 1995; Tribe and Snaith, 1998; Frochot and Hughes, 2000; Tsaur et al., 2002; Hwang et al., 2005; Gursoy et al., 2005). However, it should be noted that despite its wide application, the instrument has notable deficiencies. The service attributes that are used to measure service quality, for instance, may not represent the actual levels of service quality and/ or may not measure all the important characteristics of a particular service (See for example MacKay and Crompton, 1990; Crompton et al., 1991; Stevens et al., 1995; Frochot and Hughes, 2000; Hwang et al., 2005). However, the model still posses some value as a management tool to alert tourism service managers/providers on issues relating to the quality of their services.
Acknowledging the growing body of research on TSQ, this study is aimed at establishing the level of the service quality in Malindi's tourism industry. Thus, it investigates the factors influencing overall TSQ by identifying service attributes that the visitors particularly enjoyed and those that they feel could be improved. To achieve this objective, the survey tried to answer the following general question: given that tourism experience comprises of a series of events that may be connected or unconnected, is it possible to determine the overall TSQ in a destination?
To answer this question, two specific questions were formulated as under:
- (i) What are the principal determinants of the TSQ as perceived by tourists in Malindi?
- (ii) What is the current level of the TSQ in Malindi?
The study is also intended to provide some quantitative insights into the data-deficient aspects of TSQ in Kenya and in Malindi in particular and thus could be of use to further study.
Administratively Malindi is in the Coast province of Kenya (Figure 1). The town is located at latitude 3.2°S and longitude 40.1°E, which is 125 kilometers North of Mombasa City. It is accessible by road from Nairobi either through Mombasa or Tsavo West National Park. The development of the modern kind of tourism dates back to 1931 when an 18 beds 'hotel' was built. The hotel acted as the base for deep sea fishing off Malindi Bay for some time (Kibicho, 2002). This is where the world famous reporter on sport fishing, Ernest Hemmingway, stayed for several weeks in 1934. The hotel, classified as a 3 star hotel, is still in existence by the name The Blue Marlin. In the same year, 1934, the tourism industry was formerly launched by the then District Commissioner, Sir Leo Lawfords. He later built a makuti (coconut palm fronds) hotel in 1935 under the name Lawfords Hotel (Kibicho, 2002). The hotel still stands as a 4 star hotel. The arrival of the first group tours from Europe in 1965 displaced the local clients from the hotels. By 1968, the resort had almost tripled its bed capacity to 500. Today, on account of its beaches, Malindi has experienced a tourist boom especially in terms of hotel bed capacity. The area has a total of 4,120 beds, 42 star-rated restaurants, 28 tour operators and 517 beach operators (Kenya, 1998). Beach operators are the 3 categories of 'beach boys' recognized and regulated by the Kenya's Government (Kenya, 1998). They are curio-dealers (those who sell curios to tourists on the beaches), local boat operators (those who take tourists for deep-sea safaris) and safari sellers (those who sell various safari packages to tourists on the beaches). Other categories of beach boys (such as money changers, commercial sex workers, massage parlour operators, self-styled interpreters and guides, drug traffickers, food hawkers…) are not treated as beach operators in this study.
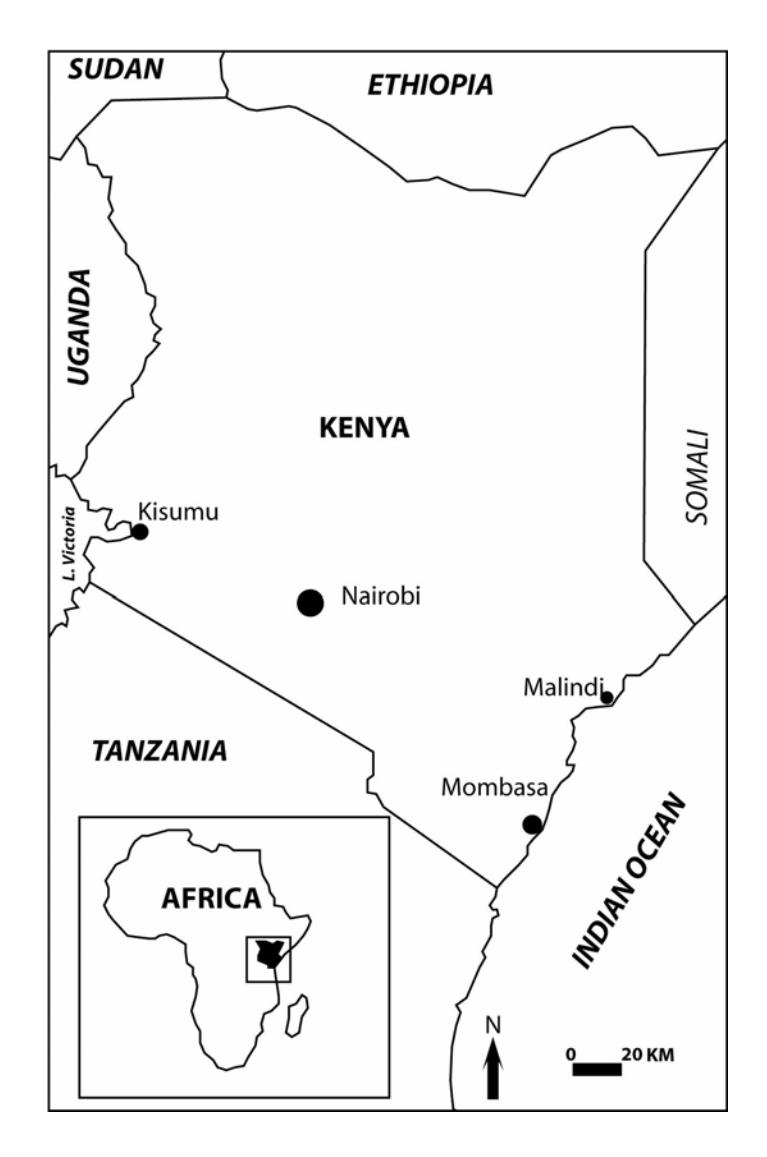
Figure 1 The Location of Malindi Area in Kenya
LITERATURE REVIEW
The SERVQUAL model states that service quality is decided by the consumers' past experience and evaluation of current performance. This model provides a framework combining the consumer's cognitive, psychological and social components. The model includes five dimensions of service quality (reliability, tangibles, responsiveness, assurance and empathy) and measures the 'gap' between consumer's expectation and perception (Mackay and Crompton, 1990; Parasuraman, Zeithaml, and Berry, 1994; Frochot and Hughes, 2000; Gursoy et al., 2005). The model's developers referred to it as a 'skeleton' which may require adjustment to meet the need of a particular organization or user (Parasuraman et al., 1985). In relation to this observation, subsequent researchers have adopted the SERVQUAL items to develop various instruments to measure service quality. For instance, Knutson et al. (1990) developed LODGSERV as an evaluation
instrument for the service quality in the lodging industry; Mackay and Crompton (1990) designed REQUAL as an evaluation instrument for recreation centres; Stevens et al. (1995) designed DINESERV as an evaluation instrument for the service quality of restaurants; Tribe and Snaith (1998) proposed HOLSAT to evaluate a tourist destination satisfaction; Frochot and Hughes (2000) developed HISTOQUAL as an evaluation instrument for historic houses services' provision. Based on these studies, the SERVQUAL model can be developed to take account of the different attributes of tourism services. The present study therefore, applies the five dimensions of this model to design 21 items for evaluation of the TSQ in Malindi.
TSQ measurements can only have operational value if they can show how the service is or is not satisfactory. Various researchers have contributed to the identification of dimensions which could be used to operationalize the concept of service quality in its broadest sense. The most common ones are the ten dimensions identified by Parasuraman and his co-researchers (Parasuraman et al. 1985; Mackay and Crompton 1990; Zeithaml et al., 1990). They subsequently mapped the ten original determinants into five underlying factors of (i) reliability: ability to perform the promised service dependably and accurately, (ii) tangibles: physical facilities, equipment's, appearance of personnel, (iii) responsiveness: willingness to help the customers and provide prompt service, (iv) assurance: knowledge and courtesy of employees and their ability to convey trust and confidence and, (v) empathy: caring, individualized attention the firm provides its customers (Parasuraman et al., 1985; Knutson et al., 1990; Frochot and Hughes, 2000).
The concept of service quality has continuously received attention by researchers and practitioners (Parasuraman et al. 1994; Vogt and Fesenmaier 1995; Nicholls et al., 1999). Service delivery, especially in the areas of service industry like tourism, hospitality and medicine has recently been recorded as a critical focal-point for businesses (Vogt and Fesenmaier, 1995). The need to offer a quality service in tourism is important. However, this is sometimes challenging to the tourism destination managers as the tourists-customers consume the tourist product/service as it is produced (at its point of production). Moreover, tourist products/services have four distinguishable characteristics, which are intangibility (they can not be 'tested' prior to their purchase), perishability (they can not be stored), heterogeneity (their production involves an inter-play of several stakeholders) and inseparability (Knutson et al., 1990; Cronin and Taylor, 1992; Richard and Sundaram, 1993; Johns and Tyas, 1996; Tsaur et al., 2002; Gursoy et al., 2005). These characteristics necessitate a close contact between the tourism service provider and the tourist-consumer. They also make it impossible for the would-be consumer/tourist to asses the service quality at the pre-purchase stage. This is a challenge both to the service providers and marketers as they are only selling a 'dream' to the tourist. This requires the destination marketers to 'invent' an effective destination positioning strategy without creating 'service gaps' (MacKay and Crompton, 1990; Echther and Ritchie, 1991; Laws, 1991; Tsaur et al., 2002). This will enable the destination to be favourably differentiated from its competitors or positively positioned in the minds of the tourists leading to increased tourist visitation (Echther and Ritchie, 1991; Frochot and Hughes, 2000; Tsaur et al., 2002; Hwang et al., 2005). A crucial tool for such positioning process is the creation and management of a distinctive and appealing perception, or image, of the tourist destination (MacKay and Crompton, 1990; Crompton, et al., 1991; Tribe and Snaith, 1998; Frochot and Hughes, 2000; Tsaur et al., 2002; Gursoy et al., 2005).
METHODOLOGY
The survey instrument was aimed at investigating the tourists' perceptions on various dimensions of tourist services as enumerated in Table 1. The questionnaire items thus followed the five
dimensions of the Parasuraman et al. (1985) service quality scale mentioned earlier on. However, these items were altered to make them suitable for the three service categories: hotel, tour operations and beach operations (see Table 1).
Generally, the questionnaire covered two main areas. The first part contained questions on demographic characteristics of respondents. Such characteristics included; sex, age, education level, marital status, nationality and occupation. Additionally, the respondents were required to indicate: the main tourist attraction in Malindi; number of their previous visits to this area; their willingness to revisit Malindi; their willingness to recommend Malindi as a tourist destination to others and their TSQ expectations on a 5-Point Scale which ranged from Very Low (1) to Very High (5). The second section covered a 21 item, 5-Point Scales anchored from 1 = Strongly Disagree to 5 = Strongly Agree. The contents of these items are detailed in Table 1.
Table 1 Tourist service dimensions
| Dimension | Item Label and Wording | |||
|---|---|---|---|---|
| Reliability | 1. Providing services as promised | |||
| 2. Dependability in handling tourists' service problems | ||||
| 3. Performing services right in the first time | ||||
| 4. Providing services at the promised time | ||||
| 5. Maintaining error free recordsa | ||||
| Tangibles | 6. Establishment with convenient service time | |||
| 7. Staff with a neat professional appearance | ||||
| 8. Visually appealing facilities associated with the service | ||||
| 9. Establishment with modern facilitiesa | ||||
| Responsiveness | 10. Keeping tourists informed about when services will be performed | |||
| 11. Prompt services to tourists | ||||
| 12. Willingness to assist tourists | ||||
| 13. Providing tourists securitya | ||||
| Empathy | 14. Staff with knowledge to answer tourist's questionsa | |||
| 15. Giving tourists individual attention | ||||
| 16. Staff who deal with tourists in a caring manner | ||||
| 17. Staff who understand the tourist's needs | ||||
| Assurance | 18. Readiness to respond to tourist's requests | |||
| 19. Staff who instill confidence in tourists | ||||
| 20. Making tourists feel safe in their transactions | ||||
| 21. Staff who are consistently courteous | ||||
a Variables omitted during the analysis as they had factor loadings lower than 0.400 across the factors.
Data Collection
Data collection was done over a three month period from October to December 2000. The study's population was defined as the tourists in Malindi who were using services offered by the three tourist service providers (hoteliers, tour operators and beach operators) in the destination during the study period. Due to the multiplicity of the present study, the researcher did not get an accurate sample frame, a complete list of the targeted population, from the study area. For this reason data collection involved two principal stages: (i) selection of the sampling units and, (ii) selection of the respondents.
In the first stage, the researcher randomly selected the sampling units which served as the representatives of the three service providers. To facilitate this selection a list of all the 'starrated' hotels (17), tour operators (28) and beach operation areas (6) was obtained from the Ministry of Tourism, Malindi Tourist Office. Computer generated random numbers were used in all the selection processes. The second stage involved random selection of the respondents. Generally, the respondents were chosen in the following manner:
- (i) Hotel services: Five hotels were randomly selected. This was followed by a random selection of 20 tourists from each of these hotels. This generated a total of 100 tourists. In all the cases complete list of tourists in the concerned hotels were obtained from the hotel managers' offices.
- (ii) Tour Operation services: Five tour operators were randomly chosen from the list of 28. A tourist was then randomly selected from a group of tourists sharing a tourvan on Tuesdays, Wednesdays and Saturdays (these days were also randomly chosen). The chosen tourists were requested to complete the questionnaires after their safari. A total of 100 questionnaires were distributed to tourists in this category of tourist service provider.
- (iii) Beach Operation services: Five out of the total six beach operation areas were randomly selected. Then five beach operators from these areas were randomly chosen. Each of these beach operators was requested to distribute 20 questionnaires to their customers. Every 4th tourists purchasing products and/or services from the selected beach operators on Tuesdays, Wednesdays and Saturdays (these days were also randomly chosen) was requested to fill-in the questionnaire. In case a selected tourist declined to complete the survey item, the questionnaire was treated as "incomplete".
A total of 300 questionnaires were distributed during the data collection period, that is, 100 questionnaires to each service category. One hundred and six usable surveys were returned. This translates to an overall response rate of 35%. Tourist service provider-specific response rates were 39% for beach operators, 36% for hotel services and 30% for the tour operations services. These low response rates could be attributed to the fact that tourists were advised to fill-in the questionnaires only once. Thus a number of unfilled-in questionnaires were returned by some tourists who had been chosen twice or three times.
A general profile of respondents is summarized below. The sample was characterized by respondents in the 41-50 age bracket mostly in their repeat visits to Malindi. The majority of the respondents were relatively old people accounting for 67% (51 years and above). Generally, the three sub-samples were compositionally similar and the total usable sample was fairly balanced between females (51%) and males (49%) bearing in mind that 53% of the total tourists to the Kenya's coastal region are female (Kenya, 1998; Kibicho, 2002). For 82% of the respondents, Malindi was the primary destination of their trip.
DATA ANALYSIS AND RESULTS
Factor analyses were conducted on the combined sample so as to scrutinize the items' dimensionality. First, a five-factor solution was obtained. This solution produced a highly ambiguous factor pattern that was inconsistent across all the three service categories. High loading on more than one-factor by many items was also noted. Further, one factor consisting of three variables was not meaningful and had low reliability (Cronbach alpha = 0.033). Existence of variables with low communalities (below 0.5) and low factor loadings were also observed. These variables were analyzed for deletion, using the criteria put forth by Hair, Anderson, Tatham and
Black (1998). Accordingly, variables 5, 9, 13 and 14 were omitted during the rest of the analysis (See Table 1). These preliminary analyses are not presented here for brevity of space.
A four-factor solution subjected to oblique rotation, SPSS Oblimin, to facilitate any possible correlation among the categories produced a factor pattern which was remarkably consistent and easy to interpret as each variable heavily loaded on only one factor. All the factors had Eigen values greater than 1.0 and none of the 17 items had low commonality. Table 2 reports the factorloading matrices of the reconfigured tourist service dimensions. Along with the matrices are the Cronbach's Reliability Coefficients for the multiple-item components. The factor loading matrices implied conformity within the items testing a similar service dimension. The internal consistency within each dimension was also found to be good as evidenced by Cronbach-alpha Coefficients ranging from 0.685 to 0.749, and the overall scale reliability obtained being 0.715 which exceeds the Nunnally's (1978) threshold of 0.7.
Table 2 Factor loading matrices and reliability coefficients for TSQ attributes
| Factor Name | Factor | Eigenvalue | % of Variance | Cumulative % |
|---|---|---|---|---|
| Loadingb | Explained | |||
| Factor 1: Reliability a | 0.722 | 2.76 | 34.3 | 34.3 |
| 1 | 0.681 | |||
| 2 | 0.720 | |||
| 3 | 0.613 | |||
| 4 | 0.575 | |||
| 16 | 0.549 | |||
| Factor 2: Tangiblesa | 0.703 | 1.61 | 10.0 | 44.3 |
| 6 | 0.580 | |||
| 7 | 0.661 | |||
| 8 | 0.708 | |||
| Factor 3: Assurancea | 0.749 | 1.24 | 7.5 | 51.8 |
| 17 | 0.528 | |||
| 18 | 0.609 | |||
| 19 | 0.725 | |||
| 20 | 0.700 | |||
| 21 | 0.617 | |||
| Factor 4: Responsivenessa | 0.685 | 1.06 | 5.0 | 56.8 |
| 10 | 0.639 | |||
| 11 | 0.593 | |||
| 12 | 0.628 | |||
| 15 | 0.503 |
a Service dimensions labels corresponds to those of the items listed in Table 1.
Table 2 shows that the predominant factor was Factor 1, Reliability. It included variables that related to the ability of the tourist service provider to provide reliable service and reflected the provider's ability to keep his promise(s). The second factor, Tangibles, related to physical environment like the appearance of the facilities used by the service providers in the process of delivering services to the tourists. The third factor, Assurance, included the variables that b Cronbach-alpha/Reliability coefficients for the combined sample. The other numbers are factor loadings obtained after oblique rotation of the initial solutions. Loadings of less than 0.400 have been omitted.
described how the service employees serve the tourists. The last factor, Responsiveness, dealt with variables that related to the willingness to meet the tourist needs by the service units. The loading patterns generally reveal that Reliability is the best combination as it makes up the first factor. Tangibles is the best linear combination, among the rest service dimensions, for explaining the variance not explained by Reliability. Assurance and Responsiveness follows respectively depending on their linear combination power to explain the variance unexplained by the preceding dimension (See Table 2). It begs noting that, Empathy as a service dimension as proposed in the SERVQUAL model was not found influential in the present study as it had low reliability scores (Cronbach's á < 0.400). Consequently this item was omitted during the analysis in accordance with Gaski's (1986: 30) recommendation.
Discriminant validity of the current battery was examined by comparing the coefficient alpha and the correlation between one dimension and another. Table 3 shows that for the five constructs, the Cronbach's alpha values for standardized variables are systematically higher than the correlation between any two tested dimensions. This implies that discriminant validity is present (See Gaski 1986). However, high correlation values of the scales indicate an existence of some overlaps among the five service attributes used in our research instrument.
Table 3 Zero Order Correlationa
a P < 0.05. bCronbach's alpha for standardized variables
The item-to-total (item-to-mean TSQ) correlations, item-to-dimension and dimension-to-total correlations were all robust (Table 4), implying that they have meaning in measuring and understanding the various aspects of the construct (Gaski, 1986). Table 4 reveals that, the overall item-to-total correlations for the three service categories ranged from 0.43 to 0.72 and they were all significant at P < 0.05. Collinearity statistics of tolerance (0.9) and variable inflation factor, VIF (0.86), show that there was no correlation among the independent variables. In all the cases, the overall TSQ was taken to be the dependent variable. Normally, tolerance values of at least 0.9 and those of VIF less than one suggest that each variable is highly a non-linear combination of the other three independent variables. The potentials of this problem were further investigated by the use of correlation analysis. The correlation matrix of simple correlation shows that there was no correlation between any two independent variables greater than 0.241, thus there was no problem of multicollinearity. These results suggest that the estimate of the variable's regression coefficient is stable, statistically independent and thus the computation has a high numerical accuracy.
The analysis also showed Reliability (Beta = 0.32; P < 0.05) and Tangibles (Beta = 0.30; P < 0.05) to have a significant influence on the overall TSQ: dependent variable. Responsiveness had the least influence on the overall TSQ. It had a Beta value of 0.11 (P < 0.05). The inclusion of the four independent variables correlates well with the overall TSQ. Consequently, this provides an answer to the first research question on the principal determinants of the TSQ in Malindi.
Factor Reliability Tangibles Assurance Responsiven
Table 4 Correlation coefficients for the combined sample (n =106)a
| Dimension | Item-Total (Range) | Item-Dimension (Average) | Dimension-Total |
|---|---|---|---|
| Reliability | 0.39 – 0.72 | 0.43 | 0.88 |
| Tangibles | 0.44 – 0.69 | 0.38 | 0.81 |
| Assurance | 0.43 – 0.67 | 0.44 | 0.77 |
| Responsiveness | 0.50 – 0.71 | 0.41 | 0.74 |
a P < 0.05
TSQ Measurements
To determine the overall TSQ score in Malindi a mean value of the three scores obtained from the three data sets was computed. The mean value was found to be 3.7 which is above average on the 5-Point Scale anchored from 1 = Very Low to 5 = Very High (Table 5). Table 5 reveals common patterns across service providers and service dimensions. With only four exceptions, the mean values for the direct measures of service quality are lower than 4 (High). These exceptions are the mean values 4.2 and 4.1 under Tangibles for tour operations and hotel services respectively and 4.1 (Assurance), and 4.0 (Responsiveness) for beach operations. Table 5 also shows that, in contrast to the rest of the service categories, Tangibles in the beach operations category performed poorly with an average score of 3.3 (Indifferent). This consistent pattern of poor ratings implies that tourism services in Malindi are below tourists' expectations for majority of the service dimensions (See Table 6). It is also discernible that, all the means across the three tourist service categories are accompanied by comparable high standard deviations. This indicates that there is high discriminatory power within the service dimensions which implies that all the items are satisfiers, rather than dissatisfiers. In other words, the presence of these service aspects will satisfy the tourists while their absence will dissatisfy them.
Table 5 Mean values of TSQ obtained from the three service categories
| Dimension | Meana | SDb |
|---|---|---|
| Tour Operations | 3.7 | |
| Reliability | 3.6 | 1.2 |
| Tangibles | 4.2 | 1.1 |
| Assurance | 3.6 | 1.1 |
| Responsiveness | 3.4 | 0.8 |
| Hotel Operations | 3.6 | |
| Reliability | 3.5 | 0.6 |
| Tangibles | 4.1 | 0.8 |
| Assurance | 3.3 | 0.9 |
| Responsiveness | 3.4 | 1.1 |
| Beach Operations | 3.8 | |
| Reliability | 3.8 | 1.1 |
| Tangibles | 3.3 | 0.7 |
| Assurance | 4.1 | 1.2 |
| Responsiveness | 4.0 | 0.9 |
a Based on a 5-Point Scale (1 = Very Low and 5 = Very High); in bold are the mean averages for the respective service category.
b Standard Deviation
Table 6 Distribution of scale values by service category
<sup>a</sup>Expectation scores are measured on a 5-Point Scale on which the higher the number, the greater the expectations of the service (See also Table 5). <sup>b</sup>Perception scores were measured on a 5-Point Scale on which the higher the number, the better the perception about the service (See also Table 5). <sup>c</sup>TSQ scores are the difference between the perception and expectation score (P-E).
Table 6 indicates that the perception scores were consistently lower than expectation scores except with regard to the Beach Operations. This resulted in a negative TSQ score (Perceptions minus Expectations, P - E). The service category with the highest expectation scores was the Hotel Operations (4.8) followed by Tour Operations (4.3). The lowest rating was with the Beach Operations (3.9), which would suggest that tourists do not expect the beach operators to influence the level of their tourism experience. For the actual tourism service (perception), Beach Operations scored the highest (3.8) followed by Tour Operations (3.7) and Hotel Operations (3.6) (See Table 6). The largest gaps were in Hotel Operations (-1.2) and Tour Operations (-0.6) services. The smallest gap was in the Beach Operations (-0.1) primarily attributable to the relatively low service expectations in this service category. The average gap for all of the three tourism service categories was -0.633, which indicates that tourist-perceived service delivery in Malindi is below the tourists' expectations. Overall, the results indicated that Malindi as a tourist destination does not meet tourists' service expectations. However, it is common for tourist expectations to exceed the actual tourist service. In fact, Bojanic and Rosen found that, regardless of the service sector, "...expectations consistently exceed perceptions by about one full point. Such a discrepancy merely suggests that, there is always a room for service improvement" (1994:7). By comparing tourists' perceptions of TSQ with their expectations, tourism's managers in Malindi would be able to determine whether the delivered service level exceeds, meets or falls below tourists' expectations. The better the difference (larger and positive) between perceptions and expectations, the higher the perceived level of TSQ. However, none is positive with regards to the current case study (See Table 6).
To obtain a greater insight into the general TSQ levels, the results were desegregated by main attraction, number of previous visits to Malindi, age, nationality, level of education and occupation of the respondents. A statistically significant relationship (P < 0.05) was found to exist between TSQ levels and the main attraction: Malindi Marine National Park, unpolluted beaches, wildlife, tourist facilities and hospitable local people. Overall, those tourists attracted by 'hospitable local people' reported higher levels of TSQ - \(\chi^2_{(56)} = 73.4\) at P < 0.05 (main attraction by TSQ). Higher levels of TSQ were also indicated by tourists in the age bracket '51 and above' - \(\chi^2_{(51)} = 60.5\) at P < 0.05 (age by TSQ) and the repeat tourists - \(\chi^2_{(55)} = 71.1\) at P < 0.05 (repeat visit by TSQ). These values indicate that, the tourists' rating of Malindi's TSQ was subject to 'what' attracted them to the area, age and past experience in the destination (repeat visits). However, no significant relationships (P < 0.05) were found with regard to nationality and education levels. This lack of statistical relationships implies that, the 'tourist defined quality' in Malindi is independent of the respondents' nationality and level of education.
Tour Ope Hotel Ope Beach Op
DISCUSSION OF FINDINGS
Tourist Defined Quality
In the tourism business like in other service sectors it is the customer/tourist who perceives quality in a tourist service, and through this perception, bestows quality on it. Basically, TSQ from the tourist's viewpoint is based on the difference between the pre-purchase perception and post-purchase perception which translates into service quality. The pre-purchase perception reflects the tourist's expectations of the service quality to be received while post-purchase are the evaluation of the service quality actually received. To illustrate this, a beach tourist expects not to be disturbed when sunbathing on the beach or swimming in the sea. In the event that, this is contravened and thus the reality is much different from the expectation, a tourist is likely to compare the experienced events with the expected quality, thereby affecting his judgment of the overall TSQ.
The relatively high TSQ scores by the beach operators/beach boys validate a brief discussion of how this informal sector of Malindi's tourism industry operates. As mentioned by earlier commentators on the subject, a Kenyan beach boy is not a boy at all but rather a young member of the host community who, as the name suggests, initiates his trade on the beaches frequented by tourists (See for example Kenya, 1998; Dahles and Bras, 1999; Kibicho, 2002). Within the body of literature on tourism destination management, little attention has been paid to the role of entrepreneurial activity and, in particular, to the local entrepreneurial culture that emerges in different destinations. General discussions of TSQ have focused on the large-scale tourism organisations and thus the literature about the actual contribution of the small-sized enterprises to the overall tourism experience remains remarkably uninformative. However, as Dahles and Bras (1999: 2) note, "there is an increasing interest in micro businesses and small entrepreneurs operating in the tourism industry …notably in the developing countries…" This interest can be related to ideological change from mass tourism to sustainable tourism development. At the same time there is a change in consumer tastes in the tourist generating areas. These changes favour smaller-scale, dispersed and low density tourism developments organized and operated by the local people where it is hoped they will foster more meaningful interactions between tourists and the locals (Dahles and Bras 1999; Kibicho 2002; Hwang et al. 2005). This, probably, explains why the tourists highly rated the services offered by the local residents – the beach operators.
Like in many destinations in the developing world, Malindi's tourism industry is dominated by multinational enterprises. Subsequently, tourism products/services are defined, owned and indeed provided by these firms. Thus, small-scale entrepreneurs, like beach operators, are involved in the provision of such products and/or services only in marginal ways. In Malindi area there are two market niches for them: (i) they provide tourism products/services which lie outside the commercial interests of the large-scale firms. Under this market category, they are involved in handcraft production and local transport (taxi) services and, (ii) they provide services that complement tourist services controlled by the dominant, large-scale multinational firms. Thus, they are involved in localized safaris (to deep seas and/or to the nearby inland protected areas), town guiding and retailing of cheap souvenirs. The positive performance of the Beach Operators on the overall TSQ in Malindi seems to suggest that, both formal and informal sectors of the tourist industry can exist side-by-side in a dual system.
From an economic viewpoint the concept of dualism gives rise to a dichotomical way of thinking in terms of 'modern' versus 'traditional' modes of production, the 'firm-type economy' versus
'bazaar economy', the 'capitalist market' versus the 'underground/clandestine market' (the activities of which are concealed from the state and withdrawn from the Government regulations for a variety of reasons) et cetera (See for example Dahles and Bras, 1999). However, with zero considerations of the importance of the existence of both 'large-scale' and 'small-scale' tourism operators at the Kenya's coastal region, the Government intends to illegalize beach operations (Kibicho, 2002). This is a clear manifestation of how Governments in the developing countries stifle the participation of small and micro-entrepreneurs in the tourism industry. In the Kenya case, the state bureaucracies expect tourism to contribute significantly to national development. In consequence, tourism 'policy' is directed towards mega-scale investments in cooperation with multinational enterprises. As the Government become dependent on these firms for the economic development of the state, their operations are given a free reign. The orientation of administrative services, labour regulations and marketing strategies all proceed in accordance with the requirements of these dominating (in most cases) foreign-owned enterprises at the expense of the informal, small-scale, locally-owned business organizations.
Favourable Impacts of Positive Orientation of TSQ
Data analyses of the current study reveal positive links between the perceived TSQ and the intentions of the tourists to 're-visit Malindi' and to 'recommend Malindi as a tourist destination to their colleagues, family members and friends'. Tourists who highly rated TSQ in Malindi also had relatively high scores when asked the possibilities of their re-visiting the destination. On the other hand, respondents who had low TSQ ratings had low scores on 'Re-visiting' and 'Willingness to Recommend' the destination to their friends. Of the respondents who rated the Malindi TSQ as 'High = 4', 90% expressed willingness to both re-visit and recommend the destination to others. For respondents rating the TSQ as 'Indifferent = 3' and 'Low = 2' and 'Very Low = 1' the percentages decreased to 56%, 37% and 19% for re-visiting the destination respectively and 26%, 11% and 0% for recommending the destination respectively. This study also found that the willingness to re-visit Malindi improves at a steeper rate (39%) as the TSQ rating improved from 'High' to 'Very High' than when it shifted from 'Very Low' to 'Low' (12%). An interesting observation is that, the ratings for the 'willingness to recommend' was either equal or less than the 'willingness to revisit' ratings. This implies that no tourist will recommend a destination he would not wish to re-visit to his friends.
Superior TSQ leads to tourist loyalty to a given destination (Zeithaml, Berry and Parasuraman, 1996). This in turn favourably influences the longevity of a tourist's relationship with the destination leading to improved profitability to the destination. It is true that loyal tourists who are satisfied with the destination's service quality are more likely than the new comers to spend more money during their visits in a given tourism destination (Tribe and Snaith, 1998). Such tourists become destination marketers through spreading favourable word-of-mouth (Augustyn and Ho, 1998). Additionally, loyal tourists will value maintaining their relationship with the destination and thus, in some instances the tourist service providers may be able to charge higher prices than other destinations (competitors) without resulting to tourist defection.
Unfavourable Impacts of Negative Orientation of TSQ
Tourists who perceive a destination's TSQ to be poor are poised to abandon it in favour of alternative ones. Such intentions are marked by tourist complaints in regards to the quality of services. In Malindi such intents are exemplified by the numerous complaints filed in the Malindi Tourist Office and the Tourist Police Office. These complaints result from tourists' dissatisfaction. If such complaints are not carefully handled, they may be followed by tourists defecting to other
destinations with similar tourism attractions (Nicholls, et al., 1999; Gursoy et al., 2005). This is so due to the fact that, positive problem resolution mechanism is related to favourable perceptions of the service provider while negative problem resolution mechanism is related to unfavourable perceptions of the provider. Importantly, a defecting tourist does not defect alone. He defects with either another tourist or a potential tourist mostly through negative word-of-mouth communication (Boeuf, 1987; Augustyn and Ho, 1998).
When a destination loses tourists, it must attract new ones to at least replace them if its existence in the global tourism market is to be maintained. Such a replacement is expensive as it requires aggressive advertisements, promotion activities and start-up operating expenses. It is worth reiterating that capturing tourists from competing destinations is equally expensive as the 'touristloosing-destination' must improve its TSQ first so as to convince tourists to switch from the competitor. More than often such an undertaking is more expensive than retaining an existing loyal tourist. To qualify this, Boeuf (1987:11) says that, such "…tourist loosing destinations spend ten times more money to get new tourists than to keep old ones". In other words, tourist/ customer loyalty is worth 10 times the price of a single purchase.
This study found that, respondents who expected 'high TSQ levels' are very sensitive to the quality of services offered. Fifty six percent of the tourists with this level of TSQ expectations score-rated TSQ in Malindi at 4 (Average level on the 5-Point Scale). Conversely, those with relatively low expectations rated the destination's TSQ higher. This confirms the observation by Zeithaml et al. (1996) that, although positive and negative associations exist between service quality and tourist favourable and unfavourable behavioural intentions respectively, tourists' perceptions of the service quality relative to their expectation levels regulate these associations. These results reveal that tourist's post-usage evaluations of the overall TSQ is dependent on his perceptions of service performance attributes via the 'gap', quite consistent with prior studies by Parasuraman et al. (1985) and Cronin and Taylor (1992). It further confirms Oliver's (1981) observation that lower expectations cause higher positive disconfirmation, which causes higher attitudes on service quality and the vice versa. These performance expectations are influenced by the pre-existing or contemporaneous attitudes about TSQ resulting from word-of-mouth communication (positive or negative), personal needs, past experience or/and external communications mainly through destination marketing.
Interesting to note that there are respondents (10%) who displayed an apparent contradictory behaviour of reporting high TSQ rates in Malindi but not willing to re-visit or recommend the destination to others. There was a link between tourists on first time-visit to Malindi and this 'negative response' with 61% of the respondents visiting Malindi for their first time - χ² (57) = 61.6 at P < 0.05 (first time visit by 'negative response'). A similar link was found between what attracted the tourists to Malindi and the 'negative response' - χ² (53) = 44.7 at P < 0.05 (principle tourist attraction by 'negative response'). However no significant difference (P < 0.05) was found on the basis of education level, age and nationality. This group of respondents, perhaps, may be the 'victims' of overly aggressive marketing by some service providers in the destination which ends-up making unachievable promises to the tourists. It should be noted that, a promise sets an expectation level, which, if unmet, can result in 'soft-satisfied' tourists whose satisfaction does not equate with a high level of TSQ and thus a reduced level of loyalty to the destination. This tourist behaviour can also be expected if there was no similar alternative tourism destination or the decision on which destination to visit rested on someone else, for example, parent, wife, husband or employer. Visiting a tourism destination although holding some negative feelings about it implies that tourist loyalty means more than simple repeat visit behaviour.
CONCLUSIONS AND IMPLICATIONS
Before deriving any conclusions, the limitations inherent in this study must be discussed. First, this study measured both the tourists' expectations and perceptions simultaneously. Though time saving, this approach has a drawback of having the tourists' expectations being influenced by the quality of services already offered. Second was a highly unforeseen problem which involved high cooperative spirit of tourists on a safari together, such that in some cases it proved difficult to create a situation in which a selected respondent could work independently from other colleagues travelling along. However, results of this exploratory survey may permit some interesting conclusions about the TSQ in Malindi.
This study has found that Reliability and Tangibles have a significant influence on the overall TSQ. Assurance and Responsiveness had the least influence on the 'general' service quality in that order. Empathy as a service dimension, as proposed in the SERVQUAL model, was not found influential as it had low reliability scores (Cronbach alpha < 0.400). Malindi's overall TSQ was rated at 3.7 (Above Average) on the 5-Point Scale by the tourists. Consequently, the TSQ score information makes it possible to pinpoint the service providers who are offering tourist services of high or low quality. The Beach Operators, for example, has a relatively high TSQ (3.8) followed by the Tour Operators (3.7). Hoteliers on the other hand, offer relatively poor services to their clients - tourists (3.6). Such information can also help in identifying particular areas of service strength or weakness. Further, it can indicate the nature of the identified strength or weakness.
The study also found that, with an increasing intensity of competition, loyal tourist base holds the key to long-term survival of tourist destinations. In lieu of these insights, Malindi as a tourist destination must strive to improve its TSQ performance. Areas of concern include; the disparity between high TSQ levels and proclivity to re-visit or recommend Malindi as a tourism destination to other people; the unexpected comparatively high performance by the Beach Operators and an equally low performance by the hotel sector in the destination; the unbalanced tourist numbers by nationality and the relatively high proportions of old and repeat tourists to the area.
The principal conclusion of the current study is that, despite its well documented theoretical and operational weaknesses, the performance-based measures of service quality captured by the SERVQUAL scale can be used to provide an index of the service quality perceptions of a tourist destination's service providers. It provides insightful and meaningful information about tourists' perceptions of a particular service. The study, for instance, found that although tourism experience comprises of a series of events, it is possible to determine a destination's overall TSQ.
These research findings suggest several directions for further research. First, only a small sample size was investigated in the study and there appear to be some theoretically-exciting, and strategically-useful relationships to be tested. Second, further research is needed to examine TSQ in Malindi from the service providers' perceptions. Such a study is necessitated by the fact that for TSQ to be optimized, the perceptions of the tourist service providers and those of the tourists need to be congruent. Conflicting opinion about such perceptions is likely to mitigate against long-term success of a destination. This study takes into cognizance the value of knowing how satisfied tourists are in Malindi and thus accordingly recommends an additional research in this area to further investigate the tourist satisfaction levels. The study should also try to determine any possible linkage between tourist-perceived service quality and tourist satisfaction. Third, the high service quality performance by the beach operators in Malindi need to be reexamined with an aim of investigating the kind of relationship which exists between these operators and the tourists. Thus, additional research could investigate the potential impact(s) of 'illegalizing' Beach Operations as the Kenya's Government intends to do. Lastly but not the least, there is need for further research to assess the high expectation levels on hotel services as well as low expectations on beach operator's services by tourists. The identification and use of such information has the potential to create a foundation of satisfied and loyal tourists.
ACKNOWLEDGEMENTS
The author gratefully acknowledges the financial support for this research by The East Africa Society of Tourism (EAST). Additionally, the author would like to thank the anonymous reviewers for their invaluable comments on the original version of this paper.