
INTRODUCTION
The introduction of the Model T Ford in the early Twentieth Century revolutionised land travel, giving travelers considerable freedom to determine the speed, route and destination of their journey. In a parallel development, rapid economic growth in many nations generated a substantial increase in personal disposable income, a growing portion of which has been channelled into recreation, leisure and, in recent decades, tourism. Almost a century after the introduction of the Model T Ford, drive tourism has emerged as a significant, although often ignored, tourism sector. In Australia, as in many other car dependent nations, drive tourism is a popular form of travel and in some cases the central focus of the holiday experience. For example, nationally, the Australian drive market accounted for approximately 70 per cent of all trips taken by domestic and international visitors in 2001 (BTR 2002). Australians accounted for 90 per cent of this market with 53 million driving holidays while international visitors accounted for slightly less than 10 per cent of the total drive market. In Queensland, where the research reported upon in this paper was undertaken, the drive market contributed an estimated AUD 3 billion to the state economy in 2000 (BTR 2001).
A major characteristic of drive tourism has been its ability to encourage city dwellers to visit rural areas. Declining rural populations, combined with the substantial size of this sector, has resulted in many rural communities viewing drive tourism as a mechanism for community survival (Laws & Scott
Address correspondence to Bruce Prideaux, School of Business, James Cook University, PO Box 6811 Cairns, Queensland, Australia. E-mail: bruce.prideaux@jcu.edu.au 2000) with tourism receipts providing employment and investment opportunities (Prideaux and Kininmont, 1999).
On the demand side, urban Australia views rural Australia as a highly desirable place to visit because of its position in Australian's view of themselves as a people and as a nation. Variously called 'the bush', 'the outback' or 'the inland', televisions shows based on rural themes are enormously popular. While rural areas hold considerable appeal, at least in principle, the conversion from interest into a visit remains difficult for a variety of reasons including low standards of infrastructure, ordinary or poor service quality, the dispersed nature of many popular attractions and the often long distances between generating regions and destinations (Laws & Scott, 2000).
An increased awareness of the significance of drive tourism and its relevance for rural communities has generated a growing body of research in this area, although in comparison to other areas of tourism research, there are many issues yet to be investigated in detail. A recent issue of the Journal of Vacation Marketing (2003, Vol 9(4)) and a monograph by Carson, Waller and Scott (2002) examined a range of issues related to drive tourism. Examples of drive tourism research include Prideaux and Carson (2003) who discussed the characteristics of drive tourism; Pennington-Gray (2003) who looked at aspects of the VFR drive market in Florida; Sivijis (2003) who examined aspects of the drive tourism policy of Tourism Queensland; Olsen (2003) who discussed aspects of themed routes; and Spotts, Kim and Holecek (1997) who investigated market segmentation of drive tourists. Previous research has examined the profile of drive tourists (Campbell, Yann Hoare Weeler, 1999); new product development ideas (Scott, 2002); motel promotion strategy development (Shanahan, 2003); success factors in attracting the drive market (Hardy, 2003); and the role of rural museums in drive tourism (Prideaux and Kinanmont, 1999). Nevertheless, despite the scope of research currently undertaken in relation to this market, gaps still exist. One area of research that needs further investigation is the understanding of this market's needs in relation to promotional strategy development. Although Shanahan (2003) has conducted some research into promotional strategy development for accommodation of the drive market in the United States of America, the areas is still largely unexplored. Given these observations, the present study was designed to explore the characteristics, behaviours and needs of the drive tourism sector in Queensland in order to develop an understanding of the target market, and to use this information to suggest possible promotional strategies for this market.
Defining Drive Tourism
Defining drive tourism is necessary to provide a scope for the literature review. A number of definitions are used to describe drive tourists. For example, Tourism Queensland (Olsen, 2002:331) describes drive tourists as 'those travelers away from home for a least one night on holidays or visiting friends and relatives using their own or a rented vehicle.' In a more expansive definition Prideaux (2002: 34) described drive tourism as "tourism that centres on travelling from an origin point to a destination by car that is either privately owned or rented, and engaging in tourism related activities during the journey". Olsen (2003) suggested that while drive tourists are not a homogenous group, they do share many common characteristics. Taking a different view, Sivijis (2003:342) stated that what constitutes a drive holiday and what comprises drive tourism is not always clear but does note that driving holidays are a significant tourism activity. For the purposes of this research the drive tourism definition developed by Tourism Queensland and outlined above, was adopted.
LITERATURE REVIEW
Identifying market segments and developing marketing mix(es) for a targeted segment(s) is at the core of effective tourism marketing (Czinkota et al. 2000; Summers et al. 2002; Weaver & Lawton, 2002;
Holloway, 2004). Market segmentation involves breaking down the market into homogenous groups of customers who have different needs and/or characteristics from one another so that specialized marketing mix(es) can be developed to suit the needs of each targeted segment(s). From a drive tourism perspective, research is required to investigate whether or not this market is sufficiently heterogenous to lend itself to segmentation and targeted marketing mix development. However, although research into drive tourism segmentation is growing (Carson, Waller and Scott, 2002; Yann, Campbell, Hoare Weeler, 1999; Hardy et al., 2004) not all research has been made available to the public (Hardy et al., 2004).
Further, while there is a growing recognition of the need for research that links promotional strategies (one of the marketing mix elements) with drive tourism market, the number of studies in this area remains limited. That is, a review of the literature indicates that while there has been a substantial growth in the understanding of the characteristics of the drive tourism phenomenon there has not been a parallel growth in the understanding of the promotional strategies that are required to sustain and grow drive tourism. Promotional strategies are a significant issue for the success of any tourism organisation or community (Shanahan, 2003) because they assist organisations to inform, persuade or remind consumers to choose a particular product and behave in a particular fashion towards the organisation's (or destination) offerings (Shim 1997; Belch & Belch, 2004).
Developing promotional strategies necessitates a range of actions some of which include deciding on:
- 1. Who to target promotional messages are effective if they are targeted to a particular segment's needs.
- 2. The aim of the promotional campaign for the target market, that is, whether the promotional campaign is designed to inform, persuade or remind.
- 3. The message to communicate which involves the expression of what the communicator wants to accomplish. From a tourism perspective, the message content may relate to transport, accommodation and recreation issues.
- 4. The message source which could involve opinion leaders or persons reflecting the target market's characteristics, that is, the person(s) involved in delivering the message to the target market.
- 5. The promotional mix needed to channel communications. Promotional mix could include a mix of personal selling, advertising, public relations, sales promotions or electronic sources. (Burnett, 1993; Neal et al., 2002; Shiimp, 2003; Kotler, 2004; Summers et al., 2004)
Moreover, promotional decisions of this nature need to be embedded within the communities' marketing orientation (Kotler & Armstrong, 2004; Cravens & Piercy, 2003; Lawes & Scott 2003; Shanahan 2003) because a community's marketing orientation is linked to effective performance (Jaworski & Kohli, 1993; March, 1994; Shanohan, 2003). Thus, promotional strategy decisions should be based on identifying the target market and their needs and wants in order to be effective. For example, the message to be communicated should be based on travel attributes (such as accommodation, activities and attractions of interest) that are important to the drive tourists (Shanahan, 2003). Similarly, determining the promotional media and message source to communicate the message with should be based on the information sources that are important to these consumers and should depict the target market respectively (Kotler & Armstrong, 2004). These issues have been summarised in Figure 1.
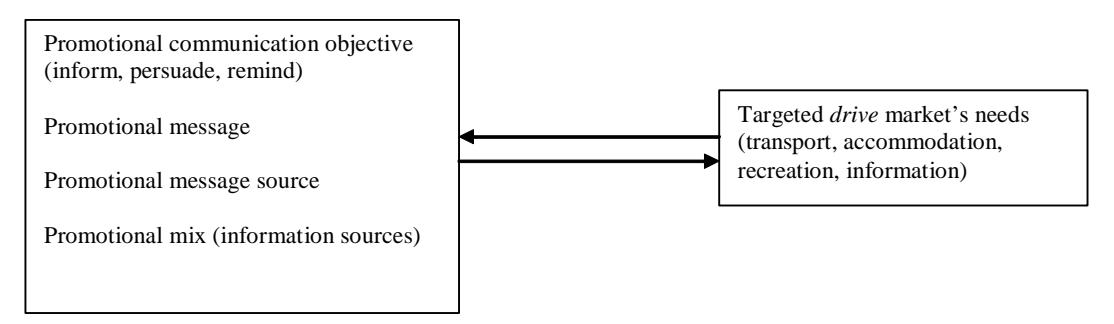
Source: compiled based on Burnett (1993); Neal et al. (2002); Shiimp (2003); Kotler (2004); Shanahan (2003); Summers et al. (2004)
Figure 1 Elements of promotional strategy development
It is apparent that while there is growing interest in the drive tourism phenomenon, there remains many knowledge gaps including research into segment identification and behaviours, for the development of a suitable suite of promotional strategies. Without detailed knowledge of visitor characteristics including information sources and identification of the range of attractions that interest this group of travellers, LGAs and the private sector have a difficult task in developing the tourism potential of their region. To develop a greater understanding of these significant issues and identify strategies that may be employed to maximise the benefits that LGAs are able to derive from drive tourism, this research was designed to investigate the characteristics of drive tourists in Queensland. The specific objectives of the study are:
- 1. to investigate the demographic and geographic characteristics of the drive tourists;
- 2. to investigate travel behaviour patterns (including travel purpose, travel party composition, type of accommodation and transportation used) of drive tourists;
- 3. to investigate the level of pre-trip planning undertaken, and the importance of information sources used;
- 4. to investigate the activities and attractions that are of interest to drive tourist; and
- 5. to investigate whether segments with differing information needs and attractions are present.
ANALYSIS
A survey of drive tourists was determined to be the most appropriate method of gathering data to investigate the issues outlined previously. Data was collected in 2003 from drive tourists passing through Goondiwindi, a small regional Queensland community that is located adjacent to a major interstate north-south highway. Goondiwindi has very limited tourism appeal and functions primarily as an overnight stop for visitors travelling from New South Wales and Victoria to Queensland or Queenslanders travelling to southern states (McClymont and Prideaux, 2005).
The target population comprised individuals travelling by private, vehicle (including four wheel drives) through Goondiwindi during the enumeration period. To capture this population a sampling frame of accommodation, fast food outlets and petrol stations located in Goondiwindi were used as distribution points for the survey. Tourists passing through the town and who stopped at petrol stations and fast food restaurants were approached and asked if they would participate in a mail back survey. If the response was positive a prepaid mail back survey was given to them. To capture the visitors staying overnight, questionnaires were placed in individual accommodation rooms prior to occupation. Collection was carried out by reception and completed surveys were returned at the conclusion of the three-week period in reply paid envelopes. All travelers were asked a screening question to ensure that they were travelling through the town.
A pilot test was undertaken with 30 respondents who had previously traveled through Goondiwindi. The results were used to calculate a mean and a standard deviation for one of the information sources used in the survey. These two measures were used to calculate the sample size of 95 based on a confidence interval of 95%. With an estimate response rate of 10% for mail surveys (Cavana, Delahaye & Sekaran, 2000) a total of 960 questionnaires were given out. A total of 156 usable questionnaires were returned giving a better than expected response rate of 15.6%.
Table 1 Demographic characteristics of respondents
| Demographics | Frequency | Valid Percent (%) |
|---|---|---|
| Gender | ||
| Male | 74 | 47.4 |
| Female | 82 | 52.6 |
| Total | 156 | 100.0 |
| Age | ||
| Under 24 | 15 | 9.8 |
| 25-34 | 13 | 8.6 |
| 35-44 | 26 | 17.1 |
| 45-54 | 35 | 23.0 |
| 55-64 | 42 | 27.6 |
| 65 and over | 21 | 13.8 |
| Total | 156 | 100.0 |
| Occupation | ||
| Retired | 45 | 29.6 |
| Professional or associate professional | 41 | 27.0 |
| Manager or administrator | 13 | 8.6 |
| Clerical, sales or service worker | 13 | 8.6 |
| Primary producer | 10 | 6.6 |
| Tradesperson or related worker | 10 | 6.6 |
| Student | 10 | 6.6 |
| Other | 10 | 6.6 |
| Total | 152 | 100.0 |
Source: research results
LIMITATIONS
As with any study of this nature the snap shot approach captures only a small percentage of the total flow of drive tourists who pass through Goondiwindi and significant seasonal variations such as school holidays may be missed. As a consequence, the results should not be seen as representative of an entire year and results should not be generalized for all drive tourism activities in Queensland. If the survey had occurred during the school holiday period the number of respondents travelling with families would have been expected to be higher.
RESULTS
Objective 1: Characteristics of drive tourists.
Table 1 outlines respondents' gender, age, and occupation. Results show that the sample was almost equally split between males (47.4%) and females (52.6%). There was a much greater variation in age with 18% of respondents aged under 35 years, 40% aged between 35 and 55 years and 41.4% aged 55 years and over. The most significant occupation categories were retired (29.6%), professional/semi professionals (27%) followed by administration/manager (8.6%), clerical/service workers (8.6%) and primary producers (6.6%). These results are similar to research undertaken on the caravanning market in Queensland (McClymont & Prideaux, 2004).
Table 2 State of Origin and State of Destination
| Frequency | ||
|---|---|---|
| Origin | N=151 | Valid Percent |
| Victoria | 23 | 15.2 |
| South Australia | 10 | 6.6 |
| Tasmania | 8 | 5.3 |
| Queensland (all areas outside of Goondiwindi) | 64 | 42.3 |
| New South Wales | 40 | 26.4 |
| Western Australia | 4 | 2.6 |
| International | 2 | 1.3 |
| Total | 151 | 100.0 |
| Final destination | n=127 | |
| Victoria | 8 | 6.3 |
| South Australia | 4 | 3.1 |
| Tasmania | 3 | 2.4 |
| Queensland | 80 | 63.0 |
| New South Wales | 30 | 23.6 |
| Western Australia | 1 | 0.8 |
| Northern Territory | 1 | 0.8 |
| Total | 127 | 100.0 |
Source: Research results
Respondents were asked to indicate their origin and final travel destination (Table 2). Results show that the majority of respondents originated from Queensland (42.3%), New South Wales (26.4% ) and Victoria (15.2%). Other states contributed less that 15% of all visitors. Overall, the final travel destination for the majority of respondents was Queensland (60%) followed by New South Wales (23.6%).
Objective 2: Trip behaviours exhibited by drive tourists.
Table 3 illustrates trip characteristics including, purpose of trip, travel party composition and main form of transport and accommodation used. The main trip purpose was for holiday (59.1%). A smaller number of respondents were engaged in travel for business and training (16.1%), visiting family and friends (14.1%), or a special event/ recreation/ sport (7.4%). The main travel parties were adult couple (47.7%) and family group (29.4%). The remaining 25% of respondents traveled alone or in non-family group tours or with business associates.
The main types of accommodation used were motels/hotels (54.7%) and caravan parks (33.7%). Few respondents stayed in other forms of accommodation such as pubs, backpackers, bed and breakfast or with family and friends. The primary form of travel was by private car (85.1%) followed by motor home/campervans (11.7%).
Objective 3: Trip planning and information sources.
Respondents were asked about their pre-trip planning activities (Table 4). The majority of respondents (91.7%) planned some or all of the route to be travelled while another 34% planned some of the route. Similarly, most respondents (82%) planned all or some of the towns to be visited during their trip.
In contrast, only a little over half (56.8%) of respondents planned all or some activities and attractions to be undertaken and visited during their trip. The remaining respondents, either did not plan (22.6%) or did not visit any attractions or undertake any activities.
Just under half (45.45%) of respondents reported that they did not consult information sources during their trip. It is interesting to note that although most respondents planned the route and towns to be travelled, around half of these planners did not use any external sources of information. This situation indicates that these respondents are relying on internal information sources such as personal knowledge and memories of previous trips to make travel decisions. This finding is not surprising given that a substantial number of respondents are from Queensland and may have been familiar with the area and its offerings. Results for information sources discussed next relates solely to those who did use information sources.
Those respondents who did use information sources to plan their trip were asked to rate the level of importance of various travel information sources as shown in Table 5. The most importance sources of information were Royal Automobile Club Queensland (RACQ) and National Roads and Motorist Association (NRMA) maps, Goondiwindi visitor center and visitor brochures, prior knowledge, road signs and word of mouth communication. Respondents were neutral towards information on the Internet, radio and Western Downs touring guide and found information in other guidebooks unimportant.
Table 3 Travel details
| Travel details | Frequency (n=144) | Valid Percent |
|---|---|---|
| Holiday | 88 | 59.1 |
| Business/ Training | 24 | 16.1 |
| Visiting Friends/ Relatives | 21 | 14.1 |
| A Special Event ( Festival/ Entertainment) | 6 | 4.0 |
| Recreation/Sporting | 5 | 3.4 |
| Total | 144 | 100.0 |
| Travel party | (n=153) | |
| Adult couple | 73 | 47.7 |
| Family group (parents &children) | 45 | 29.4 |
| Travelling alone | 25 | 16.3 |
| Independent adults part of a travel group | 5 | 3.3 |
| Business associates | 5 | 3.3 |
| Total | 153 | 100.0 |
| Main type of accommodation used on this trip | (n=95) | |
| Motels/Hotels | 52 | 54.7 |
| Caravan/Caravan Parks | 32 | 33.7 |
| Friends/Relatives | 7 | 7.4 |
| Pubs | 2 | 2.1 |
| Backpackers | 1 | 1.1 |
| Bed & Breakfast (B & B) | 1 | 1.1 |
| Total | 95 | 100.0 |
| Primary mode of transport used on this trip | (n=154) | |
| Car | 131 | 85.1 |
| Motor home/camper van | 18 | 11.7 |
| Hire Vehicle | 3 | 1.9 |
| Bus/Coach | 1 | 0.6 |
| Truck | 1 | 0.6 |
| Total | 154 | 100.0 |
Source: Research results
Table 4 Level of planning of travel itinerary
| Items planned for | Frequency | Valid Percent | Significance |
|---|---|---|---|
| Planning of the route of the travel | (n=156) | ||
| Plan the complete route that you intend to travel | 90 | 57.7 | |
| Plan some of the route | 53 | 34.0 | |
| Did not plan at all | 13 | 8.3 | |
| Total | 156 | 100.0 | |
| Planning of the towns to visit | (n=153) | ||
| Plan all the town(s) you wanted to visit | 62 | 40.5 | |
| Plan some of the town(s) you wanted to visit | 64 | 41.8 | |
| Did not plan any of the town(s) you wanted to visit | 27 | 17.6 | |
| Total | 153 | 100.0 | |
| Planning of the activities and attractions to do | (n=155) | .033* | |
| Plan all of the attractions and activities you wanted to do | 24 | 15.5 | |
| Plan some of the activities/attractions you wanted to do | 64 | 41.3 | |
| Did not plan any of the attractions/activities you wanted | 35 | 22.6 | |
| Did not visit attractions or participate in activities offer | 32 | 20.6 | |
| Total | 155 | 100.0 |
Key: * = significant at 5%
Source: Research results
Although the first six sources of information seem to have the same median, a Wilcoxon sign rank test was used compare each and every pair of these six sources to determine whether they were in fact equally important (this non-parametric test was used because the data violated assumptions of normality explain in more detail as a sentence). A total of 15 comparisons were run and only two pairs were significantly different. The results showed that NRMA/ RACQ maps were significantly more important than visitor brochures and word of mouth communication but not significantly more important than the visitor center and prior knowledge. Other pairs differed in importance levels however the differences were not large enough to be significant.
In summary, although most respondents pre-planned all or some of the travel route and towns to be visited, only half of these respondents pre-planned any activities or attractions for their trip.
Furthermore, only around half of all respondents relied on any external information sources to plan any of their trip and those who did, found NRMA/ RACQ maps to be equally important to the information center and prior knowledge but more important than other sources. This finding raises some significant issues for local tourism bodies, particularly in the selection of strategies designed to promote their region.
Table 5 Level of importance of information sources for respondents
| Sources of information used | N | Mean | Std. Deviation | Median |
|---|---|---|---|---|
| NRMA/ RACQ Maps | 63 | 4.05 | 1.069 | 4.00 |
| Goondiwindi visitors center | 56 | 3.84 | 1.359 | 4.00 |
| Prior Knowledge | 59 | 3.61 | 1.232 | 4.00 |
| Goondiwindi visitors brochures | 50 | 3.60 | 1.385 | 4.00 |
| Word of mouth communication | 48 | 3.50 | 1.321 | 4.00 |
| Roads signs directing to Goondiwindi | 73 | 3.38 | 1.613 | 4.00 |
| Internet | 46 | 3.30 | 1.489 | 3.00 |
| Radio advertisements | 41 | 2.88 | 1.552 | 3.00 |
| Western Downs touring guide | 35 | 3.03 | 1.524 | 3.00 |
| Lonely Planet travel guide | 31 | 2.29 | 1.371 | 2.00 |
| Work about Australia travel guide | 31 | 2.48 | 1.546 | 2.00 |
Source: Research results
Objective 4: Activities and attractions
The most frequently selected attraction/activities reported by respondents were visiting a historical attraction (48.1%) followed by dining out (46.1%), shopping (38.3%) and visiting botanical gardens (32.5%). Other activities such as bush walking, attending an event/festival, river activities, having a BBQ lunch and visiting galleries/antiques were selected by a quarter or less of respondents.
Clustering these activities into recognized grouping such as heritage tourism (historical attraction), nature tourism (botanical garden/river activities/bird watching/bush walking), food (dining out/BBQ) and cultural tourism (guided tours/art galleries, events and festivals) indicates that the clusters with the greatest interest were nature tourism (188 positive responses) followed by food (111 responses), cultural activities (101 responses) and heritage (74 responses).
Table 6 Activities and attractions of interest to respondents
| Activities undertaken | N | Frequency | Percent |
|---|---|---|---|
| Visiting a historical attraction | 154 | 74 | 48.1 |
| Dining out | 154 | 71 | 46.1 |
| Shopping | 154 | 59 | 38.3 |
| Visiting a local botanical garden | 154 | 50 | 32.5 |
| Bush walking | 152 | 42 | 27.6 |
| Attending event/festival | 154 | 41 | 26.6 |
| Activities on river | 154 | 40 | 26.0 |
| Having BBQ/Picnic | 154 | 40 | 26.0 |
| Visiting galleries/antiques | 154 | 36 | 23.4 |
| Camping | 154 | 31 | 20.1 |
| Bird watching | 153 | 25 | 16.3 |
| Guided tour of the local area | 153 | 24 | 15.7 |
Source: Research results
Objective 5: differences between drive tourist segments.
The previous discussion described the characteristics and behaviours of respondents as a group. The following discussion will focus on the final research objective which is to investigate if differences exist within the group of drive tourists surveyed.
Given that the amount of pre-trip planning of attractions/activities differed significantly between groups (as shown in objective 3), this difference was used as a basis for further comparisons between the two groups. Firstly, this research investigated whether respondents who planned their activities/ attractions were more inclined to rely on external information sources to assist them in their planning. It was assumed that planning requires information and so, travelers are more likely to rely on information sources if they plan the attractions to be visited. A Mann-Whitney- U test was used with a 95 per cent confidence interval to test this hypothesis. The results showed a p value of .033 which can be used to conclude that a greater level of importance is attached to information sources for the group of drive tourists who had planned activities/attractions prior to undertaking their trip.
Next, in order to make these two groups more measurable, this research investigated whether or not those who planned their activities/attractions prior to their trip differed demographically from those who did not. A Mann-Whitney-U test and a Kruskal Wallis test were used to investigate whether or not gender and age, and occupation and travel party respectively explained the differences between planners and non planners as shown in Table 7. The percentage of respondents who planned was greater in the under 35 age group compared to the percentage of those who planned in the over 35 age group. There were no significant differences in planning activities for the other three variables of gender, occupation and travel party.
Table 7 Significant differences in frequencies of ages and planning for attractions/activities
| Demographics | Significance | ||||
|---|---|---|---|---|---|
| Planned some or all activities | % | Planned no activities | % | ||
| Age group | .028 | ||||
| Under 35 years | 18 | 90.0% | 2 | 10.0% | |
| 35 years and over | 66 | 66.7% | 33 | 33.3% | |
| Total | 92 | 100% | 100% |
Source: Research results
Table 8 Differences in activities and attractions based on gender and travel party
| Demographics | Activities | |||||
|---|---|---|---|---|---|---|
| Shopping | ||||||
| Gender | Yes | % | No % | |||
| Male | 22 | 30.1% | 51 | 69.9% | .048 | |
| Female | 37 | 45.7% | 44 | 54.3% | ||
| 59 | 95 | |||||
| Visiting a local botanical | ||||||
| Gender | Yes | % | No | No | .049 | |
| Male | 18 | 24.7% | 55 | 75.3% | ||
| Female | 32 | 39.5% | 49 | 60.5% | ||
| Activities on river | ||||||
| Any children | Yes | % | No | % | ||
| Yes | 21 | 21.2% | 78 | 78.8% | .029 | |
| No | 19 | 38.0% | 31 | 62.0% | ||
Source: Research results
Finally, this research investigated whether the activities/attractions of interest to planners differ from non planners, and this was tested using a chi square with a 95 per cent confidence interval. Results showed that there were no differences in activities and attractions of interest to planners and non planners.
In brief, the analysis showed that although those who plan trip activities and attractions tend to be more reliant on external information sources and are younger, they nevertheless do not differ significantly from non planners in relation to the attractions and activities of interest and their origin of residence.
This research also investigated whether differences in demographic characteristics of respondents impacted on the activities/attractions they were interested in visiting. Since there were some differences in the demographic make-up of this otherwise, almost homogenous group of respondents, this research investigated whether these differences may have impacted on activities/attractions of interest as part of identifying segments for targeting and promotional strategy development. Characteristics such as gender, age, occupation and travel party were each tested using Chi square statistics with a 95 per cent confidence interval. The results showed that there were no significant between demographics and travel characteristics for most activities. The only significant differences found were that more females than males preferred shopping and visiting botanical gardens, and river activities were more popular for travel groups without children as illustrated in Table 8.
CONCLUSION
It is apparent that there is considerable potential for drive tourism to generate revenue for rural communities. Firstly, communities may be able to attract tourists by developing experiences that capture the values and experiences that they believe comprise an 'outback', 'inland' or 'bush' experience. This development may entail providing additional attractions that are seen to be differentiated from coastal or near periphery attractions; however, this issue was not examined in this paper. Another parallel strategy, could involve developing effective promotional strategies to entice the visitor to stop for longer periods of times in regional areas.
The significance of drive tourism is evident by the investment that many governments have made into developing themed drive routes. For example, drive tourism has become an area of interest for tourism development in South Africa (Briedenhann and Wickens 2004). In the US, Route 66 is a major drive route that transects the nation while on a smaller scale routes such as the Cascades Loop in Washington State and the Great Texas Coastal Birding Trail have become tourism icons (Hardy 2003). In the 1990s, Australia experienced a noticeable increase in funding for the development of themed drive routes (Hardy, 2003). These provided a useful stimulus for economic growth in regional areas (Carson and Waller, 2002, Briedenhann and Wickens, 2004; Laws and Scott, 2003). In Queensland, the state government funded the AUD $110 million Heritage Trails Network as part of a Centenary of Federation project. However there is some danger in regional areas looking to drive trails of this nature as a panacea for development. Unless properly resourced with ongoing funding for maintenance and promotions drive trails are likely to face significant problems in continuing to attract visitor interest. Prideaux (2002) criticized the Queensland Heritage Trails Network scheme for its lack of ongoing funding for ongoing administration, promotion and maintenance of the interpretative centres that were built. A recent survey by the authors of this paper of the level of promotion of the drive tourism trails established under the Queensland Heritage Trails Network scheme revealed that the original promotional material had not been replaced and there were few roadside signs to notify visitors that they were travelling on one of the designated trails.
Finally, there are implications for further research. This study developed a preliminary framework for promotional strategy research and development for rural communities. The preliminary nature of investigations resulted in a broad scope that focused briefly on many elements of promotional strategy rather than focusing in more depth on elements of the promotional strategy. Therefore, each element of the promotional strategy framework requires more in-depth attention. Also, this research based its findings on a small geographic area of Australia and as such may not be representative. Therefore, a more comprehensive sample is required to provide more conclusive results. Finally, other elements of the marketing mix play important roles in developing a winning marketing campaign and these should be focused on in further research.