
INTRODUCTION
Traditional acoustic environment research mainly focuses on interior sound quality design and noise pollution. As many specialized halls, such as concert halls, theaters and those for musical performance have come to existence, acoustic research that aims at "Improving Interior Sound Quality" to acceptable levels is a rising issue among designers. In addition, pollution in large cities is an ever-growing problem as the urban environment becomes increasingly crowded. As with the evolution of urban ecology policy, the aim of acoustic research is not just to preserve specific areas but to consider the value of local access to places which can provide valued sanctuaries from noisy surroundings. For
Address correspondence to SHI Jianren, College of Tourism, Zhejiang Gongshang University, Xia-sha, Hangzhou City, 310018, P.R.China. Email: jrshi2002@163.com
architects, city planners or landscape designers, knowledge and references are limited in the area of acoustic environment design (Durmisevic and Sariyildiz, 2001). Many field studies mainly cared for physical measurements of urban noise, subjective evaluations remain sporadic, and urban noise is still considered as unwanted sounds.
Human perception of noise, in contrast to a physical instrument such as a sound level meter, is not absolute and mainly relies on the meaning of sounds that relates to the sources emitting noise and the people who are exposed to it. Therefore, assessment of a sound environment depends on the information content of the sound and the context in which it is perceived (Southwork, 1969). Two main consequences are: first, to account for the assessment of noise subjective impact in correlation with acoustic parameters, and second, to account for both negative and positive effects of noise in defining the acoustic quality of an urban environment (rather than exclusively focusing on noise annoyance).
Within this framework, our position integrates the notion of soundscape initiated by Schafer (1969) as an auditory correspondent of landscape, considering environments and musical compositions as well, and that may be one way to account for noise in cities in a more positive manner, and as a concept to account for subjective experience. The concept explicitly refers to sound variations experienced in space and time, grounded in the topography of the built-up area and different sounding sources. As landscape is viewed as a subjective, personal interpretation however shared by communication, and the sonic environment exists through the discernment and understanding of individuals, groups and societies alike (Truax, 1978). The soundscape thus accounts for the relationship between the individual experience and subjectivity with a physical and a socio-cultural context.
In his studies of soundscape evolution, Schafer (1977) describes more precisely urban soundscapes as complex sonic environments and as cues about socio-cultural life throughout history. The new trend of ecological psychology research also takes into account to the fact that natural urban sound environments are always perceived within a simultaneous multi-sensorial setting, in which the diverse sense modalities interact with auditory judgments. The experience of hearing events in the world is the result of interaction between an object at a given time in a given environment (Southwork, 1969) being. Differentiations between soundscapes can add quality to an environment from annoyance thus improve urban development (Skanberg and Ohrstrom, 2002). In our opinion, more explicitly claims the need of a close collaboration of physical science and engineering associated with human sciences, such as psychology and sociology (Augoyard, 1999). The essential role of urban planners in making decisions thus has to deal with connecting at least two domains, human sciences and physics. One question remains: How to deal with a set of physical parameters collected from experts' reports and the globally meaningful representations of city-users?
Reports of previous work on soundscapes strengthen the importance of meanings given to sound sources as cues within a global interpretation that integrates multi-modal experience as well as what is generally considered as "context" (Carles et al., 1999). The background noise or ambient noise context appears to influence the reaction to a specific environmental noise. These findings actually highlight the significance of other aspects depending on the context that drives the interpretation of acoustical features, such as the structure of urban areas, architectural (visual, aesthetic) lifestyles and social parameters (Schulte-Fortkamp, 2002). Therefore there is no simple conclusion about the role and importance of non-acoustic factors associated with environmental noise. For example, onsite analysis of sound ambient environments shows that various urban situations with similar noise exposure levels such as the vicinity of a playground in a residential area, a town square with commercial and leisure activities or a city-center market square, do not present the same assessment and depend on the activities producing the noise (Raimbault et al., 2003). Moreover, non-acoustical features of the environment influence its soundscape assessment, such as areas where air pollution is obvious or neglected visual aspects (Job, 2001). The visibility of an unwanted noise source may also add negative reactions to the soundscape itself even if the noise is out of earshot (Viollon et al., 2002). Similarly, living on a "pretty street" could reduce noise annoyance (Lercher and Schulte-Fortkamp, 2003).
Therefore it is now widely accepted that a personal response depends as much on the listeners' state of mind and attitudes (psychological and sociologic factors) that drive their interpretation as on physical noise level alone. We therefore suggested a more subject-centered methodology that aimed at evaluating the diversity of meanings from annoyance to pleasure in an urban environment that contributed to better understanding of sound quality criteria in cities and to provide keys for soundscape design and management.
The aim of this study is to analyze the sound-image coherence in greater depth, identifying the specific contribution of each stimulus to the total landscape value. In short, our aim is to show how the acoustic impact on landscapes and, in particular, on those most highly regarded by the population. Through the evaluation on the influence between visual and acoustic stimuli interaction on perception of the environment, it is proved that there is a need to identify places where the sound environment conservation is essential, due to the drastic impact of the loss of sound quality or its salient informational content on human appreciation, especially in theme spaces, and folk-custom landscapes. As a result, the spatial partition of soundscape is also necessary with the movement of the visual images. Finally, some design guidelines regarding soundscape are proposed with the illustrations of four typical lakefront spots.
METHODS
Mean Analysis
The mean is a particularly informative measure of the "central tendency" of the variable if it is reported along with its confidence intervals. The confidence intervals for the mean give us a range of values around the mean where we expect the "true" mean is located. In this study, we obtain the basic situation of soundscapes in the 13 spots around West-Lake through comparing the mean of their satisfaction evaluation.
Principal Components Analysis
The main applications of factor analytic techniques are: (1) to reduce the number of variables and (2) to detect structure in the relationships between variables, that is to classify variables. Therefore, factor analysis is applied as a data reduction or structure detection method (the term factor analysis was first introduced by Thurstone, 1931). Principal components analysis is a main implement of factor analytic techniques. Its basic principle is expressing two or more variables by a single factor, thus reducing the number of variables. Considering the 112 persons as variables, we operate principal components analysis to the 13 spots and work out the scores of every spot on every principal component.
Cluster Analysis
Clustering techniques have been applied to a wide variety of research problems. Hartigan (1975) provides an excellent summary of the many published studies reporting the results of cluster analysis.
For example, in the field of psychiatry, the correct diagnosis of symptom clusters such as paranoia, schizophrenia, etc. is essential for successful therapy. In archeology, researchers have attempted to establish taxonomies of stone tools, funeral objects, etc. by applying cluster analytic techniques. In general, cluster analysis is a great utility whenever one needs to classify a "mountain" of information into manageable meaningful piles. In our research, the 13 spots are classified, grounding in the score on the first and the second principal component.
Stimuli
Thirteen spots with images and sounds were selected covering natural and semi-natural scenes and urban open spaces on a parallel variability scale of similar environmental situations (Table 1). Sounds ranged from the purely natural, without human presence, to those containing voices or mechanical sounds caused by human activity. In choosing the images a balance was sought between built-up and natural elements. Exclusively urban images without any natural element were excluded from the selection. In five cases, the correspondence between sound and image represented the most likely association in reality.
Natural sounds are normally associated with gentle variations in volume and tone. Likewise natural landscapes are associated with an abundance of vegetation. The sample comprised 13 different sound-image combinations. The sound fragments chosen combined a number of elements to make up a simple, easily recognizable soundscape in which each part was clearly distinguishable. Each fragment lasted around 30s.
Table1 Image and Sound Elements Recorded in Every Spot
| No. | Spot | Images | Sound | ||||
|---|---|---|---|---|---|---|---|
| 1 | Quyuan Park | Trees, Grass, Lake, Buildings | Music, Birds, Insects, Voice, Wind | ||||
| 2 | Music Fountain | Spring, Lake | Music, Voice, Noise | ||||
| 3 | Jingci Temple | Temple, Trees | Bell, Chanting | ||||
| 4 | Bei Shan Road | Road, Shops, Lake | Voice, Noise | ||||
| 5 | Oriole-Willow Park | Trees, Grass, Lake, Buildings | Music, Birds, Insects, Voice, Stream | ||||
| 6 | Yang Gong Bank | Trees, Grass, Lake, Buildings | Music, Birds, Insects, Voice, Stream | ||||
| 7 | Wu Shan Square | Hill, Plaza, Trees, | Music, Voice, Noise, Higgler, Wind | ||||
| 8 | He Fang Street | Shops, Snack bars, Herbal medicine shop | Voice, Noise, Higgler, Drama | ||||
| 9 | Hu Bin Road | Trees, Grass, Lake, Buildings | Music, Voice, Noise | ||||
| 10 | Bai Bank | Trees, Grass, Lake, Buildings | Water, Voice | ||||
| 11 | Solitary Hill | Trees, Grass, Lake, Buildings | Birds, Insects, Voice | ||||
| 12 | Flowery Pond Park | Trees, Grass, Lake, Fish | Birds, Insects, Voice | ||||
| 13 | Yuquan Park | Trees, Grass, Stream, Fish | Birds, Insects, Voice, Stream | ||||
Procedure
The visual and sound stimuli were presented first separately and then in combinations. Subjects had to rate, first, each image, then each sound and finally, each combination in terms of pleasure on a fivepoint scale (1 - very unpleasant; 5 - very pleasant). Application of the test took around 25 minutes. Valuations of images, sounds and combinations were carried out in the same order, in a single session, by the 112 individuals participating in the experiment.
Images and sounds were presented to groups in an acoustically conditioned room under good conditions of visibility. Participants were placed at a distance of between 4 and 10 meters from high fidelity loudspeakers and efforts were made to ensure that each one was in a similar stereophonic space. Equipment comprised a digital audio tape player with an amplifier and high fidelity loudspeakers. The images were shown on slides projected against a screen. Responses were written down by each participant on a pre-prepared template.
Sample
Survey participants were 112 citizens (50 females and 62 males) aged between 18 and 74 (average age 37). Valuations of images, sounds and combinations were carried out in the same order by all 112participants.
SITUATIONS IN SURVEY AREAS
Hangzhou, the capital of Zhejiang Province is the political, economic, cultural, science and education center of Zhejiang Province. As a sub-provincial city and central city on the southern wing of Yangtze Delta, Hangzhou is a national key tourist and historic city designated by the State Council. Composed of 8 districts, 3 county-level cities and 2 counties, it has a total area of 16,600 square kilometers and a total population of 6.52 million. The geographic position of the city proper is latitude 30°16' north and longitude 120°12' east.
The city of Hangzhou was founded about 2,200 years ago during the Qin Dynasty. As one of the Seven Ancient Capitals in China it has served as the capital of the Wuyue Kingdom in the period of Five Dynasties and the Southern Song Dynasty.
Hangzhou is well known for its beautiful West Lake. The West Lake has different charms in the sunny, cloudy, rainy and snowy days, surrounded by hills on three sides. The West Lake area, a coded national scenic resort that spreads as large as 60 sq kms to the west of the city, consists of 60 sites of scenic, historical as well as cultural interests, which attracts tens of millions of national and international tourists yearly. Some spots are notable for their beautiful images such as Autumn Moon on the Calm Lake, Solitary Hill, and some are for their characteristic sound such as Evening Bell Ringing at Nanping Hill, Orioles Singing in the Willows. In short, the attraction of westlake is come from the interaction of visual, acoustic, social, psychological factors etc.
In this survey, 13 spots surrounding West Lake are selected as objects. The image and sound elements in each spot were recorded with a Sony digital video and then were detected, showed in Table1. The image elements mainly contain trees, grass, lake, buildings, spring, temple, road, shops, hill, plaza, snack bars, herbal medicine shop, fish, and stream. The sound factors mainly include music, birds, insects, voice, wind, noise, bell, chanting, stream, higgler, drama, water and stream.
RESULTS AND DISCUSSION
Evaluation of Sounds and Landscape Images
Presented separately, sound and image sets received a similar average rating (Table 2): sounds were scored 3.34, and images were scored 3.39. The scoring range for each group of stimuli was also very similar. The maximum scores in the sound cases corresponded to the sound of the Solitary Hill and the Flowery Pond Park: 4.11 and 4.07. In the image cases Quyuan Park and the Oriole-Willow Park received the highest rating: 4.61 and 4.57. The minimum scores in the sound cases corresponded to the sound of the Bei Shan Road and the Wu Shan Square: 1.95 and 2.15. In the image cases the Jingci Temple and the Wu Shan Square received the highest rating: 1.67 and 1.96. An overall preference is evident for natural and rural rather than urban or street scenes. Sounds in which streams and bird songs predominate, like the Solitary Hill, attract a higher rating than the Wu Shan Square. This kind of sound environment comes within the general concept of cultural landscape, a frequent subject of the literature on landscape conservation (Stanners and Bourdeau, 1995).
Table 2 Mean Scores (in bold) and Standard Deviation Obtained by Different Sound-image Combinations
| No. | Spot | Combination | Sound | Image | Coherence | ||||
|---|---|---|---|---|---|---|---|---|---|
| Mean | S. D. | Mean | S. D. | Mean | S. D. | Mean | S. D. | ||
| 1 | Quyuan Park | 3.91 | 1.53 | 4.06 | 1.34 | 4.61 | 0.76 | 4.87 | 0.34 |
| 2 | Music Fountain | 2.71 | 1.35 | 3.41 | 1.56 | 4.02 | 1.19 | 4.88 | 0.33 |
| 3 | Jingci Temple | 2.18 | 1.26 | 3.99 | 1.40 | 1.67 | 0.84 | 3.91 | 0.34 |
| 4 | Bei Shan Road | 2.20 | 0.96 | 1.95 | 1.36 | 2.61 | 1.33 | 1.97 | 0.37 |
| 5 | Oriole-Willow Park | 3.63 | 1.34 | 3.95 | 0.79 | 4.51 | 0.55 | 4.89 | 0.31 |
| 6 | Yang Gong Bank | 3.90 | 1.11 | 3.44 | 1.55 | 3.99 | 1.44 | 3.96 | 0.33 |
| 7 | Wu Shan Square | 1.69 | 1.36 | 2.15 | 1.74 | 1.96 | 1.45 | 1.10 | 0.30 |
| 8 | He Fang Street | 1.67 | 1.32 | 2.54 | 1.55 | 2.03 | 1.43 | 3.96 | 0.27 |
| 9 | Hu Bin Road | 3.02 | 1.13 | 2.95 | 0.83 | 3.66 | 0.82 | 2.96 | 0.34 |
| 10 | Bai Bank | 2.63 | 1.28 | 2.94 | 0.80 | 4.04 | 1.16 | 1.93 | 0.35 |
| 11 | Solitary Hill | 3.05 | 1.16 | 4.11 | 0.85 | 3.71 | 0.53 | 3.94 | 0.31 |
| 12 | Flowery Pond Park | 3.48 | 1.13 | 4.07 | 1.39 | 4.30 | 0.79 | 4.91 | 0.29 |
| 13 | Yuquan Park | 2.57 | 1.75 | 3.83 | 1.71 | 2.97 | 1.48 | 4.88 | 0.33 |
Note: Average score and standard deviation of sounds heard in the absence of images and images seen in the absence of sounds. S.D. denotes standard deviation.
Variance analysis between spots shows p<0.01, the score differences of each spot are statistically significant, both for images and sounds taken separately and interacting (Table3). It indicated that the diversity of scenic spot was distinctive in the lakefront area.
Table 3 Variance Analysis on Scores of Sound, Image, Combinations, and Coherence
| Source | Sum of squares | df | Mean square | F | P |
|---|---|---|---|---|---|
| Com. | 792.025 | 12 | 66.002 | 39.387 | 0 |
| Sounds | 783.485 | 12 | 65.290 | 36.265 | 0 |
| Images | 1405.65 | 12 | 117.138 | 94.389 | 0 |
| Coh. | 2317.68 | 12 | 193.140 | 1836.69 | 0 |
As we can see from Table 2, the ranking of preferences regarding sound-image combinations is not the same as the order obtained for each stimulus individually. In general, coherent combinations of sound and image are more highly rated than the mean of each component stimulus. The congruence or coherence effect has already been reported in previous experiments (Carles et al., 1992) and may be related to the coherence variable found in studies on visual landscape (Kaplan et al., 1987).
Certain sounds consistently upgrade the rank of both urban and rural or natural images. This was the case in our experiment with the sounds of the stream and the bird songs. Natural sounds, particularly water, help to create positive feelings towards the landscape. The attraction of the water presence in landscapes has been interpreted as expressing the qualities of survival and fertility ascribed to this element (Schafer, 1977;).
Table 4 Correlations Between Combination, Sound, Image and Coherence
| Combination | Sound | Image | Coherence | ||
|---|---|---|---|---|---|
| Pearson Correlation | 1 | .659* | .881** | .556* | |
| Combin ation | Sig. 2-tailed | .014 | .000 | .048 | |
| N | 13 | 13 | 13 | 13 | |
| Pearson Correlation | .659* | 1 | .508 | .810** | |
| Sig. 2-tailed | .014 | .076 | .001 | ||
| Sound | N | 13 | 13 | 13 | 13 |
| Pearson Correlation | .881** | .508 | 1 | .455 | |
| Image | Sig. (2-tailed) | .000 | .076 | .118 | |
| N | 13 | 13 | 13 | 13 | |
| Pearson Correlation | .556* | .810** | .455 | 1 | |
| Coher | Sig. (2-tailed) | .048 | .001 | .118 | |
| ence | N | 13 | 13 | 13 | 13 |
** Correlation is significant at the 0.01 level.
The most highly rated combination was the sound and image of Quyuan Park (3.91), while the lowest score was accorded the combination of the image and sound of Hefang Street (1.67), which is a busy city road. These appraisals would seem to arise from the specific effect of the sound of water and the importance of sound-image congruence. The sound of the stream, in the meantime, usually increased the value assigned to images.
The upper results are strongly confirmed with the analysis of correlations between combination, sound, image and coherence. As we can see from Table 4, the correlation level between combination and image is the highest (0.881), at the same time, the comparatively high levels are presented concerning combination versus sound (0.659) and combination versus coherence (0.556). It suggested that the sound and the sound-image coherence were the influence factors of the evaluation to the image.
Principal Component Analysis of Image-sound Combinations
In order to track the complex mutual influences at work between sounds and images, we carried out correspondence analysis (Table 5). This procedure allows regular patterns or trends in subjects' responses to be picked out. Evaluation styles or trends are represented through a system of coordinates or dimensions which can be interpreted by the position of the variables or stimuli used in the survey.
The distribution in space of the combinations allows different groupings to be distinguished with regards to both relative distances (the proximity or distance of each combination from others) and their locations versus the axis midpoints.
Table 5 Total Variance Explained by PCA
| Rotation Sums of Squared Loadings | ||||||||
|---|---|---|---|---|---|---|---|---|
| Total | % of Var. | Cum. % | ||||||
| 32.404 | 28.932 | 28.932 | ||||||
| 28.408 25.364 | 54.296 | |||||||
| 19.235 | 17.174 | 71.470 | ||||||
| 13.786 | 12.309 | 83.780 | ||||||
| 7.957 | 7.104 | 90.884 | ||||||
| 7.733 | 6.905 | 97.788 | ||||||
Rotation Method: Varimax with Kaiser Normalization.
The first two dimensions of principal component analysis account for 54.296% from the total variance of the data matrix. According to the score on the first two principal components, the 13 spots are classed into four groups with cluster analysis, Figure 1 shows a projection of sound-image combinations of the 13 spots on the plane formed by these two dimensions.
In order to investigate the real meaning of the two dimensions, a correlation analysis is performed (Table 6), considering 13 objects (population, tree, water, bird etc) as variables and the first two principle components as subjects. The result shows that level and water are respectively the main influence factors on the first and the second principle component, with correlation coefficient of – 0.733 and 0.739. As we can deduce from table 6, the first dimension shows a gradient associated with sound characteristics in terms of their level. The positive end gathers combinations with higher sound level, while combinations with lower acoustic level are located at the negative extreme. The second dimension shows a gradient of scenes according to the water present. The positive pole corresponds to more water sound, while combinations with less water are located at the negative end.
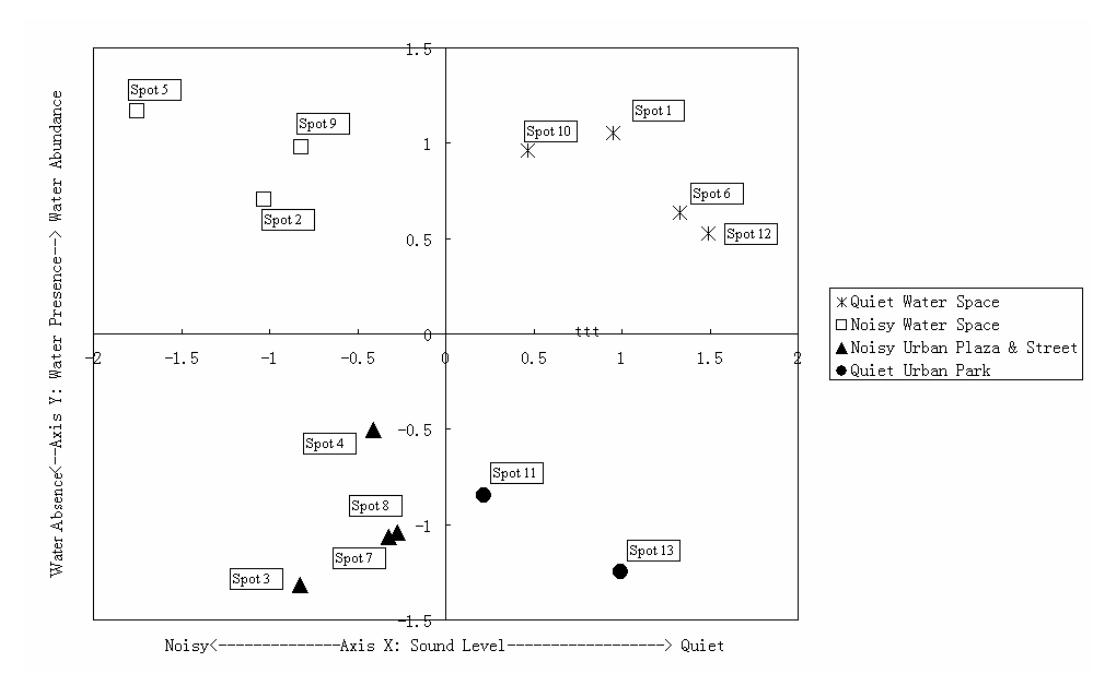
Figure 1 The Scatter Plot of the 13 Sound-image Combinations in Terms of PCA Scores
Table 6 Correlations between the Two Factors and the Eleven Attributes of Selected Areas
| Popu. | Tree | Water | Bird | Music | Noise | Sounder Song | Higgler | Coh. | Level | |||
|---|---|---|---|---|---|---|---|---|---|---|---|---|
| 1st | Pearson Cor. | 254 | .244 | .235 | .380 | 126 | 388 | 263 | 107 | 253 | .086 | 733* |
| factor The | Sig. 2-tailed | .403 | .422 | .440 | .200 | .683 | .190 | .386 | .728 | .403 | .779 | .004 |
| N | 13 | 13 | 13 | 13 | 13 | 13 | 13 | 13 | 13 | 13 | 13 | |
| 2nd | Pearson Cor. | .298 | .205 | .739* | .185 | .500 | 092 | 551 | 441 | 297 | .024 | 138 |
| factor The | Sig. 2-tailed | .323 | .502 | .004 | .545 | .082 | .765 | .051 | .131 | .324 | .938 | .653 |
| N | 13 | 13 | 13 | 13 | 13 | 13 | 13 | 13 | 13 | 13 | 13 |
Note: * Correlation is significant at the 0.01 level. Popu. denotes Population. Coh. denotes Coherence.
CONCLUSIONS
Components of Soundscape Preferences
The different analysis carried out in this research project allows us to verify the importance of the sound component in determining preference variations. Specifically, the correspondence analysis shows that when sounds are taken separately, they tend to receive more consistent ratings than images, whose position in the system of co-ordinates would be better explained in relation to the accompanying sound.
The results of Principle Component Analysis and Correlations Analysis point to two main sound functions in the landscape as regards to providing of information which complements visual data. One such function is related to the interpretation of the sounds identified (water, birdsong, voices, cars, etc.), the other is related to the physical structure of sound information.
Natural sounds are rated positively, and increase appreciation of natural and artificial settings. Many natural sounds (especially the sound of water) help to enhance both the images of natural environments and urban spaces by projecting onto them a meaning other than that derived from the image in isolation. The findings on natural soundscapes are consistent with those relating to the visual landscape. Likewise, it has been found that natural landscapes are particularly sensitive to the presence of man-made sounds.
The second facet of the information regarding a sound is more closely associated to its physical structure in terms of ability to produce alarm or alert. This kind of information may be related to the most primitive, instinctive aspects of auditory perception considers how the information is processed by the brain. Their function would be the rapid detection of environmental sound patterns, thus facilitating, for example, the recognition of signals of alarm or alert. A sound's alert-raising capacity is related to abrupt variations in the sound level of certain frequency bands.
Sound-image Congruence
The relationship between a sound's alert-raising capacity and the setting in which it appears has an important impact on its interpretation. An alarm sound in a setting to which it is alien means something different from the same sound ascribable to a certain visual element of the landscape. Our general interpretation would be that ratings can be significantly affected when the interaction between the sound and visual elements present is inappropriate. A change in sound-image compatibility conditions is enough to produce quite different aesthetic and affective reactions. Visual information and acoustic information, as such, can reinforce or interfere with each other.
The role of sound-image congruence in shaping environmental preferences, as found in this and previous experiments, may be interpreted with reference to the information content which the sound provides relative to the image. Sounds indicate components of the landscape not detectable by the eye, inducing appreciation or rejection according to the information content provided, the physical structure of the sound itself and the degree of concordance between both stimuli.
The related information content of images and sounds on two different planes opens up whole new horizons in landscape studies. It would be interesting, for example, to analyze the effect of soundimage congruence on certain variables classically used for the prediction of landscape preferences.
Consequences for Urban Landscape
Images modify the effects of sounds and also determine environmental quality. In our experiment, the scenes in which sounds are most highly rated are those containing vegetation or abundant water in a landscape city. These preferences are related to the expectations of quality, diversity, complexity, etc. which these environments give rise to. In certain places with a distinct environmental identity, any acoustic disturbance can lead to a rapid deterioration in quality. Natural sounds, meanwhile, may improve the quality of built-up environments to a certain extent. However, any incongruence between
sound and image in a landscape quite clearly diminishes the value assigned it, indicating the need to conserve singular soundscapes. This question comes to the fore in places which use and function imply the presence of natural sounds. Such cases call for the application of soundscape conservation measures in protected natural spaces, cultural landscapes, parks and green areas.
Future work
Our interest in this study has centred on the evaluation of a limited soundscape surrounding the West Lake with natural or natural-urbanized environments. This raises the question as to whether other kinds of soundscapes, either natural or urban, technological, social, etc. share the same properties. A fundamental step in this respect would be to develop research projects aimed at the analysis and study of soundscape preferences. It is essential to develop this method and compare it to others, in order to obtain a more exact idea of its viability. It is also important to enlarge the sample to other places to establish control over the preference impact of factors concerning Hangzhou City, in order to get the full-scale information of the city soundscape and protect the acoustic environment more effectively.