
INTRODUCTION
Tourism development has been one of the areas that are being focused by the Malaysian government to enhance the contribution of the tourism industry to the national economy. The underlying purpose of promoting tourism in Malaysia, particularly international tourism, is to maximise foreign exchange earnings. This could be easily understood when looking at the trend that since 1980s, tourism industry has been increasingly an important sector in terms of its contribution to employment, income and foreign exchange. It is sensible therefore, for the government to tap the potential of tourism as a significant source of foreign exchange to the economy by developing the tourism industry. Accordingly, the heart of tourism development policy and strategy in Malaysia is more focused on the expansion and development tourism "products" and attracting tourist to come to Malaysia. For instance, the Eight Malaysia Plan (2001-2005) stated that the tourism policy thrust in Malaysia is:
Address correspondence to A.H Roslan, Faculty of Economics, University Utara Malaysia, 06010 UUM Sintok, Kedah Darul Aman, Malaysia. E-mail: ahroslan@uum.edu.my
"…to achieve rapid tourism growth on a sustainable basis. Towards this end, a holistic and coordinated approach will be adopted to further boost the tourism industry. Greater efforts will be undertaken to provide a wider variety of quality tourism products to stimulate tourism demand both internationally and domestically. In addition, more effective promotional strategies in established and emerging markets will be carried out continuously to capture a larger share of the tourism market" (Malaysia, 2001, p. 433).
Eight strategies have been identified and will be vigorously pursued in the Eight Malaysia Plan (2001- 2005) to develop the tourism industry. These strategies are: emphasising sustainable tourism development; focusing on holistic and integrated approach to tourism development; projecting Malaysia as fascinating destination with year-round carnival atmosphere; engaging in customerfocused product development and promotions; enhancing human resource development; facilitating and increasing accessibility; ensuring comfort, safety and security of tourists; and, forging strategic alliances and enhancing international cooperation (Malaysia, 2001, p. 445). Indeed recently, the government is estimated to spend about RM43.2 million to undertake tourism projects in the state of Terengganu that covers development of new tourist attractions and infrastructural development in the state (Utusan Malaysia, 2004; The Star, 2004).
Thus, the question of poverty seems quite remote and in fact it has never been one of the main considerations in tourism policy and strategies of the country. Indeed, it could be safely said that the impact of tourism on the poor is more or less left to the "trickling down" effects rather than deliberate and careful planning to harness the impact of tourism on the poor. There are now emerging literatures suggesting that tourism development should be linked with poverty reduction (Ashley and Roe, 2002; Ashley, Boyd and Goodwin, 2001). Ashley and Roe (2002) for instance pointed out that there exist an enormous potential of making tourism to be effectively work for the poor since the tourism sector is generally labour intensive, inclusive of women and the informal sector, as well as could be based on natural and cultural assets of the poor. The failure to do so will be a miss of opportunities. Unfortunately, as being mentioned earlier, poverty reduction has never been the main agenda in tourism development in Malaysia. Moreover, discussions on the potential link between tourism and poverty, i.e. the "pro-poor tourism" idea, appear to be clearly neglected. Thus, there is a need for examining the poverty impacts of tourism and consequently getting the "pro-poor tourism" idea to the attention of policy makers. This paper attempts to add to an informed debate on this issue.
Here, we choose Langkawi Island, which is situated in the state of Kedah, Malaysia, as our case study. The island has been identified to be one of the major tourist attractions to Malaysia. On the 1st January 1987, Langkawi Island has been granted as a duty-free port to boost tourist to the island. Besides, as far as the state government of Kedah is concerned, tourism development has been made as one of the priority areas in Kedah Development Action Plan (KDAP) 1991-2000, as well as in Kedah Maju Action Plan (2001-2010). In both plans, Langkawi Island has been identified to become an anchor and to promote some of the tourist attractions on the mainland of the state of Kedah. Thus, a study on the poverty impact of tourism in Langkawi Island would not only be sensible, but would also be an interesting case study for exploring the poverty impacts of the tourism industry. The case of Langkawi Island would also be exciting since Langkawi Island has been proclaimed as one of the major tourist destinations to Malaysia. In fact, as one of the poorest state in Malaysia, it is timely for the Kedah state policy makers to seriously consider the "pro-poor tourism" idea and to incorporate the idea in tourism policy and strategy of the state. In this way, tourism development in the state could achieve two goals simultaneously, i.e. increasing the number of tourists to the state, and hence raising income, and at the same time reducing poverty via tourism.
This paper is organised as follows. Section I provides the introduction, i.e. the background of the study, while section II spells out the research questions as well as the objectives of the study. Section III describes the method of the study, while Section IV discusses the findings of the study. Section V concludes.
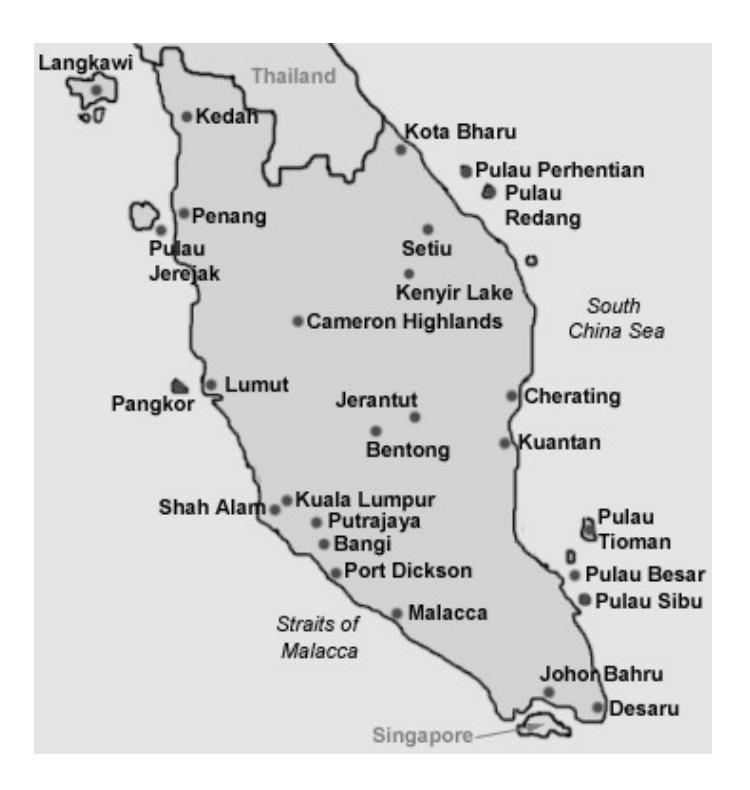
Figure 1 Map of Malaysia Peninsula Source: www.holidaycity.com/malaysiahotels
RESEARCH QUESTIONS AND OBJECTIVES
As Langkawi Island has become a major tourist attraction, there are few pertinent questions arise. Did the poor households in Langkawi Island participate in the tourism industry? How important are income from tourism sources in their total household income? What impact does income from tourism sources have on poverty? The importance of examining these questions, i.e. the effect of tourism industry on poverty cannot be over emphasized since in the final analysis, what matters to development is what happens to poverty (Seers, 1969).
The general objective of this paper is to analyse the extent to which poor households participate in the tourism industry and investigating the impact of income from tourism sources on the poor households in Langkawi Island. Two specific objectives of the paper are to estimate the magnitude of income from tourism sources in total income of the poor households, and to assess the impact of income from tourism industry on poverty amongst poor households.
METHOD
The question investigated in this study is whether the poor households participated in the tourism industry, and if they did, whether income from tourism formed one of the main sources of income to the poor household. Examining the importance of income from tourism sources in total household income of the poor however raises at least two main problems. One of the problems is to identify what kind of economic activities is considered to be tourism activities, and which one is not. In this regards, how are we going to differentiate income sources from tourism activities and income sources that are not from tourism activities? While the question seems simple, finding the answer appears difficult. The difficulty lies with the demarcation between tourism activities and non-tourism activities is not that clear. For instance, an individual who receive income from working at a hotel or resort in Langkawi Island could be considered as income from tourism activities, since most customers of the hotel or resort most likely to be tourist rather than locals. However, what about those who work in transportation industry such as ferry, buses and taxis or those working in restaurants? The answer could be yes and no, since it depends on whom their customers were. If most of their customers are tourist, then income received from that activities could be considered as income from tourism. However, if most of their customers were mainly locals then income received from that activities could not be considered as income from tourism. How then are we going to know whether their customers are tourist or not? Even though this is not impossible, getting the information would be a difficult exercise.
In this study, we solve this first problem by using a definition provided by the International Labour Organisation (ILO) Committee for the Hotel, Catering and Tourism Sector. We employ the ILO's definition since there is no formal categorisation of employment in tourism sector provided by the Malaysian tourism authority. The ILO Committee for the Hotel, Catering and Tourism Sector, defines tourism broadly, that covers these activities (ILO, 2001, p. 5): (i) Hotels, boarding houses, motels, tourist camps, holiday centers; (ii) Restaurants, bars, cafeterias, snack bars, pubs, night clubs, and other similar establishments; (iii) Establishments … for the provision of meals and refreshments within the framework of industrial and institutional catering (for hospitals, factory and office canteens, schools, aircraft, ships, etc.); (iv) Travel agencies and tourist guides, tourism information offices; and (v) Conference and exhibition centres. Following the ILO's categorisation of tourism related employment, in this study we define tourism employment as comprising the following: (i) Hotel, resorts, motels, chalet, inn, and rest house; (ii) Handicraft centre and integrated cultural exhibitions; (iii) Recreational centres; (iv) Theme park; (v) Gallery and museum; (v) Camping/camps; and (vi) Marina/Yacht. Thus, any individual working in one or more of the list would be regarded as working in the tourism industry, and hence, the income received from the profession would be regarded as income from tourism. While our approach could be the source of disagreement and debate, we believe that employing these definitions could serve well our purpose of investigation.
The second problem is with regards to identifying the poor. This is very important since we are interested in finding whether the poor did participate and benefit from the tourism activities. Normally, identifying the poor involves two steps (Sen 1997, p.165). The first is to identify who are the poor among the population, and the second is to gather the relevant data describing the poor to arrive at an aggregate poverty index of the population. The most common approach to identify the poor is by defining the income poverty line, i.e. the borderline of income that separates the poor from the nonpoor. Thus, those incomes falls below the poverty line are considered to be the poor. Here, we follow the poverty line income provided by the Economic Planning Unit of the Prime Minister's Department. The poverty line income is shown in Table 1.
Table 1 Peninsular Malaysia: Poverty Line Income, 2002, (RM/month)
| 1999 | 2002 | |
|---|---|---|
| Poverty Line Inco me | 510 | 529 |
Note: The poverty line income is the monthly household income where the average household size is 4.6 persons. Source: Malaysia (2001, 2003)
Once we get the income poverty line, the next step is to determine how much poverty exists with reference to it. While there are various measures of poverty suggested in the literature, in this paper we employ the head-count ratio to calculate poverty for the simple reason that it is more practical and convenient. The head-count ratio is calculated as H = m/N, where m is the number of poor households and N is the total sample of the study. While other measures might be better in terms of fulfilling the axioms of poverty index, i.e. criteria of a good poverty index, nonetheless the head-count ratio is easy to interpret and meaningful without much loss of information from the other indexes.
The required data for the study is extracted by questionnaires. A survey is carried out in 2002. There are a total of 210 poor households registered in Langkawi Island in 2002. The list of names and addresses of the poor households was taken from the records of the District Office of Langkawi Island and Kedah Economic Development Authority (KEDA). Hundred and twenty (120) or 57% of the poor households were selected randomly from the list of the poor households, where face-to-face interviews is carried out with the selected head of household to gather the required information.
FINDINGS
Profile of the respondents
There are a total of 120 poor household being interviewed in our study. Table 2 below shows the distribution of the respondents of the study by the area where they live in Langkawi Island. Almost half of the respondents (48.3%) are from Kuah, followed by about one-third (27.5%) from Tuba Island and about one-fifth (20.0%) from Ayer Hangat. There is only one (0.8%) respondent from Bohor and four (3.3%) from Kedawang. Kuah area represents the most populated area in Langkawi Island.
Table 2 Distribution of Respondent by Area
| AREA | FREQUENCY | PERCENTAGE |
|---|---|---|
| Kuah | 58 | 48.3 |
| Ayer Hangat | 24 | 20.0 |
| Bohor | 1 | 0.8 |
| Kedawang | 4 | 3.3 |
| Pulau Tuba | 33 | 27.5 |
| TOTAL | 120 | 100.0 |
Most of the respondents (69.2%) that we have interviewed are the head of households (Table 3). Nonetheless, when the head of household is not available for the interview, their wife or children is interviewed instead. About one third of our respondents (29.2%) are the wives of the head of households, while there are only two of the respondents (1.7%) who are the children of the head of households. The distribution of respondents by age and gender is shown in Table 4 and Table 5 below. About one third of the respondents are between 30 and 39 and between 40 and 49 years old, respectively. Thus, there are more than half (60.8%) of the respondents are between 30 to 49 years old.
In terms of gender, 90.2% of the head of households are male, while the remaining 9.8% are female. Majority (90.0%) of the head of households that we have interviewed are married, while 9.1% of them are widow or widower (Table 6).
Table 3 Status of Respondents
| STATUS OF RESPONDENT | FREQUENCY | PERCENTAGE |
|---|---|---|
| Head of Household | 83 | 69.2 |
| Wife | 35 | 29.2 |
| Children | 2 | 1.7 |
| TOTAL | 120 | 100.0 |
Table 4 Distribution of Respondents by Age
| AGE (YEARS OLD) | FREQUENCY | PERCENTAGE |
|---|---|---|
| Below 29 | 11 | 9.2 |
| 30 to 39 | 37 | 30.8 |
| 40 to 49 | 36 | 30.0 |
| 50 to 59 | 17 | 14.2 |
| 60 and Over | 19 | 15.8 |
| TOTAL | 120 | 100.0 |
Table 5 Distribution of Respondent by Gender
| GENDER | FREQUENCY | PERCENTAGE |
|---|---|---|
| Male | 109 | 90.8 |
| Female | 11 | 9.2 |
| TOTAL | 120 | 100.0 |
Table 6 Distribution of Respondent by Marital Status
| MARITAL STATUS | FREQUENCY | PERCENTAGE |
|---|---|---|
| Single | 1 | 0.8 |
| Married | 108 | 90.0 |
| Widow/Widower | 11 | 9.1 |
| TOTAL | 120 | 100.0 |
In terms of education, most of the head of household (45.83%) had their highest education at the high school level (Table 7). There are about an equal percentage (44.17%) that had primary education. Only two of them (1.67%) had education level at the higher learning institutions. About 8% of the respondents did not have formal education. With regards to household size, majority (71.7%) of the respondents have a medium size family, i.e. 3 to 5 members, while and about one-fifth (19.2%) of them have quite a large family size, i.e. 6 to 8 members (Table 8). Those with small household size, i.e. less than 3 members, constitute only about 5% of them.
Table 7 Distribution of Respondents (Head of Household) by Education Level
| LEVEL OF EDUCATION | FREQUENCY | PERCENTAGE |
|---|---|---|
| Informal Education | 10 | 8.33 |
| Primary Education | 53 | 44.17 |
| High School Education | 55 | 45.83 |
| Institution of Higher Learning | 2 | 1.67 |
| TOTAL | 120 | 100.00 |
Table 8 Distribution of Respondent by Household Size
| HOUSEHOLD SIZE | FREQUENCY | PERCENTAGE |
|---|---|---|
| Below 3 | 6 | 5.0 |
| 3 to 5 | 86 | 71.7 |
| 6 to 8 | 23 | 19.2 |
| 9 and Above | 5 | 4.2 |
| TOTAL | 120 | 100.0 |
Participation in tourism industry
Table 9 below shows that only nineteen (19) or 15.8% of the respondents (head of household) involve in the tourism activities, while the majority of them (84.2%) were in the non-tourism sectors. Within the non-tourism category, about one-fifth respectively is fishermen and private sector employee. There are about one tenth of the head of household who were unemployed.
Table 9 Type of Occupation of the Head of Household
| OCCUPATION CATEGORIES | FREQUENCY | PERCENTAGE |
|---|---|---|
| Tourism | 19 | 15.8 |
| Non-Tourism | 101 | 84.2 |
| Government Servant | 12 | 10.0 |
| Private Sector Employee | 23 | 19.2 |
| Entrepreneur/Business | 19 | 15.9 |
| Fishermen | 28 | 23.3 |
| Rubber Tapper/Farmer | 2 | 1.7 |
| Unemployed | 13 | 10.8 |
| Others | 4 | 3.3 |
| TOTAL | 120 | 100.0 |
Since we are interested in finding the extent of tourism income in total household income, besides the head of household, we also examine how many people are there in each household that involve in the tourism industry. Table 10 shows that, within the 120 households that we have surveyed, there are a total of 184 individuals who are working. Of these 184 individuals, we find that 41 individuals, i.e. 22.3 percent or about one-fifth, has a job in the tourism sector. While we haven't had any benchmark as the basis for comparison, and there is no serious deliberate attempt to get the poor involve in the tourism industry, we believe that this percentage is quite a high percentage. Since there is no serious deliberate attempt to encourage the poor involve in the tourism industry, we believe that this percentage is quite a high percentage. Indeed, at the national level, employment in tourism industry constituted only about 6.8% of total employment (World Travel and Tourism Council, 2002).
Table 10 Type of Occupation of Head of Household and Family Members
| Main Occupation Categories | Head of Household | Family Members | TOTAL | Percentage |
|---|---|---|---|---|
| Tourism | 19 | 22 | 41 | 22.3 |
| Non-Tourism | 87 | 55 | 143 | 77.7 |
| Government Servant | 12 | 10 | 22 | 12.0 |
| Private Sector | 23 | 25 | 48 | 26.1 |
| Entrepreneur/Business | 19 | 4 | 23 | 12.5 |
| Fishermen | 28 | 4 | 32 | 17.4 |
| Rubber Tapper/Farmer | 2 | 1 | 3 | 1.6 |
| Others | 4 | 11 | 15 | 8.1 |
| TOTAL | 107 | 77 | 184 | 100.0 |
Note: The number of head of household is 107 since those head of households who are unemployed as in Table 9 is omitted.
Next we examine the kind of tourism activities that the poor households involve in. Table 11 below shows that majority of them (48.8%) participated in hotel or resort industry. This followed by 21.9 percent in travel agencies (or tourist guides or tourist information offices), and 12.2% in transportation (land and sea transportation). There are only three (or 7.3%) participated in handcrafts related activities.
Table 11 Participation of Poor Households in Tourism Industry by Types of Tourism Activities
| TYPES OF TOURISM ACTIVITIES | FREQUENCY | PERCENT |
|---|---|---|
| Restaurant/Bar/Cafeteria/Snack Bar/Pub/Night Club | 1 | 2.44 |
| Travel Agencies/Tourist Guides/Tourism Info Offices | 9 | 21.95 |
| Handcraft – business/entrepreneur | 3 | 7.32 |
| Marina | 1 | 2.44 |
| Hotel/Resort | 20 | 48.78 |
| Land Transportation | 2 | 4.88 |
| Sea transportation | 5 | 12.20 |
| TOTAL | 41 | 100.00 |
With regards to the level of education, most of those participated in the tourism industry seems to be high school leavers (Table 12). We find that nearly three quarter (73.1%) of those participated in the tourism activities were those with high school education. In contrast, only about 15% were those with primary school education, and 7.3% with polytechnic or STPM level of education.
Another interesting question to be investigated is the extent of participation of women in the tourism industry. Table 13 shows the participation in tourism industry by gender and age. There are 17 or 42.9% of those involve in tourism related industry are female. It is also interesting to note that most of them are relatively young, i.e. aged less than 40 years old. Fifteen out of eighteen of them were less than forty years old. We find that most of the women involve in hotel or resort industry (Table 14). Indeed this is also true for their male counterpart.
Table 12 Education Level of Those Participated (Head of Household and Family Members) in Tourism Industry
| LEVEL OF EDUCATION | No. | % |
|---|---|---|
| No Formal Education | 0 | 0.0 |
| Informal Education | 1 | 2.4 |
| Primary Education | 6 | 14.6 |
| High School Education | 30 | 73.1 |
| College/Polytechnic/Matriculation/STPM | 3 | 7.3 |
| University | 0 | 0.0 |
| Others | 1 | 2.4 |
| TOTAL | 41 | 100.0 |
Table 13 Participation of Poor Households in Tourism Industry by Gender and Age
| AGE | MALE | FEMALE | TOTAL |
|---|---|---|---|
| Below 29 | 9 | 9 | 18 |
| 30-39 | 7 | 6 | 13 |
| 40-49 | 5 | 3 | 8 |
| 50-59 | 3 | 0 | 3 |
| Total | 24 | 17 | 41 |
| % | 57.1 | 42.9 | 100.0 |
Table 14 Participation of Poor Households in Tourism Industry by Gender and Types of Occupation
| TYPES OF TOURISM ACTIVITIES | MALE | FEMALE | TOTAL |
|---|---|---|---|
| Restaurant/Bar/Cafeteria/Snack Bar/Pub/Night Club | 1 | 0 | 1 |
| Travel Agencies/Tourist Guides/Tourism Info Offices | 7 | 2 | 9 |
| Handcraft – business/entrepreneur | 0 | 3 | 3 |
| Marina | 1 | 0 | 1 |
| Hotel/Resort | 10 | 10 | 20 |
| Land Transportation | 1 | 1 | 2 |
| Sea transportation | 4 | 1 | 5 |
| TOTAL | 24 | 17 | 41 |
Structure and distribution of household income
Table 15 below shows the structure of income of the poor household. Our study found that about one-quarter (25.32%) of total income of the poor household in Langkawi Island is contributed by the tourism sector, while the remaining three-quarter (74.68%) is contributed by the non-tourism sector. While the share of income from tourism sources in total income is far less than the share of nontourism sources, nonetheless in our opinion, the percentage is quite high when compared to the contribution of tourism in the national income. In 2006, the contribution of tourism in Malaysia's GDP is estimated at 10.8% (World Travel and Tourism Council, 2002).
Table 15 Structure of Income of the Poor Household
| SOURCES OF INCOME | |||
|---|---|---|---|
| Tourism | Non-Tourism | TOTAL | |
| Total (RM) | 32172.00 | 94877.00 | 127049.00 |
| Share in Total Household Income (%) | 25.32 | 74.68 | 100.00 |
Table 16 below shows the distribution of total household income by income sources. Majority of the poor households, i.e. 41% of them, receive total household income between RM501 and RM1000, while about one fifth (21%) of them receive total household income between RM1001 and RM1500 per month. There are also about one fifth (18%) of them who receive RM500 or less per month. It is interesting to note that there are also one fifth (20%) of the poor households who receive more than RM1500 per month. Indeed, there are 4% of poor households who receive more than RM3000 per month. On average, total household income received by the poor households is RM1059 per month (Table 17).
Table 16 Distribution of Total Household Income (RM/Month)
| Income range (RM/Month) | No. | % |
|---|---|---|
| 500 or less | 22 | 18.3 |
| 501 - 1000 | 49 | 40.8 |
| 1001 - 1500 | 25 | 20.8 |
| 1501 - 2000 | 12 | 10.0 |
| 2001 - 2500 | 4 | 3.3 |
| 2501 - 3000 | 3 | 2.5 |
| More than 3000 | 5 | 4.2 |
| N | 120 | 100.0 |
Table 17 Descriptive Statistics of Total Household Income (RM/Month)
| Mean | 1058.7 |
|---|---|
| Minimum | 5500 |
| Maximum | 130 |
| Std. Deviation | 825.7 |
| N | 120 |
As far as income from the tourism sources is concerned, majority of them (44%) receive household income between RM501 and RM1000 per month, while about one-third (34%) of them receive RM500 or less per month (Table 18). There are nearly one tenth of them (9.8%) who receives household income of RM1501 to RM2000 per month. The average income received by those participated in the tourism industry is RM785 per month with the maximum value RM1800 and the minimum value RM120 (Table 19).
Table 18 Distribution of Income by Received from Tourism Sources (RM/Month)
| Income range | No. | % |
|---|---|---|
| 500 or less | 14 | 34.1 |
| 501 - 1000 | 18 | 43.9 |
| 1001 - 1500 | 5 | 12.2 |
| 1501 - 2000 | 4 | 9.8 |
| 2001 - 2500 | 0 | 0.0 |
| 2501 - 3000 | 0 | 0.0 |
| More than 3000 | 0 | 0.0 |
| N | 41 | 100.0 |
Table 19 Descriptive Statistics of Income by Received from Tourism Sources (RM/Month)
| Mean | 784.7 |
|---|---|
| Minimum | 1800 |
| Maximum | 120 |
| Std. Deviation | 441.2 |
| N | 41 |
Impact of tourism activities on poverty
Table 20 shows the calculated poverty incidence, i.e. the head-count index of poverty, by income sources. It shows that the calculated poverty incidence when income from tourism is excluded, i.e. income from non-tourism only, is found to be 41.67%. We then calculate poverty incidence when income is received from all sources, including income from tourism industry. The poverty incidence is found to be 22.50%. Thus there is a reduction in poverty incidence, i.e. by almost 20.0%, when income from tourism is taken into account. What this finding implies is that, with the participation of the poor in tourism activities, poverty incidence has dropped quite significantly. In other words, if there is no opportunity for the poor to participate in tourism related activities, then the poverty incidence among the poor households would be almost doubled (41.67%). Thus, it appears that tourism industry, i.e. income from tourism sources do help very much in reducing poverty.
Since we find that some of our respondents are no longer poor even though they are still listed in the list of poor household by the Langkawi District Office and KEDA, it might be interesting to find how many of those participated in the tourism activities no longer categorised as poor. We found that, of the 41 individuals that participated in tourism activities, more than half of them, i.e. 25, were no longer poor and while the remaining 16 are still poor (Table 21). Thus, we suppose that the reduction in poverty incidence when income from tourism is taken into account in total income of the poor as shown in Table 20 is due to this 25 individuals.
Table 20 Poverty Incidence by Income Sources
| SOURCES OF INCOME | POVERTY INCIDENCE (Head-Count Ratio) |
|---|---|
| Income from Tourism only | 79.17% |
| Income from Non-Tourism only | 41.67% |
| Income from All Sources (TOTAL INCOME = Tourism + Non-Tourism) | 22.50% |
Table 21 Number of Those Participated in the Tourism Industry by Household Income Level
| INCOM E CATEGORY | NUM BER |
|---|---|
| Total household income above the | |
| Poverty Line Income (Non-Poor) | 25 |
| Total household income below the | |
| Poverty Line Income (Poor) | 16 |
| TOTAL | 41 |
CONCLUSION
The results from our study show that, even without significant deliberate action from the government to encourage the poor to be involved in the tourism industry, the poor does participate in tourism activities in Langkawi. Indeed, even though they have a relatively low level of education, it did not hinder them from participating in the tourism industry. Probably these poor households are concentrated mainly in the low paid jobs, as demonstrated by our finding that majority (44%) of them actually receive household income between RM501 and RM1000 per month from the tourism sources.
Another interesting point is that income from tourism is found to constitute about 25% of total household income of the poor. Despite there are any deliberate attempt to encourage the poor to participate in the tourism industry, income from tourism formed one quarter of their total household income of the poor. Thus, we expect the impact of tourism sector on the poor and reducing poverty would be more significant if there is a deliberate policy and strategy aimed at getting the poor to involve in tourism. Our study shows poverty would be reduced more significantly if the poor could participate in the tourism industry. Thus, to successfully reduce poverty, policy makers and development agencies need to look at the possibility of making tourism works for the poor. In other words, what might be needed is a pro-poor tourism policy.