
INTRODUCTION
Ecotourism is a form of tourism that occurs in destinations along with attractions of flora, fauna, cultural heritage and environment friendly activities (Eagles & Wind, 1997; Stephen & Dowling, 2002; Fennell, 2002). It can bring responsible programs to minimize negative impacts on environment, maximize economic support for local communities and contributes integrity on cultural heritage of nations (Ryngnga, 2008). The right use of local resources into environmentally sensitive patterns of tourism industry (Yonglong, 1996) and local community"s participation in tourism development process (Tosun & Jenkins, 1996) are important to make sustainable tourism strategy. Sustainability ecotourism is depends upon the preservation of environmental quality (Eagles & Wind
1Address correspondence to Balt Suvdantsetseg: Postal address: S207, Delta Building, SFC, Keio University, Endoh, Fujisawa, Kanagawa, 252-0882 Japan, Email address: suvdaa@sfc.keio.ac.jp
1997; Chourasia & Agarwal, 2011) and the participation of stakeholders to achieve desired outcomes (Wassen et.al 2011) of environment conservation and financial benefits (Ross and Wall, 1999). Decision-making in tourism development and planning is an increasingly complex issue as how to achieve more sustainable forms of tourism development, how to assess resource potential, and how to involve communities in planning process are ongoing challenges (Ryngnga, 2008; Freya, 2009).
This paper identified and assessed the existed resource potential for ecotourism development in Biger, Gobi-Altai province, in western Mongolia using participatory geospatial approach and weighting evaluation analysis. The main attraction is a natural sand sauna health resort for visitors that it is one of Mongolia"s tourism icons. In recent years, with the increasing popularity and publicity of natural travel, the number of visitors has been rapidly increasing. However, financial benefits are insufficient due to the lack of visitor growth resulting in local economy and also it is leading cause of environmental around sanatorium. Under these circumstances, in order to balance the economic benefits and use of the resources, the local government has a plan to develop an ecotourism industry based on the natural and recreational resources of the region (Gobi Altai province master plan, 2007).
In contrast, the challenge of ecotourism development planning lies in the complexity of the issue at the local level. Because of the lack of insufficient spatial and non-spatial information available on the region"s resources, involvements of communities are very new and the creation of ecotourism policy for a region is usually the responsibility of regional governments.
The strength of tourism planning can be enhanced by GIS and Remote sensing applications because of its huge capabilities for the spatial tourism data infrastructure collecting, storing, managing, analyzing, updating and mapping tourism resources along with its attribute datasets in the various geographical areas (Banerjee, et.al 2002; Boyd et.al, 1994; Beedasy & Whyatt, 1999; Eslami & Roshani, 2009; Dye & Shaw, 2007). The integration of databases through GIS technology would help to decision-making process to facilitate the development and strategic marketing of the tourism industry and development of integrated studies but also distribution of online information sharing system for visitors to increase tourist"s number in developing world.
In looking to develop tourism industry, the participatory approach is more compatible with the rural context (Murphy, 1985; Tosun, 2005). To overcome the challenges, a participatory approach can help to improve data collection or integration, map tourist spots or resources and examine areas suitability for proposed development using their needs (Tosun & Jenkins, 1996). Moreover, their helps needed to implementing opportunity and achieving outcomes of new action in their important living environment.
LITERATURE REVIEW
Tourism resources and destination attractions are supply elements which refer to the critical attributes of a destination and base of sustainable tourism (Cocklin, et.al, 1990; Tsaur et.al, 2006; Asami et.al 2009; McClinchey & Carmichael, 2010). Valuation of natural resources is also necessary to promote conservation management and to provide support from public, government, and non-government organizations (Lee & Mjelde, 2007) as well as local communities (Ross & Wall, 1999).
1. Remote sensing and Geographic information system
Tourism spatial planning through remote sensing and GIS analysis has been performed in various places. One of the earliest applications of GIS had discussed by Boyd et.al 1994 in Northern Ontario of Canada. This study was determined the best locations using GIS analysis and matching the characteristics of an area with their attributes. They were developed some criteria (naturalness, wildlife, cultural heritage, access, landscape and community) to assess suitable ecotourism sites. Another example Banerjee.et.al, 2002 presented the remote sensing and GIS techniques to evaluate the areas potentials for the Ecotourism planning in the forest dominated area of eastern India. They used weighted approach based on separate indicators of higher vegetation index, high soil productivity, and high forest density. Eslami & Roshani, 2009 were determined the tourists decentralize and centralization in the 3 different zones using layers overlay and query techniques of GIS based on its natural resources of slope, aspect, accessing road and other attractions. The tourism studies using GIS technologies are primarily presented have suggested that GIS can be having great potential to use in tourism planning and development. However, no study was presented using Participatory Geo-spatial Approach for quick data collection, its managing, and mapping as well as analyzing the ecotourism resources.
2. Landscape evaluation analysis
A common method for tourism resource assessment is a demand approach through conducting visitor surveys and expert knowledge combined with tourists and operators opinions (Ferrario, 1979). Dowling 1993 used tourists and resident"s opinion, and expert knowledge to evaluate ecotourism attractions in the Gascoyne Region of Western Australia. Various methods from the supply side of tourism resource assessment existed such as resource classification, scenic quality assessment, and landscape evaluation techniques including expert knowledge, visual preferences, field check, and analysis of aerial photos (Litton, 1968). The use of photographs for landscape evaluation has been widely used since for scenic beauty estimation (Lynch & Gimblett, 1992). Cocklin, et.al, (1990) demonstrated a method for recreation and tourism resources assessment in New Zealand combining both scenic quality assessment and activity based assessments. The method employed classification of resources based on landscape types and land cover elements using aerial photography, topographic maps and field checks. In order to determine scenic quality they used a numerical index from low to high quality. Ross & Wall (1999) has stated the site evaluation framework to assess the status of tourism and their relationships between natural resources, tourism and local people in North Sulawesi, Indonesia. Priskin, 2001 developed a resource evaluation technique for nature-based tourism resources assessment in Central coast region of Western Australia. The framework simply employed a use of qualitative resources classification, and quantitative weighting systems.
METHOD
1. Study area description
Biger city is situated in Gobi-Altai province in the south west of Mongolia; it is a remote area removed from economic and population centres. There are 5 villages (Bag in Mongolian) namely Bag1, Bag2, Bag3, Bag4, and Bag5 governed by this city. Biger region covers an area of 3730 square kilometres, sheltering 2249 inhabitants (male 1143, female 1106), 635 stakeholders, and 91700 numbers of livestock. The altitudinal range is between 1300 and 3750m above sea level. Summer annual average air temperature is about 250C, sand surface temperature is 45-600C, annual precipitation is 72.6mm, and sunshine is 3103 hours/year.
Biger town is an important communication network centre because of the meeting point for accessing road from other southern towns to centre of Gobi-Altai city. 24% percent of the population is living in the town centre where residents work in the offices whilst most of the residents are involved in the pastoral herding industry in neighbouring centres and in remote areas, providing the main local employment and livelihoods for local economy.
There has never been a professional tourism industry and only the "Tavan Els" health resort offers services to treat visitors with a natural sand bathing treatment during the summer period. A number of provincial Parks and one National Nature Reserve that are the great ecological and historical significance have been established. It is currently made up of poor, undeveloped urban settlements. The physical and political attributes of the Biger landscape make the area a prime candidate for ecotourism development. Ecotourism opportunity approved not only by the local communities" congress, but also ensured by local stakeholders and visitors following questionnaires and interviews undertaken in 2009. 71 percent of participants supported an ecotourism development programme.
2. Process of the evaluation framework
The main point of this study is to make a methodological framework for the ecotourism resources assessment using Participatory Geospatial Approach (PGA) and Weighting evaluation analysis. The research framework consists of three steps: 1) participatory inventory & data collection, 2) participatory mapping & geospatial analysis, and 3) weighting assessment, which are detailed as below.
a) Participatory inventory and Data base creation
This step is inventoried the local resources for the ecotourism development that included data collection to create a local tourism database. This research is essentially the first about tourism study in the study area, because detailed information cannot be obtained from previous studies and reports. Therefore, the first Research Expedition of our members involved collecting information by using necessary instruments of self-administrated questionnaires, face-to-face interviews, and participatory observation as well as checklist form and ground truth measurements in the core area. This survey was undertaken from July to August 2008 through 2011. A resource inventory was initiated through interviews with local government authorities, tourism development operators, and local herders who know an area very well in the region. Here, we used
locals potential participation and their valuable knowledge to identify various parameters of tourist demand, basic infrastructure fasicilities, site description, environmental quality, local community possession, land uses, tourist spots and their location, economic activities, historical and cultural heritages and their observation possibility so on. On several occasions field surveys were undertaken in the potential natural and recreational resource sites where registered spatial information of each sites by using a hand-held GPS and PDA, and also recorded the site information"s by using checklist form for quick data collection.
b) Participatory mapping and geospatial analysis
After data collection, all information"s organized into GIS database storage in ArcGIS9.3 software as part of building a tourism geo-database. These comprehensive databases including remote sensing images, GIS layers, and base topographic maps allowed to mapping several types of resource maps in the study site using visualizing tools of GIS technique (Lynch & Gimblett, 1990) that verified by revalidation. Moreover, during the field observation, local people mapped the local resources on our base map. Additionally, we randomly chose the herder families to map resources near to their land that included archaeological and historical sites, water sources, nature trails, open areas, cultural event grounds, camping and pasture areas etc.
In order to assess the tourism resources classification is one of manners to understand natural environment and recreational goods for purpose of tourism development (Nengwang, et.al, 2009; Cocklin, et.al, 1990). Several scholars have demonstrated tourism resources classification as such natural and cultural attractions (Fennell, 2002; Eraqi, 2007; Boers & Cottrell, 2007), supporting infrastructure, public goods or services, transportation facilities (Boyd, et.al, 1994; Corneliu & Mihai, 2010), trained staffs and marketing (Ryngnga, 2008), participation of local community, and environmental quality and degradation (Yonglong, 1996; Priskin, 2001).
According to our specific field survey at the case area, ecotourism resources were classified into five categories as attraction diversity, accessibility, supporting facilities, communities" participation and environmental degradation. Each of these categories has been broken down into sub-categories for a comprehensive understanding of tourism resources importance based on the locality that shows in the table1. Additional information of all features was entered into attribute information or metadata of spatial data to more effectively support the analysis. For example, an attribute of biodiversity attractions was added to the wild animal"s class to specifying indicators such as birds, mammals, and reptiles and also recorded their observation level in the each of location.
c) Weighting evaluation analysis
In previous step, we categorized resources into five classes and each of them also categorized by indicators (Manuel & Fred, 1998; Michael, 2008). In order to allow a systematic analysis for potentials of resources, spatial overlaying (Ryngnga, 2008) and matrix weighting systems (Cocklin, 1990; Priskin, 2001; Tsaur, et.al, 2006) were developed into classified resources. Here, the each of the resource sites received different scores relevant to the indicators to illustrate the importance of them. The scoring system cited all classified indicators into a GIS which was beyond the scope of this study to use spatial analysis for resources assessment. For example, each of attraction indicators receives a score value from 0-10 and then total score a site could be got 60 (Table1). The attractions evaluated by the category of low diversity that had one single attractor with lowest total scores 20, category medium had 2 attractors with total 40 scores and category high had 3 or more than attractors with over 41 total scores are in each of resources sites.
Accessibility evaluation used 2 indicators as road speed type and vehicles types. Each of these indicators was assigned values ranging from 0 to 5, so the total score was 0-10 (Priskin, 2001). Through if resource site accessed by animals or foot with lower than 5km/h speed that will take lowest total scores of 0-4 categorized in poor accessibility, sites accessed by four wheel drive (4WD) or motorbike with 15km/h speed that will take total scores of 5-8 categorised in moderate, and area can accessed by all types of automobiles with over 25km/h speed that will take high total scores 9-10 categorized in good accessibility.
Community"s participation is locally recognized to initiate by two categories, which are participation in management planning process (Vinodan & Manalel, 2011), and participation in interpretation services (guide, cooking, driving, hand crafts, and local festival) to achieve existing outputs. Each of these indicators was assigned values ranging from 0 to 10, so the total score was 20 in each of the five villages. Additionally, they have established 5 Ecotourism Development Community (EDC) groups from local stakeholders that supported by local government. These groups members are openly participate in tourism development management planning section through to encourage, control, assess and implement actions of programme at the project area. The first indicator mostly conducted by the EDC group members and evaluation group members (Suvdantsetseg et.al, 2010). The second indicator has conducted with all local communities who are staying in this area.
Supporting facilities of tourist sites are one of the important tourism resources (Caroline, 2001; Eraqi, 2007). In this research the following seven indicators were used to inventory supporting facilities: Toilet facilities, picnic facilities, rubbish bin, campgrounds, hotels, guest houses, and shopping centres. To assess their importance, we used two values 0 and 1, if a site has present item take 1, and it is absent take 0 values, then total scores are 0-7 in each of the sites. Through if sites get total score of 0-2 no facility, 3-5 poor facility and over 6 are basic facility categories.
In looking to develop tourism industry, we should consider its environmental impacts (Peter, 2006; Kumari, et.al, 2010) during planning process. In this study area, the most considerable environmental indicators are wild life habitat changes, impact on animal behaviour, loss of landscape resource, impact on water quality, erosion of nomadic pasture, increases of solid waste, increases of noise level, destruction of sand dunes, erosion of landforms, and erosion on infrastructure. Each of the 10 indicators were assigned a value from 0 to 10, hence each resource site could receive a maximum score of 100 for this category (Cocklin, et.al, 1990; Priskin, 2003; Stephen & Dowling, 2002; Kenan, 2006). Sites with lowest 20 total scores indicate that site have low environmental or human impact and increases an total scores over 41-100 impact attitude well be increases through that sites leading conservation and control management through tourism operators and monitoring groups.
Table1. Resources classification and scoring system
| Resources Category | ||||
|---|---|---|---|---|
| 1.Attractions | Sub-categories | Each indicators score | Total score | |
| 1. | Naturalness (beauty scenes with diversity | of | ||
| flora and fauna, hunting, | waterfalls, and | |||
| wilderness areas) | ||||
| 2. | Cultural diversity (cultural show, local | |||
| festivals, & religious events) | ||||
| 3. | Geological features (geological minerals, | |||
| fossils, caves and rock) | ||||
| 4. | Historical diversity (temples, rock paintings, | 0-10 | 0-60 | |
| archaeological site, museum) | ||||
| 5. | Special or scientific interests (Sandy beach, | |||
| salt collects, lakes, reserved area, agro | ||||
| fields) | ||||
| 6. | Traditional lifestyle (traditional horse and | |||
| camel back trail riding, hostelling, nomadic | ||||
| lifestyle, hiking, animal husbandry) | ||||
| 2. Accessibility | ||||
| 1. | Road type | 0-5 | 0-10 | |
| 2. | Vehicles type | |||
| 3.Communities participation | ||||
| 1. | Participation in management planning | |||
| process (EDC members, and evaluation | ||||
| group members) | ||||
| 2. | Participation in interpretation services (local | 0-10 | 0-20 | |
| residents, tour operators, and local | ||||
| administrators) | ||||
| 4. Supporting facilities | ||||
| 1. | Toilet facilities (including showers, | |||
| washing) | ||||
| 2. | Picnic | facilities (tables with seats for eating | ||
| or park benches, | place available for | |||
| barbeque) | ||||
| 3. | Rubbish bin (trash box for all types of waste | |||
| disposal) | ||||
| 4. | Campgrounds | (shading shelters, available | 0;1 | 0-7 |
| for tenth) | ||||
| 5. | Hotels (comfortable to accommodation) | |||
| 6. | Guest house ( to do hostelling or visiting) | |||
| 7. | Shopping centre | |||
| 5. Environment degradation | ||||
| 1. | Impact on wildlife habitat | |||
| 2. | Impact on animals behaviour | |||
| 3. | Loss of endangered species | |||
| 4. | Impact on water quality | |||
| 5. | Erosion on nomadic pasture | 0-10 | 0-100 | |
| 6. | Impacts on solid waste | |||
| 7. | Increase of noise level | |||
| 8. | Destruction of sand dunes | |||
| 9. | Erosion on landforms | |||
| Erosion on infrastructure |
RESULTS AND DISCUSSION
In many respects, Biger city appears to have many of the attributes established except some of supporting facilities for the successful development of ecotourism. We investigated 27 potential resource sites in the five villages across Biger city from the evaluation analysis. Results were presented in a series of maps that showed the spatial distribution of resources such as diversity of attractions, types of accessibility, capacity of supporting facilities, participation of local communities, and level of environmental degradations and various of tables stated the quantity and quality of resource characters.
1. Attraction diversity
Spatial distributions of attraction sets are variable in the project area that shows in figure 1. This distribution map presented the main observable points in each of attraction diversity around destinations, which verified by participatory observation. 30% of sites were classified into the "high" attraction diversity, 44% of sites medium and 26% of sites low attraction diversity of categories (Table2). The main attractions for proposed destinations are fashioned by the traditional lifestyle (30%), cultural diversity (25%), naturalness (15%), special or scientific interests (15%), historical diversity (11%), and geological features (4%). The nomadic cultural landscape of this region consists of four main elements of steppes, herds, horses and Gers that are now marketed as attractions of ecotourists in neighbouring parts of Asia and Worldwide (Backley, et.al, 2008). Annual local cultural festivals and religious events are providing tradition and culture heritage during the dry season and important in maintaining social cohesion in the local area. More over local special interesting areas such as medical sand dunes, local agro fields, rock painting; archaeological findings and geological source of landforms are more interesting for the scientific tourists.
2. Potentials of accessibility
The most of highly attractive places, 18 sites had good accessibility where all types of automobiles could go to over 25km/h speed (figure 2). There are only 5 sites had moderate access and 4 sites had poor accessibility, which are required to access by 4WD drivers and animals or food (see table3). However those sites are near from main roads, which may be interesting for hiking and horse back trailers. In general, the project area has not existed sealed roads, because behind of locality issue such as traditional nomadic settlements and also short period of tourism industry, this area cannot develop an accessing infrastructure through urban road.
3. Community's participation
Human resources and their participations are included in one of criteria that it is newly cited in this study. It has a permanent population of 2250 (male 1144, female 1106), 635 householders, and 1530 labours. Actually from recent sanatorium activity, most local people in the area cannot get benefit and ecotourism may clear this problem. Table 4 illustrates the residents" views with regard to the suggested tourism development initiatives. 3 of villages have high activity of participation for both management planning process and implementation of industry. 2 of them have low activity of participation. These two villages have low diversity of attractions and poor accessibility to the destinations and also residents have difficulty to participate in this industry. Impression of local people is welcoming and 71% of them supported an ecotourism development programme.
4. Supporting facilities
Almost 60% of all sites had some poor facilities, 30% had no facilities and 10% of sites have basic facilities as shown in table 5. The presence of supporting facilities of sites is variously different such as campgrounds (81%), hotels (11%), guesthouses (70%), shopping centres (11%), picnic facilities (55%), rubbish bin (85%), and toilet facilities (15%). The most considerable facilities are picnic facilities that should comfortable for visitors to take rest or make short break, rubbish bin in nature reserves and points of water sources that responsible for environment pollution by waste disposal, and campgrounds that could be available for unplanned accommodations. Poorly developed those facilities are clearly inadequate for the visitors" needs, and lack of tourism marketing for future promotion.
5. Level of environmental degradation
In many parts of the world, tourism is a seasonal activity that is also occurs in this area seasonally only in summer period. For this condition, ecotourism may affect the environment for part of year. 63% of sites have no impact and 37% of sites have moderately low impacts shown in table 6. Currently, there is none of the sites fell into the category of over moderate levels of environmental problems. If specify the impacts by each of indicators, impacts on water quality, waste disposal, noises, some how destruction on grazing pasture, and landform erosions are the most considerable impacts. Erosion of landforms is also recognised in the unique and reserved areas such as sand dunes of Tavan Els area is already experiencing problems of over use and no conservation systems. Presence of waste disposal systems and staffs from local community are required to install in nature reserves and most popular sites at least in most crowded period. Through application of PGA, decision managers can identify points of overcrowding, destructions, improvements and conflicts in spatial pattern and non-spatial situations using created database for future directions.
Finally, table7 shows the general conclusion of resource sites in the region that have medium value of attraction diversity, moderate level of accessibility, high activity of community"s participation, poor capacity of supporting facilities and low level of environmental impacts. The potential of resources are variously different in each of villages. A village 1 has high, village 2, 3 and 5 are basic, and village 4 has poor potentials.
Balt Suvdantsetseg & Hiromichi Fukui & Moriyuki Oe
Table 2. Attraction evaluation
| Attraction | Value | Nu | Total | % of | ||||
|---|---|---|---|---|---|---|---|---|
| diversity | Bag1 | Bag2 | area | |||||
| Low | 0-20 | 2 | 1 | 1 | 1 | 2 | 7 | 26 |
| Medium | 21-40 | 3 | 2 | 3 | 2 | 2 | 12 | 44 |
| High | 41-60 | 3 | 2 | 2 | 1 | 8 | 30 | |
| Total | 8 | 5 | 6 | 3 | 5 | 27 | 100 |
Table 3. Accessibility assessment
| Access | Value | Nur | Total | % of | |||||
|---|---|---|---|---|---|---|---|---|---|
| class | Vehicle type Speed | Bag | Bag | Bag | Bag | Bag | area | ||
| type | 1 | 2 | 3 | 4 | 5 | ||||
| Poor | Animals | 5 km/h | 2 | 0 | 1 | 1 | 0 | 4 | 15 |
| Moderate | 4WD, | ||||||||
| motorbike | 15 km/h | 0 | 0 | 1 | 1 | 3 | 5 | 18 | |
| Good | Automobiles | 25 km/h | 6 | 5 | 2 | 1 | 3 | 18 | 67 |
| Total | 8 | 5 | 6 | 3 | 5 | 27 | 100 | ||
Table 4. Participation of local communities in tourism development strategy
| Participation class | Values | Particip | ation type | Total | % of |
|---|---|---|---|---|---|
| Service | Planning | area | |||
| Low participation | 0-6 | 3, 4 | 3, 4 | 4 | 40 |
| Medium | 7-13 | 2 | 2, 5 | ||
| participation | 3 | 30 | |||
| High participation | 14-20 | 1, 5 | 1 | 3 | 30 |
Table 5. Potentials of supporting facilities
| Tuest evil etentials of supporting furnities | |||||||||
|---|---|---|---|---|---|---|---|---|---|
| Facilities class | Value | Nu | Total | % of | |||||
| Bag1 | Bag2 | area | |||||||
| No facilities | 0-2 | 2 | 1 | 4 | 0 | 1 | 8 | 31 | |
| Poor facilities | 3-5 | 6 | 2 | 2 | 3 | 3 | 16 | 59 | |
| Basic facilities | 6-7 | 0 | 2 | 0 | 0 | 1 | 3 | 10 | |
| Total | 8 | 5 | 6 | 3 | 5 | 27 | 100 | ||
Table 6. Levels of environment degradation
| Impact class | Value | N | Total | % of | ||||
|---|---|---|---|---|---|---|---|---|
| Bag1 | Bag2 | Bag3 | Bag4 | Bag5 | area | |||
| No impact | 0-20 | 4 | 5 | 4 | 2 | 2 | 17 | 63 |
| Moderately low | 21-40 | 4 | 2 | 1 | 3 | 10 | 37 | |
| Moderate | 41-60 | |||||||
| Moderately high | 61-80 | |||||||
| High | 81-100 | |||||||
| Total | 8 | 5 | 6 | 3 | 5 | 27 | 100 |
Table 7. Final evaluation
| Resources Number of sites | |||||||||
| class | Bag1 | Bag2 | Bag3 | Bag4 | Bag5 | Final | |||
| Attractions | High | Medium | Medium | Medium | Medium | Medium | |||
| Accessibility | Good | Good | Poor | Moderate | Moderate | Moderate | |||
| Community's | High | Medium | Low | Low | High | High | |||
| participation | |||||||||
| Supporting | |||||||||
| facilities | Poor | Basic | Poor | Poor | Basic | Poor | |||
| Environment | |||||||||
| degradation | Low | No impact | No impact | No impact | Low | Low | |||
| Final | High | Basic | Basic | Low | Basic | ||||
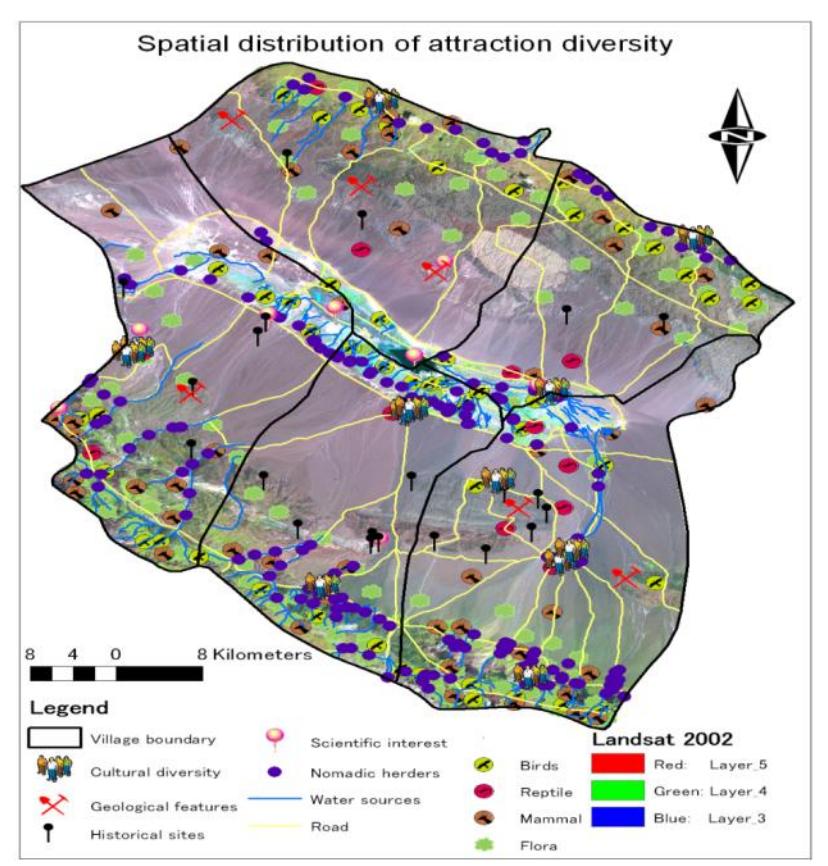
Figure 1. Diversity of attractions and its spatial pattern cross study area
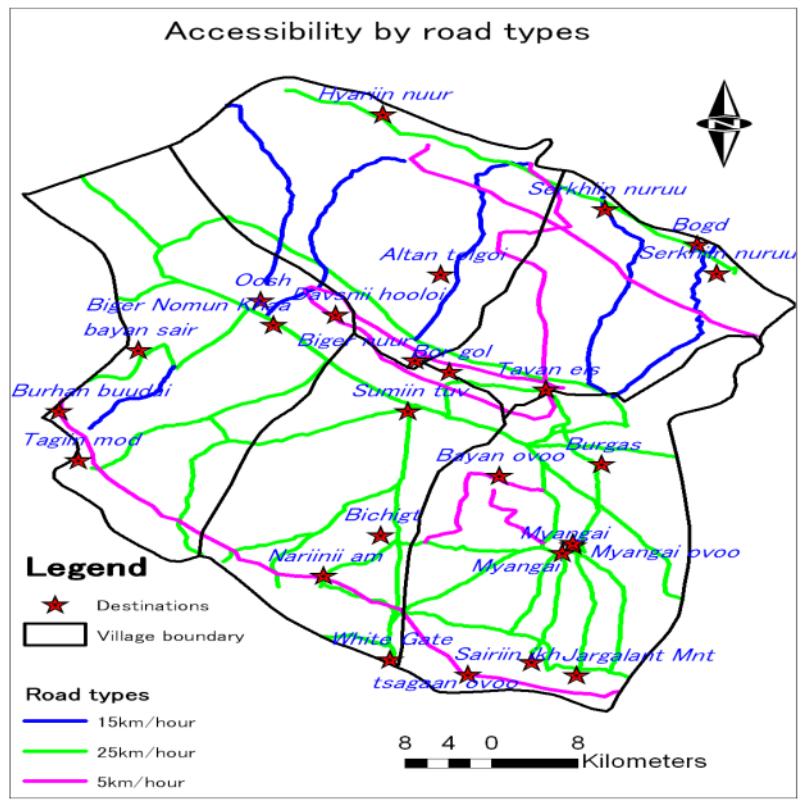
Figure 2. Accessibility types to the destinations in Biger city, Mongolia
CONCLUSION
This study presented a development approach of Participatory Geo-spatial Approach (PGA) to collect datasets and examine the potential of existing resources for the ecotourism development planning in Biger city of Gobi-Altai province, Mongolia. It is suitable planning technique to investigate resources, establish local tourism geospatial databases, explore conflicts, and examine impacts of tour activity as well as evaluate resources" potentials whilst considering the rural community"s participation. However, during the research process, it is necessary to carefully check local differences and the potential for implementation to better understand the constraints and challenges of the participants. In planning most attention focused on the needs of visitors that are providing attraction, interests, comfortable and good conditions as well as responds to local culture, livelihoods, social economy and environmental conservation through ecotourism development.
Having many of those resources, Biger region has identified 27 potential spot sites in the five villages. As seen from table7 resource sites in the region have medium value of attraction diversity, moderate level of accessibility, high activity of community"s participation, poor capacity of supporting facilities and low level of environmental impacts. Therefore there are several key challenges to its implementation such as more accommodations, an improvement in infrastructure, more trained human resources and lodging facilities are needed.
Finally, the research findings illustrate the local tourism geo-database yielded by alternative methods and also demonstrate their utility to local and regional planning managers to recognize areas with tourism development potential and given to the contributions that this type of planning system can offer policy makers concerned with contentious tourism-related planning and management decisions.