
D.S. PRIYARSONO
Department of Economic, Bogor Agricultural University
ADI LUMAKSONO1
BPS - Statistics Indonesia
The contribution of Japanese tourists to the total number of foreign tourists visiting Indonesia has always been very significant. Tourism authorities as well as tourism related enterprises therefore are normally interested in finding the factors affecting Japanese demand for tourism in Indonesia. This study attempts to analyze factors that influence Japanese demand for tourism in Indonesia by utlizing an econometric modeling. The model that results from this analysis is then used to forecast the number of Japanese tourists visiting Indonesia in 2011- 2015. The most significant factor that affected the Japanese demand for tourism in Indonesia was Japan's GDP.
Inbound Tourist, Tourist Expenditure, Econometrics
INTRODUCTION
To a national economy, revenue from inbound tourism (foreign tourists' expenditure) can be categorized as revenue from export of service. In Indonesia the share of inbound tourism in the total value of export of service is consistently increasing; in 2006, 2007, and 2008, the percentages are 46.67, 46.91, and 52.84, respectively. In the same years, the ranks of tourism in the list export of commodities also show positive trend, i.e., 6, 5, and 4. (See Table 1).
1 Address correspondence to Adi Lumaksono : Badan Pusat Statistik - Indonesia
Table 1. Values of Export Commodities 2006-2008
| 2006 | 2007 | 2008 | |||||
|---|---|---|---|---|---|---|---|
| Rank | Kind of Commodity | Value (million US$) | Kind of Commodity | Value (million US$) | Kind of Commodity | Value (million US$) | |
| (1) | (2) | (3) | (4) | (5) | (6) | (7) | |
| 1 | Oil and gas | 21 209.50 | Oil and gas | 22 088.60 | Oil and gas | 29 126.30 | |
| 2 | Garments | 5 608.16 | Palm oil | 7 868.64 | Palm oil | 12 375.57 | |
| 3 | Rubber | 5 465.14 | Rubber 6 179.88 | Rubber | 7 579.66 | ||
| 4 | Palm oil | 4 817.64 | Garments | 5 712.87 | Tourism | 7 377.00 | |
| 5 | Electrical Apparatus | 4 448.74 | Tourism | rism 5 345.98 | 6 092.06 | ||
| 6 | Tourism | 4 447.97 | Electrical Apparatus | 4 835.87 | Electrical Apparatus | 5 253.74 | |
| 7 | Textile | 3 908.76 | Textile | 4 177.97 | Textile | 4 127.97 | |
| 8 | Processed Wood | 3 324.97 | Chemicals | 3 402.58 | Paper and paper goods | 3 796.91 | |
| 9 | Paper and paper goods | 2 859.22 | Paper and paper goods | 3 374.84 | Processed Food | 2 997.17 | |
| 10 | Chemicals | 2 697.38 | Processed Wood | 3 076.88 | Processed Wood | 2 821.34 | |
| 11 | Processed Food | 1 965.56 | Processed Food | 2 264.00 | Chemicals | 2 754.30 | |
| Export of goods | 101 081 | Export of goods | 123 229 | Export of goods | 147 703 | ||
| Export of services | 9 530 | Export of services | 11 397 | Export of services | 13 962 | ||
| Export of goods and services | 110 611 | Export of goods and services | 134 626 | Export of goods and services | 161 664 | ||
| • | Share of tourism on export of services (%) | 46.67 | Share of tourism on export of services (%) | 46.91 | Share of tourism on export of services (%) | 52.84 | |
| Share of tourism on export of goods and services (%) | 4.02 | Share of tourism on export of goods and services (%) | 3.97 | Share of tourism on export of goods and services (%) | 4.56 | ||
Source: Processed from Economic Indicators 2009, BPS
In the year of 2010 the number of inbound tourists visiting Indonesia exceeded seven million people (See Figure 1). Their expenditure during their visit in Indonesia reached US$ 7.6 billion, increased by 20.63% from that of 2009. This was due to the increase in the average of tourist expenditure and not the increase of the number of inbound tourists.
Figure 1. The Number Tourists' Visits to Indonesia 2006-2010
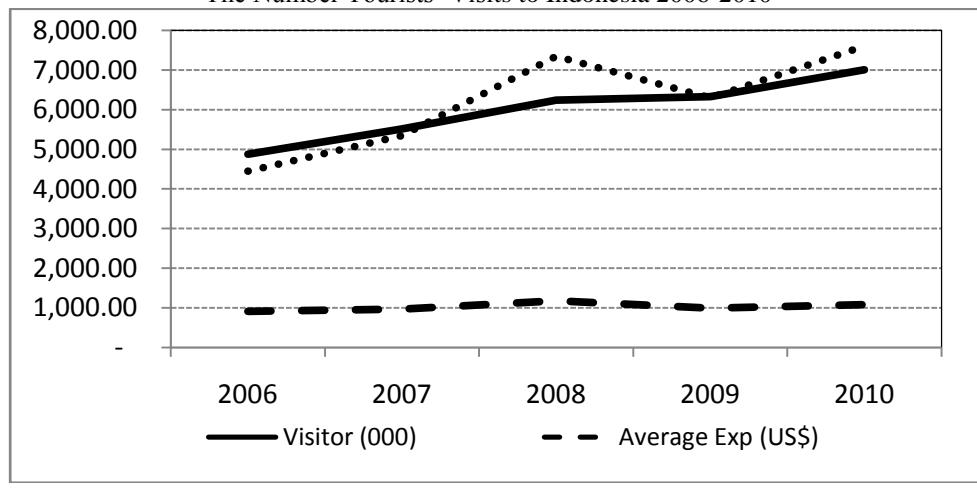
Source: Processed from International Visitor Arrival Statistics 2010, BPS
The contribution of Japanese tourists was the third biggest number of inbound tourists as well as to the total value of inbound tourists' expenditure (See Figure 2). It is therefore important to pay more attention to this particular market segment in order to maintain its contribution and moreover to increase it.
Share of Japanese Tourists in the Total Number of Inbound Tourists and Their Expenditures in Indonesia 2006-2010
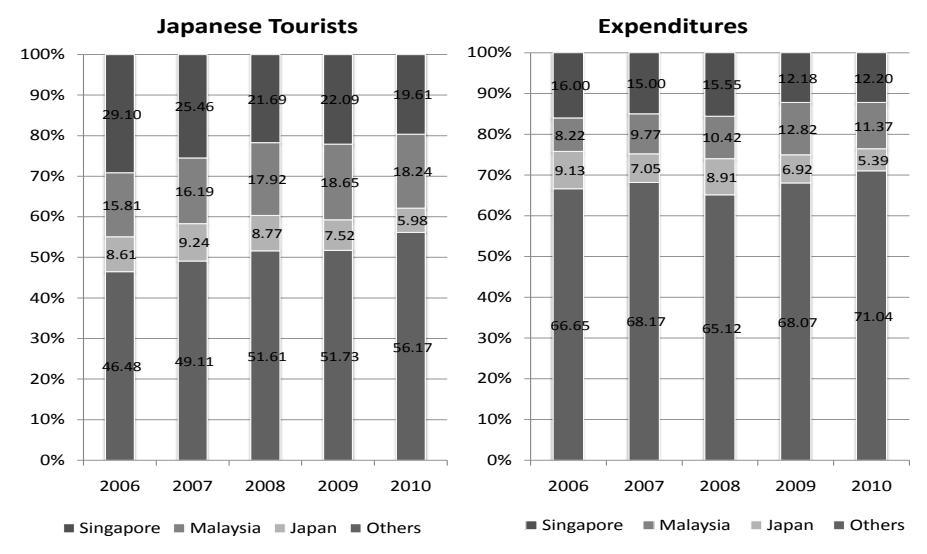
Source: Processed from International Visitor Arrival Statistics 2010, BPS
From the public as well as private policy maker's point of view, there is always a need to optimally allocate the limited sources to the available public investment options. Ministry of Culture and Tourism, and executives of tourism enterprises, for example, need to allocate their limited budgets to promote inbound tourism; and hence the questions, among others, are "to which market segments?" and "by how much?" To answer these and the related questions, it is important to identify factors influencing inbound tourism and to provide a quantitative tool to forecast the number of inbound tourists from a specific country.
This study attempts to analyze factors that influence the Japanese demand for tourism by utilizing econometric modeling. By using this model the numbers of Japanese inbound tourists are forecasted for the next several years. The results of this study are beneficial not only for public policy makers such as tourism authorities and public works investment planners, but also for tourism related business players like those of the transportation, logistics, hospitality, and leisure sectors.
LITERATURE SURVEY
Most of study on demand of tourism used a single equation where the number of tourist visiting a country is the fuction of income, tourism price, exchange rate between origin and destination country, transport cost, and dummy variables which affect tourist to travel. Models which are usually used are log linear models where the estimated coefficient of independent variables represent elasticity (Garin-Munoz et.al, 2000, Choyakh, 2008, Poenca and Elias, 2005, Aslam et.al, 2009) or linear models where the estimated coefficient of independent variables represent constant marginal effect (Stabler et.al. 2010). In constructing model, some researchers used panel data to avoid multicolliniarity and to increase degrees of freedom (Choyakh, 2008).
Although the models which have been constructed theoritically correct, statistically significant, and econometrically correct with the appropriate sample in those period used but it cannot be used to forecast since structural change among the variables used in the models running fastly (Koutsoyianis, 1978). Based on microeconomic theory that the demand of tourism was difined as a basket of goods and services where consumers (tourists) willing and able to purchase. In this case, demand of tourism is a function of tourists' income, price of goods and services of tourism, price substitution of goods and services of tourism, as well as qualitatitive variables such as economic crisis and gulf war by using dummy variables (Choyakh, 2008).
Witt, et.al (1995) in Mavri (2009) stated that much of demands on tourism used econometric approach. Other quantitave technics which also seldom be used are gravity models and time series models. Based on those models imply that it is imposible to construct the model only using a single equation for all countries both origin and destination countries of tourists. Particular variable can affects a country but not for other countries, and the estimated coefficients vary among countries. So, in this paper will develop model demand of Japanese tourism in Indonesia by using simultaneous equations to investigate interrelation among variables which affect the arrivals of Japanese tourists in Indonesia.
THE MODEL
The model consists of twelve structural equations and four identities. The number of endogenous variables is sixteen, where as that of exogenous variables is eleven. Formulation of the equations is as follows.
\[TA_{t} = a_{0} + a_{1}Y_{t} + a_{2}P_{t} + a_{3}PP_{t} + a_{4}LTA_{t} + a_{5}D1 + \mu_{1t}\] \[P_{t} = \frac{CPIINA_{t}}{CPI_{t} \times ER_{t}}\] \[PP_{t} = \sum_{i=1}^{3} \alpha_{i} \times \frac{CPI_{it}}{CPI_{t} \times IER_{it}}\] \[\alpha_{i} = \frac{TA_{it}}{TA_{\bullet t}}\] \[C_{t} = b_{0} + b_{1}Y_{t} + b_{2}LC_{t} + \mu_{2t}\] \[I_{t} = c_{0} + c_{1}Y_{t} + c_{2}U_{t} + \mu_{3t}\] \[G_{t} = d_{0} + d_{1}Y_{t} + d_{2}LG_{t} + \mu_{4t}\] \[X_{t} = e_{0} + e_{1}Y_{t} + e_{2}LX_{t} + \mu_{5t}\] \[M_{t} = f_{0} + f_{1}Y_{t} + f_{2}LM_{t} + \mu_{6t}\] \[POP_{t} = g_{1}LPOP_{t} + \mu_{7t}\] \[TE_{t} = h_{0} + h_{1}YC_{t} + h_{2}P_{t} + h_{3}LTE_{t} + h_{4}D2 + \mu_{8t}\] \[(10)\] \[YC_{t} = \frac{Y_{t}}{POP_{t}}\]
| CPI i t 0 | i R i MS 9 1 t 2 t t (12) | |||||
|---|---|---|---|---|---|---|
| ER j t 0 | j Y j CPI 10 1 t 2 t t (13) | |||||
| R k k t 0 | MS 11 1 t t (14) | |||||
| MS l | l LMS | |||||
| t 0 | 12 1 t t (15) | |||||
| FET TA t t | TE t (16) | |||||
| where TAt | =Number of Japanese inbound tourists (visit) | |||||
| LTAt | = Lagged number of inbound tourists (visit) | |||||
| Yt | = Gross Domestic Product (million US$, constant price of 2000) | |||||
| LYt | = Lagged Gross Domestic Product (million US$, constant price of 2000) | |||||
| Pt | = Proxy of tourism price service in Indonesia (US$) | |||||
| PPt | = Proxy of tourism price service in competitor countries (Singapore, | |||||
| Malaysia, and Thailand) viewed by Japanese tourists (US$) | ||||||
| TAit | = Number of Japanese tourists visiting i; i =1 Singapore, i=2 Malaysia, and i=3 Thailand (visit) | |||||
| TAt | = Total number of Japanese tourists visiting Singapore, Malaysia, or Thailand (visit) | |||||
| CPIINAt | = Indonesian consumers price index (percent) | |||||
| CPIt | = Consumers price index (percent) | |||||
| CPIjt | = Consumers price index in the country of destination j | |||||
| CPIi | = Consumers price index in the country of origin i | |||||
| IERij | = Index of Japanese Yen exchange rate (Sin$/JPY, Mal Ringgit/JPY, Thai | |||||
| Bath/JPY) with value for the index equals 1 in the year of 2000 | ||||||
| Ct | = Household consumption (Million US$) | |||||
| LCt | = Lagged household consumption (Million US$) | |||||
| It | = Investment (Million US$) | |||||
| LIt | = Lagged investment (Million US$) | |||||
| Gt | = Government expenditure (Million US$) | |||||
| LGt | = Lagged government expenditure (Million US$) | |||||
| Rt | = Bank interest rate (percent/year) | |||||
| Xt | = Export (Million US$) | |||||
| LXt | = Lagged export (Million US$) | |||||
| ERt | = Exchange rate (IDR/US$) | |||||
| Mt | = Import (Million US$) | |||||
| LMt | = Lagged import (Million US$) | |||||
| POPt | = Population size (thousand persons) | |||||
| LPOPt | = Lagged population size (thousand persons) | |||||
| YCt | = Per capita income (US$) | |||||
| MSt | = Supply of money (Million US$) | |||||
| LMSt | = Lagged supply of money (Million US$) | |||||
| FETt = Revenue from inbound tourists (Million US$) | ||||||
| D1 | = Dummy variable for travel warning, D1=0 No travel warning, D1=1 travel warning | |||||
| D2 | = Dummy variable for economic crisis, D2=0 before the crisis, D2=1 | |||||
| during the crisis | ||||||
| t | = Error term | |||||
Assumption of the Model:
- 1. Zero mean value of µt E (µt) = 0, for each t
- 2. No serial correlation Cov (µt, µv) = 0, t ≠ v
- 3. Homoscedasticity Var (µt) = σ2
- 4. Zero covariance between µt and each independent variable.
- 5. No specification bias, the model is correctly specified.
- 6. No collinearity between independent variable
EVALUATION OF THE MODEL
The result of the model's parameters estimation is presented in Table 2. The positive or negative signs parameters' estimates are generally consistent with the economic theories. Several of the estimates, however, do not indicate statistically significant effect of the independent variables on the respective dependent variables.
The coefficients of determination (R2 ) of the twelve structural equations range from 0.35 to 1.00. The lowest R2 belongs to the equation of Japanese tourists' average expenditure, where as the highest belongs to that of Japan's population. The F-statistics in the equations in the model generally indicate that the overall independent variables are satisfactorily capable of explaining the variation of the respective dependent variables. They range from 2.59 to 13,682.70 which are sufficiently, and in most cases highly, significant. The following paragraphs describe some equations and variables in the model that imply interesting interpretations.
Table 2 Estimation of the Parameters in the Equation of Revenue From Japanese Tourists Expenditures 1984-2008
| Variable | 140111 Japanese Tourists Exper | Parameter | Prob |T| | Significance |
|---|---|---|---|---|
| Estimate | ||||
| TA | Japanese Tourist Visits | |||
| Intercept | -131178 | 0.5324 | ||
| Japan's Gross Domestic Product (Y) | 71.51254 | 0.0121 | A | |
| Indonesia's Tourism Price (P) | -48413.4 | 0.6574 | ||
| Competitors' Tourism Price (PP) | 99644.69 | 0.7076 | ||
| Lagged TA [LTA] | 0.582791 | 0.0015 | A | |
| Dummy (D1) | -133256 | 0.0434 | A | |
| · · · · · · · · · · · · · · · · · · · | t=26.14 | |||
| C | Japan's Consumption | |||
| Intercept | -94.93650 | 0.0377 | A | |
| Japan's Gross Domestic Product (Y) | 0.531469 | <.0001 | A | |
| Lagged C [LC] | 0.091551 | 0.0575 | В | |
| · · · · · · · · · · · · · · · · · · · | =1663.99 | |||
| I | Japan's Investment | |||
| Intercept | 190.3540 | 0.0226 | A | |
| Japan's Gross Domestic Product (Y) | 0.080682 | 0.0176 | A | |
| Lagged I [LI] | 0.533156 | 0.0002 | A | |
| \(R^2=0.86\); F-State | =67.12 | |||
| G | Japan's Government Expenditure | |||
| Intercept | -81.69150 | 0.0530 | В | |
| Japan's Gross Domestic Product (Y) | 0.104901 | <.0001 | A | |
| Lagged G [LG] | 0.494486 | <.0001 | A | |
| \(R^2=0.96\); F-Stat= | 276.41 | |||
| X | Japan's Export | |||
| Intercept | -308.4900 | 0.2513 | ||
| Japan's Gross Domestic Product (Y) | 0.058536 | 0.1843 | ||
| Japan's Exchange Rate (ER) | 1.171682 | 0.2900 | ||
| Lagged X [LX] | 0.899390 | <.0001 | A | |
| \(R^2=0.95\); F-Stat= | 140.50 | |||
| M | Japan's Import | |||
| Intercept | -33.68470 | 0.4810 | ||
| Japan's Gross Domestic Product (Y) | 0.031997 | 0.0756 | В | |
| Lagged M [LM] | 0.798802 | <.0001 | A | |
| \(R^2=0.91\); F-Stat= |
A = significant at (\(\alpha\)=5%). B = significant at (\(\alpha\)=10%)
The most important equation in the model is Japanese tourists visits (i.e., where the dependent variable is the number of Japanese tourists' visits to Indonesia). It describes that the number of Japanese tourists visits to Indonesia significantly depends on Japan's GDP. Other significant variables are lagged number of Japanese tourists visits and the dummy variable of "travel warning". On the other hand, it is evident that price variables (price of Indonesian tourism service and price of tourism service in competing countries) do not significantly effect the number of Japanese tourists visits to Indonesia.
An interpretation of the above result may be that the push factor of the number of Japanese tourist visits to Indonesia is stronger than the corresponding pull factor. On the
D. S. Priyarsono & Adi Lumaksono
one hand, Japan's GDP that may represent Japanese tourists' purchasing power positively influences the number of Japanese tourists' visits to Indonesia. On the other, the model reveals that Japanese tourists are not price sensitive.
Table 2 (Continued) Estimation of the Parameters in the Equation of Revenue From Japanese Tourists Expenditures 1984-2008
| Variable | Prom Japanese Tourists Expend | Parameter | Prob | Significance | |||
|---|---|---|---|---|---|---|---|
| Estimate | |T| | C | |||||
| POP | Japan's Population | ||||||
| Lagged POP [LPOP] | 1.002484 | <.0001 | A | ||||
| \(R^2=1.00\); F-Hit=10 | 00000 | ||||||
| TE | Japanese Tourists Expenditure | ||||||
| Intercept | 637.0313 | 0.2751 | |||||
| Japan's Per Capita Gross Domestic | |||||||
| Product (YC) | 1.107249 | 0.9139 | |||||
| Indonesia's Tourism Price (P) | -95.76440 | 0.5638 | |||||
| Lagged TE [LTE] | 0.549856 | 0.0105 | A | ||||
| Dummy (D2) | -95.92710 | 0.7588 | |||||
| \(R^2=0.35\); F-Hit= | 2.59 | ||||||
| CPI | Japan's Consumer Price Index | ||||||
| Intercept | 96.42004 | <.0001 | A | ||||
| Japan's Interest Rate (R) | -1.850400 | 0.0473 | A | ||||
| Japan's Money Supply (MS) | 0.000897 | 0.2616 | |||||
| \(R^2\)=0.45; F-Hit=8.65 | |||||||
| ER | Japan's Exchange Rate | ||||||
| Intercept | 204.0354 | 0.024 | A | ||||
| Japan's Per Capita Gross Domestic | |||||||
| Product (YC) | -3.801070 | <.0001 | A | ||||
| Japan's Consumer Price Index (CPI) | 0.436656 | 0.6856 | |||||
| R2=0.82; F-Hit=48.88 | |||||||
| R | Japan's Interest Rate | ||||||
| Intercept | 0.223036 | 0.5922 | |||||
| Japan's Money Supply (MS) | -0.000050 | 0.6848 | |||||
| Lagged R [LR] | 0.828223 | <.0001 | A | ||||
| \(R^2\)=0.82; F-Hit=49.02 | |||||||
| MS | Japan's Money Supply | ||||||
| Intercept | 115.9370 | 0.2794 | |||||
| Lagged MS [LMS] | 1.035957 | <.0001 | A | ||||
| R2=0.96; F-Hit=549.56 | |||||||
A = significant at (\(\alpha\)=5%). B = significant at (\(\alpha\)=10%)
The fact that the dummy variable of "travel warning" significantly effects the dependent variable is self-explainable. The dummy variable has a value of zero when there is no notice of "travel warning" stated by the Government (Indonesian or Japanese), indicating that there is no security problem in the tourist destinations. Otherwise, it is given the value of one, meaning that there is strong indication of security problem.
The variable of lagged number of Japanese tourists visits to Indonesia significantly effects the dependent variable. This fact only reveals that there is, on average, consistent trend of the dependent variable. This last note, however, is not fully supported by the data represented by Figure 1 that shows some fluctuations.
Another important equation is Japanese Tourists' Expenditure. This dependent variable is significantly affected by its lagged variable. This only reveals that there is a consistent trend in the time series data of the dependent variable. The other independent variables in the equation are not statistically significant. They are Japan's GDP, price of Indonesian tourism service, and the dummy variable of "economic crisis".
It is interesting to note that while Japan's GDP does significantly affect the number Japanese tourists' visits, it does not significantly affect the tourists' expenditure. Furthermore, the dependent variable is not significantly affected by the dummy variable of "economic crisis". It sounds reasonable because Japanese economy was not influenced by the crisis as hard as what was experienced by other parts of the world including Indonesia.
THE FORECASTING
This study attempts to forecast the Japanese demand for tourism in Indonesia in 2011- 2015. The number of tourists' visit can be used as a proxy of demand for tourism. Accordingly, the above discussed model can be used as the tool for the forecasting.
Table 3. FORECASTS OF THE NUMBER OF VISITS OF JAPANESE TOURISTS TO INDONESIA AND THEIR EXPENDITURE 2011 – 2015
| Baseline | Forecasted Value | |||||
|---|---|---|---|---|---|---|
| Variable | (2008) | 2011 | 2012 | 2013 | 2014 | 2015 |
| Economic Growth (%) | -1.20 | 1.50 | 2.04 | 1.88 | 1.75 | 1.68 |
| Projected Population (Million) | 127.69 | 127.19 | 126.99 | 126.75 | 126.47 | 126.16 |
| Exchange Rate (JPY/US$) | 103.36 | 84.21 | 82.77 | 81.27 | 79.92 | 78.92 |
| Exchange Rate | ||||||
| IDR/JPY | 93.66 | 108.07 | 112.76 | 117.02 | 121.10 | 124.98 |
| SGD/JPY | 0.0137 | 0.0163 | 0.0168 | 0.0174 | 0.0180 | 0.0185 |
| MYR/JPY | 0.0322 | 0.0404 | 0.0411 | 0.0418 | 0.0425 | 0.0431 |
| THB/JPY | 0.3223 | 0.3777 | 0.3832 | 0.3867 | 0.3896 | 0.3918 |
| Consumer Price Index (CPI) (Base Year : 2000) | ||||||
| Indonesia | 205.29 | 242.81 | 255.82 | 267.85 | 278.88 | 289.24 |
| Japan | 99.51 | 96.86 | 97.05 | 97.53 | 98.31 | 99.27 |
| Singapore | 113.51 | 120.20 | 122.68 | 125.21 | 127.84 | 130.40 |
| Malaysia | 121.52 | 127.56 | 130.49 | 133.75 | 137.10 | 140.53 |
| Thailand | 126.28 | 132.58 | 135.94 | 138.65 | 141.47 | 144.23 |
| Japanese Tourists (Visit) | 546 713 | 798 490 | 864 628 | 924 442 | 980 285 | 1 032 747 |
| Average Expenditure (US$) | 1 196.94 | 1 179.72 | 1 179.34 | 1 181.25 | 1 184.84 | 1 189.38 |
| Total Expenditure (Million US$) | 654.38 | 941.99 | 1 019.69 | 1 092.00 | 1 161.48 | 1 228.33 |
The exogenized variables are Japan's economic growth, Japanese Yen (JPY) exchange rate, and Japan's polulation size. The values of these variables are taken from the data
published by the World Economic Outlook (International Monetary Fund, 2010). The forecasted variables are the number of Japanese tourists visits to Indonesia and their expenditures (both the average and the total). The results are presented in Table 3.
CONCLUSION
The result of this study suggests that during the period of the time series data (1984-2008) the most significant factor that affected the Japanese demand for tourism in Indonesia was Japan's GDP. On the other hand, the effects of price variables (tourism service prices in Indonesia, and in competing countries like Singapore, Malaysia, and Thailand) are not significant which mean that Japanese tourists are not price sensitive. Therefore, it can be concluded that the push factor is stronger than the pull factor. It suggests that during the period tourism in Indonesia failed to make the pull factor to be effective to attract inbound tourists. Accordingly, in the future the strategy space that is avalable for tourism related sectors in Indonesia to maneuvre is widely open.
This study also exemplifies how an econometric model can be utilized for forecasting tool. The model gives the forecast of number of Japanese tourists visits to Indonesia for 2011- 2015. The forecasted values should be viewed as pessimistic because during the period of the time series data (1984-2008) the push factor affecting the inbound tourists' visits was stronger than the pull factor (i.e., efforts by tourism authorities and enterprises to attract inbound tourists visits).