
INTRODUCTION
The modern tourism industry is now firmly established as a vital economic endeavor for both developed and developing countries. It acts a key driver for socio-economic advancement through job creation; enterprise specialization; infrastructure development; and the earning of export revenues (UNWTO, 2010). Fundamentally, the number of tourist arrivals is not only the key determinant for a successful tourism business, but it is also the key source of anxiety for private sector entrepreneurs and government policymakers. Over the last six decades, tourism industry has established as a one of the largest and fastest-growing economic sectors in the world and experienced continued expansion and diversification and the international tourist arrivals (overnight visitors) reached 1035 million in 2012, globally (UNWTO, 2013). The "Tourism 2020 Vision" has projected that they will reach nearly 1.6 billion by the year 2020 (UNWTO, 2010). Within the Asia and Pacific region of which Thailand is a part, international arrivals have been growing even
1Address correspondence to Hari Sharma Neupane: Faculty of Economics, Chiang Mai University, Thailand. Email: hsneupane@yahoo.com
An Empirical Analysis of Daily International Tourist Arrivals and Risk by Land Transport: A Case of The Asia Highway in Songkhla Province of Thailand more dramatically than the world average: from 58.8 million in 1990 to reach 234 million in 2012. Interestingly, the growth of international tourist arrivals was led by Thailand with a 16% increase in tourists over 2011 and making the Asia-Pacific region - the fastest growing region in world (increased 7% than 2011) in 2012 (UNWTO, 2013).
Tourism in Thailand: International Arrivals and Contribution
Within Asia in turn, Thailand's tourism industry is the one of the fastest growing. The tourism sector of Thailand captured 22.35 million international arrivals worth US $ 30,092.00 million in tourism receipts in 2012, and shared 9.6% of the total international arrivals and 9.3% of tourism receipts in the Asia and Pacific Region (Table 1). Partly as a result, Thailand is among the top ten countries in the world and generated 2020,000 jobs directly in 2012, 5.2% of the Total employment (WTTC, 2013). The total contribution of travel and tourism to national GDP, including its wider economic impacts in the Thai macro-economy (including investment, the supply chain and induced income impact) was THB1, 896.7 billion in 2012 (16.7% of GDP) and is forecasted to rise by 7.4% to reach THB 2, 038.0 billion (17.0% of GDP) in 2013, and expected it will support 2224,000 jobs directly (5.6% of total employment) in 2012 (WTTC, 2013).
Table 1 International tourist arrivals and tourism receipts earned in some Asian countries
| S.N. | Country /Region | International Tourist Arrivals (1000) | Share in | Change 2012/11 | International Tourism Receipts (million US$) | Share in | Change 2012/11 | ||||
|---|---|---|---|---|---|---|---|---|---|---|---|
| 2010 | 2011 | 2012 | 2012 (%) | (%) | 2010 | 2011 | 2012 | 2012 (%) | (%) | ||
| 1 | Lao PDR | 1,670 | 1,786 | NA | - | - | 382 | 406 | 506 | 0.2 | 24.63 |
| 2 | Cambodia | 2,508 | 2,882 | 3,584 | 1.5 | 24.4 | 1,180 | 1,616 | 1,800 | 0.6 | 11.38 |
| 3 | Vietnam | 5,050 | 6,014 | 6,848 | 2.9 | 13.9 | 4,450 | 5,620 | 6,632 | 2.0 | 18.00 |
| 4 | Singapore | 9,161 | 10,390 | NA | - | - | 14,178 | 18,082 | 19,261 | 5.9 | 6.52 |
| 5 | Thailand | 15,936 | 19,230 | 22,354 | 9.6 | 16.2 | 20,104 | 27,184 | 30,092 | 9.3 | 10.70 |
| 6 | Malaysia | 24,577 | 24,714 | 25,033 | 10.7 | 1.3 | 18,115 | 19,656 | 20,250 | 6.3 | 3.02 |
| Asia Pacific | 205,060 | 218,214 | 233,564 | 100 | 7 | 254,747 | 298,614 | 323,865 | 100 | 8.45 | |
Source: UNWTO Tourism Highlights, 2013 Edition
In the Travel and Tourism Competitiveness Index (T&T), Thailand ranked 9th in the Asia and Pacific region and 43th position in the world. This is because Thailand "is endowed with rich natural resources and a strong affinity for Travel & Tourism (ranked and 23rd and 18th, respectively), with a very friendly attitude of the population toward tourists (ranked 13th). This is buttressed by the government's strong prioritization of the sector, with good destination marketing campaigns (11th) and relative price competitiveness (25th)" (WEF, 2013)
Even if, Thailand have relatively pleasant environment for the international arrivals among the South East Asian countries and enjoyed with remarkable growth rate for both international arrivals (11.9%) as well as foreign receipt earnings (14.4%) during the period between 2010 and 2012, the country need to concentrate on some aspects of the
Hari Sharma Neupane & Peter Calkins
regulatory environment for instances, protection of property rights and log time required for starting a business are not particularly conducive to developing the sector (ranked 77th) and environmental sustainability should be a greater priority (ranked 99th on this indicator) (WEF, 2013).
Transportation: An Accelerator For Tourism Industry
Basically, transport network are closely related to various socio-economic activities of individuals, institutions and corporations and it composed of infrastructures, modes, and terminals embedded with mobility. Mobility is one of the most fundamental and important characteristics of economic activity as it satisfies the basic need of going from one location to the other, a need shared by passengers, freight and information (Rodrigue, 2013). Additionally, mobility is also basic characteristics of the tourism in terms of transfer of visitors from one destination to another and prerequisite for supply of goods and services related to tourism activities. Therefore, tourism opportunities are likely to arise where transportation infrastructures are able to answer mobility needs and insure access to markets and tourism resources.
Literally, transportation is carrying of goods and passenger from one place to another. However, from the perspective of tourism, it is carrying of the tourism goods and tourists from their origin to the destinations where tourism products are to be administered. Generally, improved and low cost transportation services in recent years can accelerate tourists to move at the multiple areas within a short duration in the neighboring destinations. This can be achieved by the provision of rapid inter-regional transportation services as the expressways (Tsukai et al, 2010). Seaports, river and cannels; land transport (railway and roads) and airways are the major mode of the transportation. However, land transport (railway and road) is generally preferred by budget tourist in the inter-regional exploration.
Land transportation infrastructures are critical to sustenance and future development of tourism industry. As we know, tourism is about visitors being able to be moved and to move themselves around the any tourism destinations in the world. Therefore, any strategic decisions affecting transport will inevitably have an impact on tourism Industry (TIANZ, 2004). Thomas Cook organized first privately managed train excursion in 1841. Probably, from that time land transportation became indispensable part of tourism industry (Simons, 2013).
The role and efficient operation of the transportation sector are of course critical to the tourism business. Thus, investment in and the improvement of transportation facilities have expanded to encourage both tourism directly and tourism-related economic activities induced through multiplier effects. Different types of transportation mode and management are the important ingredients of the international tourism system (Culpan, 1987): "Nelson and Wall (1986) investigated the relationships of the changing transport network of Vancouver Island and confirmed the observations of Rajotte (1972) and Lundgren (1982) that established tourist destinations decline in importance once a more accessible destination is opened elsewhere" (Culpan,1987). More specifically, "The advent of Air Craft has shrunk the world, and the motor vehicle has made travel to anywhere possible. This reality coupled with changing work patterns and innovative marketing has driven international mass tourism through the years" (Sorupia, 2005).
The transport infrastructure is a significant determinant of tourism inflows into a destination and the sensitivity of tourism flows to transport infrastructure does vary,
An Empirical Analysis of Daily International Tourist Arrivals and Risk by Land Transport: A Case of The Asia Highway in Songkhla Province of Thailand depending upon both origins and destinations (Khadaroo & Seetanah, 2008). Albalate and Bel (2010) analyzed an international database of European cities to examine whether or not city planners respond to the additional demand for urban public transport by extending service supply and their results confirmed tourism intensity is a demandenhancing factor in the urban public transport (Albalate & Bel, 2010). Tsukai and Okumura (2013) demonstrate integration of tourism resources among neighboring areas of major destinations, the policy of providing novel experiences to tourists from distant places, and coordination between transportation modes to encourage tourism are crucial and concluded tourism market in Asian countries has grown rapidly every year, partially because of increasing household income and improvements in interregional transportation infrastructure (Tsukai & Okumura, 2013).
Songkhla: Geogrphical Position and International Arrivals
Songkhla province is situated in the southern region of the Thailand. A big segment of the large peninsula and stretching down to Malaysia and flanked by the Gulf of Thailand to the east and the Andaman Sea to the west. The province enjoys with a tropical monsoon climate. Geographically, Songkhla lies between the northern latitudes of 6° 17' to 7° 56' and between 100° 01' to 101° 06' east longitude at 4 meters above sea level with (P.Govt/Songkhla, 2010). The Songkhla "Tourist Map" with major land transport rout is provided in Figure 1.
The province consists of several remarkable tourism sites linked by Asian Highway networks. Major attractions includes Samila cape beach− endowed with a famous mermaid statue; Ko Nu and Ko Maew (Mouse and Cat) Islands, popular landmarks and a preferred fishing ground; Sonkhla lake―the largest natural lake in Thailand; ancient Buddhist temple; and cultural museum (P.Govt/Songkhla, 2010). Songkhla's proud cultural inheritance has been passed down from generation to generation and is enriched by the fact that the province is a melting pot of Thais, Chinese and Malays (Gov/Thai PRD, 2004). The economy of Songkhla province is influenced by tourism business, which has positive impacts on plantation crops and fisheries. Songkhla and Hat Yai are the main cities within Songkhla province, play an increasingly important role in the southern economy.
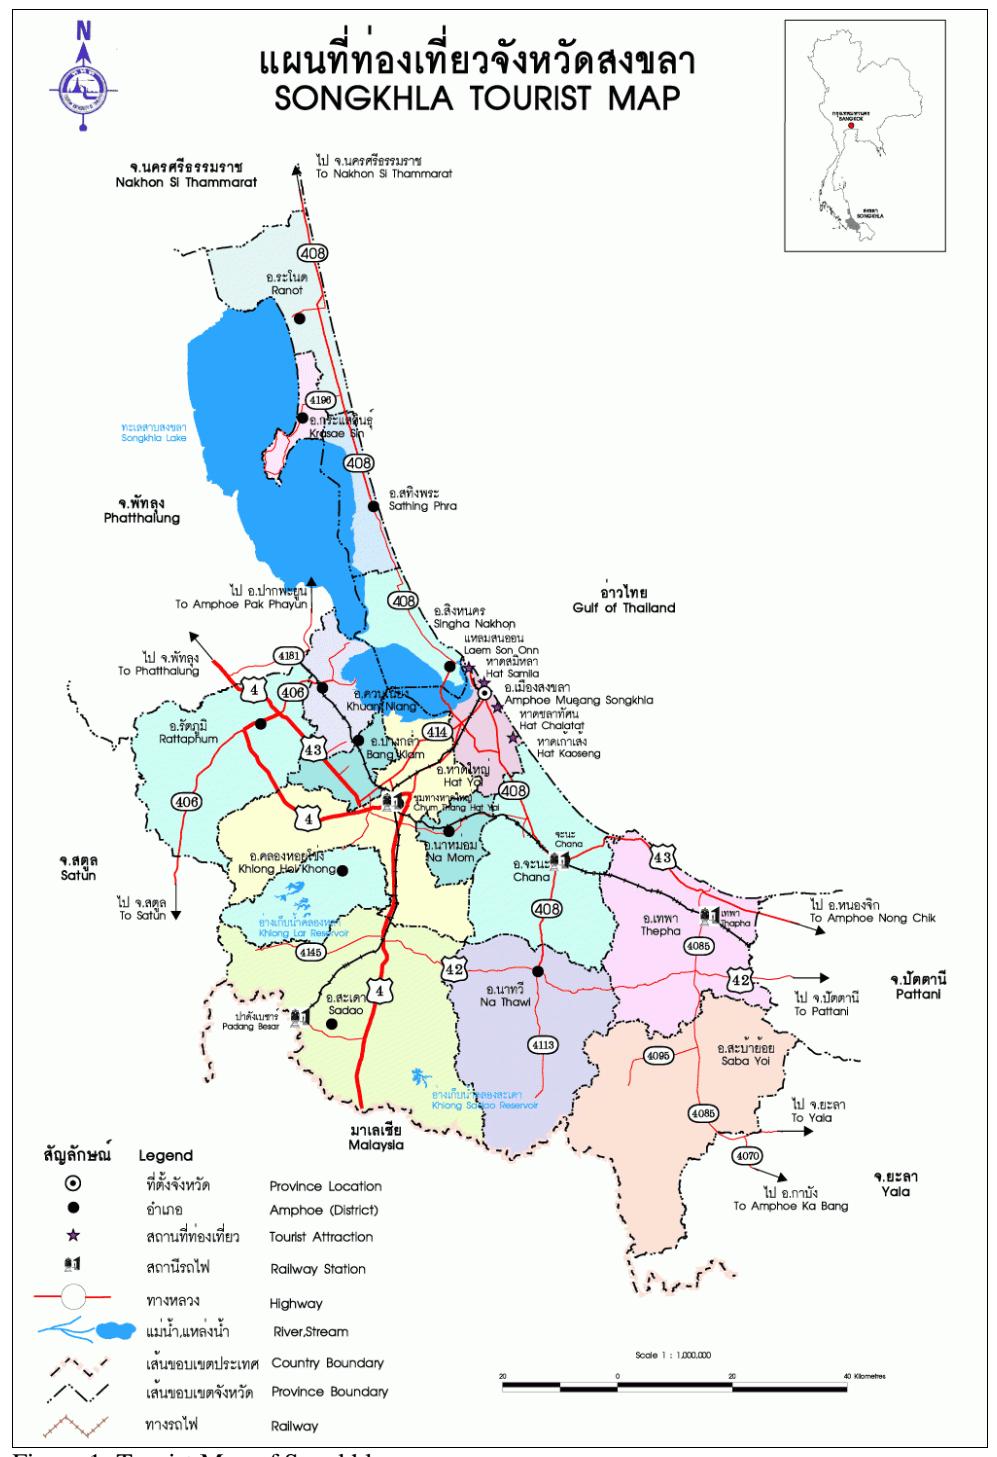
Figure 1: Tourist Map of Songkhla
Source: http://www.mapofthailand.org/tag/songkhla-map/
An Empirical Analysis of Daily International Tourist Arrivals and Risk by Land Transport: A Case of The Asia Highway in Songkhla Province of Thailand The Hat Yai city serves as the junction of communications, a business centre for southern Thailand and the gateway to and from Malaysia and Singapore. The majority of international arrivals into Songkhla province by land were from neighboring countries, 80-83% Malaysians, 3-6% Singaporeans and 13-17% from other countries (Table 2).
Table 2 Total number of international tourist arrival by land transport*
| Total | ||||
|---|---|---|---|---|
| Year | Malaysians | Singaporeans | Other Foreigners | |
| 575,400 | 30,285 | 129,391 | 735076 | |
| 2007 | (78.28) | (4.12) | (17.6) | (100) |
| 738910 | 50989 | 142757 | 932656 | |
| 2008 | (79.23) | (5.47) | (15.31) | (100) |
| 770578 | 52554 | 126674 | 949806 | |
| 2009 | (81.13) | (5.53) | (13.34) | (100) |
| 657621 | 25635 | 108380 | 791636 | |
| 2010** | (83.07) | (3.24) | (13.69) | (100) |
| % Growth rate (2007-2010 ) | 6.91 | -8.00 | -8.48 | 3.78 |
* Arrivals only from SADAO immigration port and **tourist arrival till September only
Note: Figures in parenthesis are in percentage Source: Songkhla Immigration Office, Songkhla
The Problem and Research Rationale
Undeniably, the numbers of international arrivals and their trend or nature over time are directly linked with economic activities induced by the tourism business. The trend of international arrivals in Songkhla by land transport (Table 2) shows that arrivals from Malaysia are considerably higher and growing faster than from other origin. The sustainability and economic viability of the tourism industry and foreign receipts received by the economy are obviously determined by the volume of visitor"s arrivals and tourism friendly policies. But, these trends oscillate noticeably, indicating high volatility in monthly and daily international arrivals (Figure 2, 3, and 4). Therefore, risk or volatility associated with international arrivals based on the empirical time series need to be investigated for proficient tourism planning and harness the essence of tourism benefit in the Songkhla province. The necessity of international tourist arrivals analysis for tourism planning is straightforward, and the interest of scholars and local planners is increasing in the contribution of tourism to economic and social development.
Alternatively, Thailand has a well-developed road network that will be the central part of the East West Corridor between South and South- East Asia, as well as a North-South corridor linking the ASEAN countries to China (UN, 2003). The promotion of the tourism is therefore one of the main agenda for both Indonesia- Malaysia-Thailand growth triangle (IMT-GT) and Greater Mekong Sub-regional economic growth strategy. The IMT-GT growth strategy is being implementing in the southern Thailand including Songkhla province. Moreover, the Asia High way AH 2 (No.4) and its networks are the main connecting ways for the East Asian country and tourism attractions in Songkhla province.
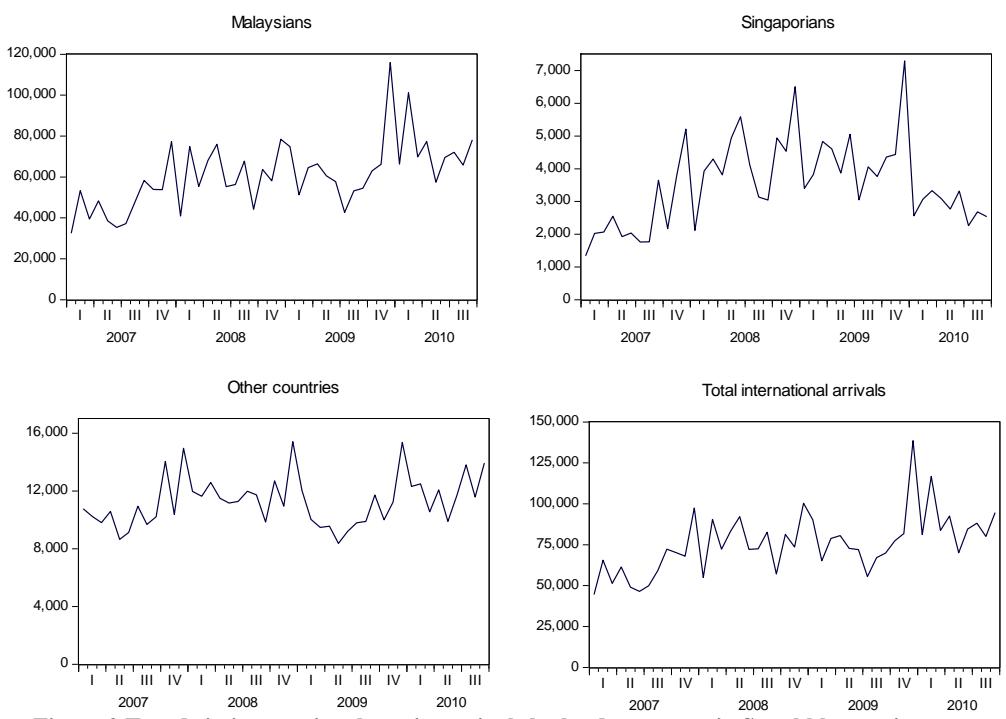
Figure 2 Trends in international tourist arrivals by land transport in Songkhla province.
This study therefore seeks to provide a rigorous objective analysis for local entrepreneurs and government planners for one key province in Southern Thailand. It appraises the present scenario of international tourist arrivals and model the risk associated with it in the Songkhla province, considering the dominant case of international arrivals by land transport. The results of this study should be advantageous for both public and private tourism planning in the province, and for forecasting tourism demand by land transport.
Songkhla was chosen because of its immense potential for tourism due to its natural beauty, ocean beaches, largest natural lake in Thailand, cultural diversity, mixture of diverse ethnic groups, and location as the business hub for southern Thailand as well for neighboring Malaysia and Singapore. The Asian Highway route AH 2 (No. 4) is only the main highway that links to the North South Economic corridor of Greater Mekong Subregion at Bangkok. As such, it is the pathway for East Asian countries to enter into the Thailand by land transport. The land transport is both the dominant means of transport and the most economical for budget travelers to roam among tourism attractions in a given destination. In this regard, the United Nations noted that "Today"s modern explorers do not need to sit riveted to their chairs listening to the tales and marveling at the richness of the cultures. The Asian Highway allows them to experience at first hand the accounts that were relayed by great explorers" (UN, 2003).
Data Sources, Nature of The Data and Limitation
The daily tourist arrivals data set used in this study were gathered from the Songkhla Immigration Office. Other information about tourism was collected from the Songkhla Office of the Tourism authority of Thailand; and the Songkhla Provincial Tourism sports and Recreation Centre.
An Empirical Analysis of Daily International Tourist Arrivals and Risk by Land Transport: A Case of The Asia Highway in Songkhla Province of Thailand
Songkhla province has two immigration ports bordering with Malaysia, namely, Sadao and Narttaya Putchoo. Of these, Sadao is the main immigration port. Due to the unavailability of data on international tourists travelling by land to Songkhla province after arrival at Bangkok port, as well as the lack of disaggregated data between Thai and foreigners at the Narttaya Putchoo Immigration Office, only data from the Sadao Immigration port were considered.
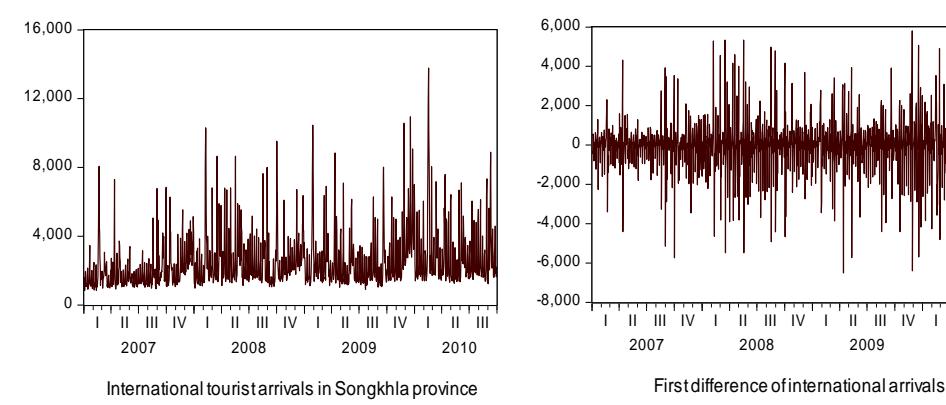
Figure 3 Daily international tourist arrivals and its first difference
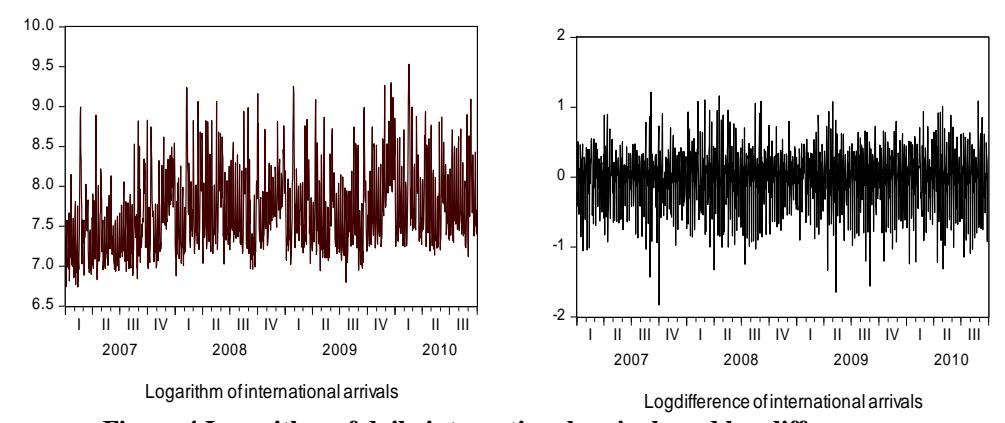
Figure 4 Logarithm of daily international arrivals and log difference
Table 3 Summary Statistics
| Table 5 Summary Statistics | ||||||
|---|---|---|---|---|---|---|
| S.N. | Type of statistics | Statistics | ||||
| 1 | Mean | 2497.08 | ||||
| 2 | Median | 1978 | ||||
| 3 | Standard deviation | 1567.19 | ||||
| 4 | Coefficient of variation | 62.8% | ||||
| 5 | Maximum arrivals per day | 13775 | ||||
| 6 | Minimum arrivals per day | 846 | ||||
| 7 | Jarque-Bera | 3649 | ||||
| 8 | Probability | 0.000 | ||||
The levels and volatility of daily international tourist arrivals between January 1, 2007 and September 30, 2010, as well as their transformed variables (first differences, logarithms and log differences) are depicted in Figures 2 and 3. The summary statistics of Table 3 showed daily mean international arrivals during the study period of 2,497, with extreme values (maximum and minimum daily arrivals) of 13,775 and 846, respectively. The median value (1,978) is substantially different from the mean; and the coefficient of variation is 62.8%. Volatility prediction and management is clearly an issue for effective tourist planning in the province.
Theoretical Foundation and Models
The forecasting of tourism arrivals and tourism demand plays a foremost role in tourism planning. Predicting future movements of tourism demand based solely on the past behavior of (proxy) variables such as arrivals or tourist expenditures rather than relating them to other variables and forecasts based on exponential smoothing methods or structural econometric models -- is computationally straightforward. For example, the Brown exponential smoothing model and Box–Jenkins method performed well in Hawaii (Lim & McAleer, 2001). Eugenio-Martín et al.(2004) also employed a generalized least squares and autoregressive (AR) model, termed AR (1), for panel data. Their results provide evidence that low- income countries need adequate levels of infrastructures and human resources to attract tourists. Meanwhile, many scholars (Cho, 2003; Chu, 2004; Chu, 2009; Song & Witt, 2006;) are devoted to analyzing the tourism arrivals and tourism demand through the adoption of wide range of the regression based econometric models.
Unit Root Test
A standard time series model assumes linearity and symmetric adjustments; in approximately symmetric time series, the Dickey-Fuller test is more powerful (Enders and Granger, 1988). A tourist arrival series ( ) is said to be stationary if the mean, variance and covariance of the series remain constant over time (Lim, McAleer & Jennifer, 2009). The formulation of an augmented Dickey-Fuller (ADF) test using lags of dependent variable ( ) is presented in equation (1), where is the first difference of and is the lag-length. The lags of captures any dynamic structure present in the dependent variables, to ensure that is not autocorrelated (Brooks, 2008; Madala, 1992 & QMS, 2007).
\[\Delta y_t = \alpha + \delta trend + \varphi y_{t-1} + \sum_{i=1}^p \theta_i \, \Delta y_{t-i} + \varepsilon_t \tag{1}\]
In this paper, we use the ADF and Phillips-Perron (PP) unit root tests to evaluate the daily international tourist arrivals series ( ) over the full sample period (Jan 1, 2007 to Sept 30, 2010), with and without a deterministic trend. The time trend is included in test in all the cases i.e. level ( ), first difference ( ) and logarithm transformation of monthly tourist arrivals ( and ). The ADF auxiliary regression in logarithm form with deterministic trend is presented in equation (2).
\[\Delta \ln y_t = \alpha + \delta \operatorname{trend} + \varphi \ln y_{t-1} + \sum_{i=1}^p \theta_i \, \Delta \ln y_{t-i} + \varepsilon_t \tag{2}\]
Where, is the logarithm of the daily international tourist arrivals in Songkhla province at time , is the lagged first difference, is error term and
An Empirical Analysis of Daily International Tourist Arrivals and Risk by Land Transport: A Case of The Asia Highway in Songkhla Province of Thailand are the parameters requiring estimation. For the unit root test, the null hypothesis, , is tested against . The outcomes of the unit root test are reported in Table 4.
Table 4 Unit root test statistics for daily international tourist arrivals in Songkhla
| Variables | ADF statistics | PP statistics | |
|---|---|---|---|
| Z={1} Z= {1,t) Z={1} | Z= {1,t) | ||
| -10.85* -11.66* -18.54* | -17.98* | ||
| -9.83* -10.89 -18.69* | -17.87* | ||
| -17.59* -17.59* -70.47* | -70.44* | ||
| -17.28* -17.87* -83.62* | -83.60* | ||
Note: the critical values for the ADF and PP tests are -3.44 and -2.87, when Z= {1} and -3.98 and - 3.42 when Z= {1, t} at the 1% and 5% level of significance respectively and * denotes test statistics are significant at 1% level of the significance. The variable and denotes the daily and first difference of daily international tourist arrivals in Songkhla. These values are estimated at lag length 10.
Models Set Up for Daily International Tourist Arrivals in Songkhla
Recently, conditional mean and conditional volatility models of the ARCH family have been extensively used to illustrate the risk or volatility of international tourist arrivals. Specifically, the popular Generalized Autoregressive Conditional Heteroskedasticity (GARCH) model (Gil-Alana, 2005; Hoti, McAleer, & Shareef, 2007; Shareef & McAleer, 2007) is particularly capable of capturing and predicting negative or positive dynamic shocks over time and useful in analyzing high frequency data. Therefore, models from the ARCH family were applied to examine the behavior of daily international arrivals in Songkhla by land transport.
The stochastic ARCH process introduced by Engle (1982) was extended into the GARCH model by Bollerslev(1986) with the inclusion of both autoregressive (AR) and moving average (MA) process. The AR model is a random process that explains the dependency behavior of a current observation based on its own previous values, whereas an MA model is used to describe a time series process as a linear function of current and previous random errors. The autoregressive moving average process of order (p, q), ARMA (p, q) is the combined model for AR and MA components in a stationary time series (Brooks, 2008; Lim & McAleer, 1999).
An autoregressive integrated moving average (ARIMA) model is a generalization of an ARMA process that includes a trend term (I) in addition to the autoregressive and moving-average components. ARIMAs have become popular in empirical time series since the work of Box and Jenkins (1976) (Chu, 2008). The AR (p); MA (q); ARMA (p, q) and ARIMA (p, d, q) processes are mentioned in following equations (Chang et al. 2009; Gil-Alana, 2005; Lima & McAleer, 1999; Wong et al., 2007). The AR (p) and MA (q) process are defined in equations (4) and (5), respectively.
\[Y_t = \alpha + \sum_{i=1}^p \phi_i Y_{t-i} + \varepsilon_t \tag{3}\]
\[Y_{t} = \mu + \varepsilon_{t} + \sum_{j=1}^{q} \theta_{j} \varepsilon_{t-j}\] \[\tag{4}\] while the generalized ARMA (p, q) process can be written as
\[(1 - \varphi_1 B - \dots - \varphi_p B^p) Y_t = C + (1 - \theta_1 B - \dots - \theta_q B^q) \varepsilon_t ; t = 1, \dots, n\] or, \[(1 - \sum_{i=1}^p \varphi_i B^i) Y_t = C + (1 - \sum_{i=1}^q \theta_i B^i) \varepsilon_t\] \[C = (1 - \varphi_1 - \dots - \varphi_p) \mu\] (5)
where, is the number of tourist arrivals at time ; denotes the mean of time series observation; is an autoregressive parameter ; is a moving average parameter ; is a backshift operator; and is white noise which is independently and identically distributed.
The simple form of conditional heteroskedastic model proposed by Engle in 1982 is represented as
\[\varepsilon_t = v_t \sqrt{\alpha_0 + \alpha_1 \varepsilon_{t-1}^2} \tag{6}\] where, is white noise process; the conditional and unconditional means of , and (Enders, 2008). The conditional variance of the error terms is time-variant, and the residual series of selected models should follow the white noise process. The lag structure of the model can be determined by adopting Akaike and Schwarz information criteria, although it is very common to impose a GARCH (1, 1) specification in advance (Coshall, 2009; Divinoa & McAleer, 2010). The stationary AR (1) – GARCH (1, 1) model for international daily tourist arrivals in Songkhla or their transformed variables are represented as :
\[Y_t = \omega + \alpha Y_{t-1} + \varepsilon_t; \qquad |\alpha| < 1 \tag{7}\] for t = 1, …, n, where the risk or shock of international tourist arrivals are given by
\[\varepsilon_{t} = v_{t} \sqrt{h_{t}} \qquad v_{t} \sim iid (0,1) h_{t} = \omega + \alpha \varepsilon_{t-i}^{2} + \beta h_{t-1};\] (8)
The conditional variance of is and , is satisfied if ; and the non-negativity condition is fulfilled. The general form of a (p, q) order GARCH process can be written as:
\[h_t = \omega + \sum_{i=1}^{q} \alpha_i \, \epsilon_{t-i}^2 + \sum_{i=1}^{p} \beta_i \, h_{t-i}\] (9)
The squared residual ( ) is the ARCH term used to glean information about volatility. The forecast variance ( ) is the GARCH term of the model (QMS, 2007).
"The ARCH (or α) effect indicates the short run persistence of the shock, while the GARCH (or β) effects indicates the contribution of the shock to the long run persistence that is " (Divinoa & McAleer, 2010).
It is possible to extend the AR process represented in equation (7) to univariate or multivariate ARMA (p, q) forms. As the GARCH process in equation (8) is a function of
An Empirical Analysis of Daily International Tourist Arrivals and Risk by Land Transport: A Case of The Asia Highway in Songkhla Province of Thailand the unconditional shocks, the moments of need to be investigate (Ling & McAleer, 2003). The parameters of the models cited in equations (7) and (8) can be estimated by adopting the maximum likelihood method to obtained quasi-maximum likelihood estimators (QMLE) in the absence of normality of the standardized residuals, (the conditional shock). However, QMLE is efficient only if is normal (Divinoa & McAleer, 2010; Huang, Chen, Chang, & McAleer, 2009).
Computationally, Ling and McAleer (2003) established that the adaptive estimation method can be executed to obtain efficient estimators for a univariate non-stationary ARMA process with GARCH (p, q) when is not normal (Ling & McAleer, 2003). Asymptotic normality and consistency of the QMLE are obtained under the second moment condition of unconditional errors and the finite fourth-order moment of the conditional errors, which can be extended for univariate ARCH and GARCH models (Ling & McAleer, 2003). The well-known necessary and sufficient condition for the existence of the second moment has been well established for the general ARCH (q); GARCH (1,1); and GARCH (p, q) and the necessary and sufficient condition for the existence of the second moment of for GARCH (1, 1) is, ; for details see (Bollerslev, 1986; Ling & McAleer, 2002a; Ling & McAleer, 2002b). The asymmetric behavior of the time series is captured by the GJR-GARCH (1, 1) model postulated by Glosten et al. (1993) to depict a negative or positive shock (downward or upward movement). The model was defined by Enders (2008) as
\[h_t = \omega + (\alpha + \gamma(\delta_{t-1})) \epsilon^2_{t-i} + \beta h_{t-1}\] (10)
where, , if , otherwise, 0. The asymmetric effect of the variable is captured by the coefficient , which measures the contribution of the shock to both short run { } and long run { } persistence, respectively. If < 1, the regularity condition for the existence of a second moment for GJR-GARCH (1, 1) is satisfied (Ling & McAleer, 2002b).
Conversely, the exponential GARCH or EGARCH model presented in equation (11), is suggested to capture the asymmetric effect in the data series. This model allows no restriction on the parameters (α, β and ) required to ensure , if is a sufficient condition for consistency of asymptotically normal values of the Quasimaximum likelihood estimators.
\[Log h_t = \omega + \alpha |v_{t-1}| + \gamma v_{t-1} + \beta log h_{t-1}\] (11)
It has been noted that GARCH and GJR models are dependent upon lagged unconditional shocks, while EGARCH depends upon lagged conditional shocks to the standardized residuals ( . Extensions of several of these results for asymmetric conditional volatility models are given by McAleer et al. (2007).
Empirical Results
The estimated conditional mean and conditional volatility models with their estimated parameters and respective standard errors for daily international tourist arrivals in Songkhla are presented in Table 5. The estimates of the lagged dependent variables in equations (7), (8), (10) and (11) are supported by the empirical findings; and most of the
Hari Sharma Neupane & Peter Calkins
estimated coefficients are statistically significant. The ARCH term, i.e. α for both the GARCH (1, 1) and GJR estimate of logarithm of daily international tourist arrivals, are significant at 1% level of significance. Likewise, the EGARCH model is also significant at the 1% level of significance. However, the β term is statistically non-significant for the GARCH (1, 1) model and only significant at the 10% level of significance for the GJR estimates. Therefore, α estimate indicates the persistence of short run shocks or risks in daily international arrivals in Songkhla. The estimated parameters are statistically valid and the second moment conditions, , and , are also valid for both GARCH (1, 1) and GARCH-GJR models with values of 0.670 and 0.457, respectively (Table 5). The EGARCH model is based on the standardized residuals. The regularity and asymptotic normality conditions for QMLE are satisfied if . Hence, the estimated coefficient for EGARCH i.e. is statistically consistent.
Equally, most of the estimated parameters in the conditional mean and conditional volatility models for logarithm-differenced variables on daily international tourist arrivals in Songkhla are also statistically significant (Table 5). The short-run persistence of risk - that is, the α estimate for GARCH (1, 1) -- is 0.258 and statistically significant at the 1% level. α is also statistically significant for GARCH-GJR model (0.567) at the 1% level of significance.
Finally, the long run persistence of the risk for both GARCH (1, 1) and GARCH-GJR models, i.e. , are 0.136 and 0.815, respectively; both are statistically significant at 1% level of significance.
The regularity and asymptotic normality condition for consistent estimators for both the GARCH and GARCH-GJR models, i.e. , and respectively, are also satisfied. Therefore, the estimated QMLE are asymptotically normal
Table 5 Estimated models and parameters and their respective standard errors
| Parameters | Logarithm of daily international tourist arrivals(LY) | Log difference of daily international tourist arrivals (DLY) | |||||
|---|---|---|---|---|---|---|---|
| GARCH | GJR | EGARCH | GARCH | GJR | EGARCH | ||
| Constant | 7.614*(0.028) | 7.667*(0.025) | 7.670*(0.027) | -0.0005(0.0004) | 0.024*(0.010) | 0.071*(0.011) | |
| AR(1) | 0.479*(0.035) | 0.525*(0.037) | 0.580*(0.028) | 0.565*(0.024) | - 0.714*(0.176) | -0.857*(0.097) | |
| MA(1) | 0.260*(0.047) | 0.214*(0.040) | 0.183*(0.029) | -0.989*(0.004) | 0.756*(0.164) | 0.900*(0.086) | |
| ω | 0.131*(0.0153) | 0.065*(0.015) | -1.378*(0.154) | 0.125*(0.013) | 0.045*(0.010) | -0.072**(0.034) | |
| GARCH/GJR α | 0.208*(0.042) | 0.205*(0.044) | - | 0.258*(0.046) | 0.567*(0.009) | - | |
| GJR γ | - | -0.285*(0.045) | - | - | - | - | |
| GARCH/GJR β | -0.141(0.097) | 0.396*(0.144) | - | - 0.121***(0.072) | 0.644*(0.002) 0.570*(0.048) | - | |
| EGARCH α | - | - | -0.164*(0.065) | - | - | -0.076*(0.020) | |
| EGARCH γ | - | - | 0.608*(0.038) | - | - | 0.438*(0.010) | |
| EGARCH β | - | - | 0.321*(0.063) | - | - | 0.914*(0.017) | |
| Diagnostic test | |||||||
| Second moment | 0.670 | 0.457 | - | 0.136 | 0.815 | - | |
| LM(1):nR2 [Prob.] | 0.973[0.324] | 0.125[0.723] | 0.178[0.673] | 0.529[0.467] | 3.097[0.078] | 0.438[0.508] | |
| LM(2) nR2 [Prob.] | 1.304[0.521] | 7.375[0.025] | 3.24[0.197] | 0.642[0.725] | - | 1.05[0.591] | |
Note: *, ** and *** denotes the estimated coefficients are statistically significant at the 1%; 5% and 10% level of significance respectively.
Figures in parenthesis are standard errors and figures in bracket are probabilities.
Additionally, the GARCH-GJR (1, 1) estimates demonstrate the asymmetry behavior of positive or negative shocks in daily international tourist arrivals. The estimated coefficients of GARCH-GJR (1, 1) models for both logarithm-transferred and logarithmdifferenced variables are negative and statistically significant. Hence, the results reveal that there is more negative shock than positive shock in daily international tourist arrivals in Songkhla over time; estimated parameter i.e. γ is statistically significant at 1% level.
In this context, the EGARCH (1, 1) is treated as the logarithm of the volatility and the coefficient represents the magnitude (size effect), which is negative and statistically significant at the 1% level of significance for logarithm and logarithm-differenced variables of daily international tourist arrivals in Songkhla, Thailand. The coefficient is positive and statistically significant at the 1% level of significance for both variables. The coefficient of the lagged dependent variable is estimated to be 0.321 and 0.914 for logarithm transformed and logarithm differenced variables, respectively, and <1. Thus, the estimated coefficients are statistically significant at the 1% level, suggesting that the statistical properties of the QMLE for EGARCH (1, 1) will be consistent and asymptotically normal.
Discussion and Conclusion
The Songkhla province is endowed with diverse tourist attractions with convenient transportation routes, accommodations, communication facilities and other tourist
Hari Sharma Neupane & Peter Calkins
amenities. Ancient monuments and places, traditional culture, natural beauty, and interesting local products are the main tourism assets in the province. There is huge opportunity to harvest contributions of tourism in terms of foreign receipts or exports, job creation and poverty reduction through the creation of local demand for goods and services.
The tourism sector in the province can be considered as a vital strategic sector for economic development. The increased volume of the international tourist arrivals in the province could be the engine of tourism business to move ahead and in turn provincial economic growth. Despite this great potential, the possible negative impacts of international tourism need to be investigated in order to manage and stabilize future tourism demand for both public-sector policy improvement and to promote private-sector. Therefore, it is necessary to rigorously and carefully investigate tourist arrival growth and volatility over time. Such has been the goal of this paper.
As discussed earlier, the daily international tourist arrivals time series and its transformed variables are stationary for our Songkhla data. The null hypothesis of a unit root is therefore statistically rejected (see Table 4). Thus, univariate time series models− the conditional mean and conditional volatility models of the ARCH family can easily be adopted based on the information criteria (AIC and SIC), residual test (correlogram, Q statistics and ARCH LM test) after imposition of ARMA models.
In this backstops, various ARMA-GARCH models were employed to model international tourist arrivals by land transport. The empirical results showed that transformed variables (logarithm and logarithm differenced) of daily international arrivals by land transport in Songkhla are stationary. In other words there is no significant trend in arrivals over the 3 year series. The short run risk or volatility in daily international tourist arrivals is quite persistent in the province. This suggests that no further expansion of tourist facilities by the private sector will be necessary to accommodate tourists over the near future on average.
The short run negative shock is observed in the international arrivals and estimated empirical coefficients of the symmetric and asymmetric conditional volatility models (GARCH, GJR and EGARCH) with exogenous ARMA (1, 1) terms are statistically significant. The regularity condition for GARCH (1, 1) and GJR (1, 1) and |β|< 1 in case of EGARCH (1, 1) are satisfied for asymptotic normality of QMLE. Therefore, the volatility can be inferred as risk is associated with daily international tourist arrivals in the provincial tourism industry by land transport.
The negative asymmetric behavior is also observed in the daily international arrivals and this empirical finding envisages that there is sufficient room for intervening or amending the provincial tourism policy to trap the essence of tourism benefit and imposition of effective policy measures to promote tourism locally as a business.
The majority of the international tourist arrivals into the Songkhla province by land transport are from neighboring countries, with more than 80% of total arrivals from Malaysia. However, the negative shock in the international arrivals by land transport indicating uncertainty of the arrivals in the provincial tourism industry of the Songkhla. Therefore, administrator, policy makers and hotel-owners have to realize this fact to stabilize negative shocks in tourism demand through, (i) targeted advertising campaigns
An Empirical Analysis of Daily International Tourist Arrivals and Risk by Land Transport: A Case of The Asia Highway in Songkhla Province of Thailand in various countries, (ii) subsidy offer to certain subgroups of tourism or special tourism packages, (iii) provision of publicly available up-to-date tourism information, (iv) capacity enhancement of the tourism personnel for providing high quality services and, (iv) harmonizing in between private and public sectors to remove the bottlenecks of the industry and attract private investment for tourism infrastructure development.
The further research on tourism demand incorporating other models of transport and behavior of domestic arrivals by land transport considering peripheral destinations in other province in the south could be an important attempt for policy implications and its real meaning. The refinement of our model for seasonal and other effects is also an important subject for future research.
Acknowledgement
We are grateful to acknowledge Thailand Research Fund and Chiang Mai University, Thailand for providing Financial and academic support for this study. We are also thankful to all the persons and Officials who had provided information during field survey and anonymous reviewer for providing valuable comments and suggestions.