
INTRODUCTION
The quantitative development of tourism is accompanied by multi-aspects including qualitative and structural transformations. The recent geopolitical changes made in different regions of the world have had a great influence on the scale and structure of tourism. Majority of the researchers are unanimous regarding the expansion and direction on the transformations of demands, so much so that there is even an accepted concept known as ―Hard and Soft Tourism‖. It is based on the observational changes within the sphere of former and actual clients in travel agencies and set the standard characteristics of two opposite kinds of tourism: the traditional tourist and the modern tourist. These are presented in table 2. With the increase in the significance of tourism as a major contributing source to the enhancement of nation's GDP, the academic researchers too has started to get involved in identifying its nature, dynamics, dimensions and effects. Tourism has been observed as the aggregate of interactions and relationships between tourists, business houses, host governments and administration and host communities (McIntosh and Goeldner, 1984). As a service sector, tourism has its own criticalities which assume significant proportion while perceiving quality associated with it. The intensive dyadic encounter between a host of tourist-service-providers and the tourists, often, does not allow the services to be homogenized. These, rather heterogeneous, services create ambiguity in perceiving quality of services received from specific touristservice-providers. But, identifying the perceived tourist service quality becomes imperative as it was empirically tested to be antecedent to tourist satisfaction (short-term effects) and destination loyalty (long-term effects). From the late 1990s the hospitality
2The University of Burdwan, West Bengal , India and tourism sector started using the philosophy of customer relationship management (CRM) as it proved to be a proactive business process to understand the tourists (customers), segment the tourists on the basis of their psychographic determinants and to design integrated communication with the same. CRM was adopted by the tourism sector with an apprehension that it will help maintain a linear relationship between perceived service quality-tourist satisfaction and destination loyalty. But in most of the cases it was found that the conventional CRM dimensions failed to facilitate the relationship. This provoked a deeper research focus to identify the compatible dimensions of relationship management for tourism.
The inbound tourism in India registered 6.31 million (5.78 million in 2010) tourists visiting with an annual growth of 9.2% (India Tourism Statistics, 2011, Ministry of Tourism, Govt. of India). This huge influx of tourists boosted the foreign exchange earnings to 77591 crores (in INR terms) with an annual growth rate of 19.6% (India Tourism Statistics, 2011, Ministry of Tourism, Govt. of India). This phenomenal growth rate has catapulted India's share in international tourist arrivals (0.64%), India's rank in world tourist arrivals (38), India's share in international tourism receipts (1.61%) and India's rank in world tourism receipts (as per RBI estimates—17) (India Tourism Statistics, 2011, Ministry of Tourism, Govt. of India). The reason for this boom can be attributed to a number of factors namely burgeoning Indian middle class, growth of highspending foreign tourists, augmentation in communication system-both physical and virtual, infrastructure & super structure and the initiatives taken up by the state governments to showcase their individual states as tourist destinations, thereby building up the brands (Gujarat, Odissa, Kerala, Madhya Pradesh etc. are some of the major branded tourism destinations). A study conducted by Federation of Indian Chambers of Commerce and Industry (FICCI) in 2011 in the area of development perspective of eco and rural tourism indicated that it registered highest employment and investment ratio. Presently, in India, the healthcare sector has an estimated revenue of around $30 billion constituting 5% of GDP and offering employment to around 4 million people [Source: Confederation of Indian Industry (CII)]. As per a recent CII-McKinsey report, the growth of this sector can contribute to 6-7% of GDP and increase employment by at least 2.5 million by 2012. According to the study conducted by the CII and McKinsey consultants, in 2005, 150,000 medical tourists visited India with the number rising by 30 percent a year. They also have predicted that the industry will grow to earn additional revenue of $2.3 billion by 2012 and revealed that medical tourism has the potentiality to generate as much as 100 billion in INR by the end of 2012. India's cultural and natural heritage is truly incredible. The brand title ‗Incredible India' not only projects India as a tourist destination but also promotes the nation as a potential export and investment hub.
‗Yatra Visawam Bhavati Ekanidam' – where the whole world meets in one nest. Rabindranath Tagore, India's first Nobel laureate, wanted Santiniketan to be that spot, where the whole world would settle, forgetting illusory geographical boundaries. Little wonder then that India's nodal authority Archaeological Survey of India (ASI) submitted Santiniketan as its official entry this year for Unesco's list on World Heritage Sites. ASI has submitted the dossier on Santiniketan to Unesco's world heritage centre in Paris, and has received a letter from the body, saying the dossier received is as per operational guidelines. Santiniketan has emerged as a tourist destination with updated facilities and amenities with regard to hospitality industry and allied services. The cultural events like Pous Mela, Basantotsav, and Magh Mela draw huge influx of domestic as well as international tourist. Santiniketan has been a major hub of educational tourism with Visva Bharati at the focal point. Every year, on an average, 5000-7500 (source: Visva Bharati)
students all over the globe make an attempt to register themselves in this university and alongwith them comes their relatives and other associates to enjoy the se renity of Santiniketan. The adjoining areas of Santiniketan namely Tarapith, Nalhati, Fullara, Bakreshwar etc. has emerged as pilgrimage-tourism centres. Tarapith, alone, caters to almost 5000 pilgrim visitors on a daily average. Santiniketan has gradually changed from a rural-based visitors' spot to a semi-urban tourist centre with technology-aided modern facilities namely online booking of hotels, ATM and kiosk banking facilities, syndicated tour-operations, traditional and fusion-based cuisine serving restaurants, hotels with adequate facilities and amenities, departmental stores etc. One of the significant attractions of Santiniketan is the gamut of handicraft items. Seeing Santiniketan's emergence as a major tourist hub, it is quite imperative that the assorted tourism service providers should have access to a well constructed tourist relationship management framework to set the dyadic relationship in a symbiotic and dynamic mode.
The objectives of this study were: (a) to justify the dimensions of Tourist Relationship Management (TRM) by modifying the existing dimensions of CRM and introducing new dimensions in the context of tourism industry, (c) to examine the possible impact of TRM dimensions on the link between tourist service quality, tourist satisfaction and destination loyalty and (d) to test the robustness of the proposed research model.
LITERATURE REVIEW
The relationship philosophy relies on co-operation and a trusting relationship with other stakeholders and network partners. While the approach has been widely used in the corporate sector, the potential application of this emerging body of knowledge for managing the complex and dynamic tourism domain has not been clearly addressed (Saxena, 2000). Hence, there is a need to examine its application to create partnerships with recognition that tourism plays an important role in revitalising rural communities and economies, historically dependent on natural resource-based commodities. Moller (2000) identified seven dimensions of this networking or collaboration: (i) basic goals, (ii) disciplinary background, (iii) key concepts (iv) methodological orientation, (v) ontological basis, (vi) level of focus & unit of analysis and (vii) focus on structure versus process. Relationship marketing was channelized to strike dyadic network with customers. Customer relationship management (CRM), an offshoot and spin -off to relationship marketing, has been observed as a continuous paradigmatic shift in managing relationship with customers by identifying the changing notions of customer attitudes, perceptions and behavioural manifestations in the context of their apprehension and expectation to be served as (Peppers and Rogers, 2004). Conceptually, CRM evolved from three basic foundations of marketing management: (a) customer orientation, (b) relationship marketing and (c) database marketing (Yim et al, 2004). Adoption, practice and implementation of CRM gained momentum among academicians and corporate houses (Gruen et al, 2000; Rigby and Ledingham, 2004; Srivastava et al, 1999; Thomas et al, 2004). CRM has been widely used by the sales personnel in augmenting their relationship with the customers (Widmier et al, 2002) to improve sales forecasting, lead management and customization (Rigby and Ledingham, 2004). Inspite of its wide application, CRM, lacked a cohesive definition and identification of its dimensions. Yim (2002) provided some conceptual clarity of CRM by synthesizing the literatures (Crosby and Johnson, 2001; Fox and Stead, 2001; Ryals and Knox, 2001) pertaining to marketing, technology and management and came out with four key focal areas: (a) strategy, (b) people, (c) processes and (d) technology. Day (2003) confirmed that the key focal factors identified by Yim (2002) can create a synergistic relationship value when they work in unison (rather than in isolate), thereby conforming to the objective and realm of CRM. Study of extant literatures revealed that implementation of CRM necessarily involved four specific activities: (a) focusing on key customers (Schmid and Weber, 1998; Srivastava et al, 1999; Sheth et al, 2000; Ryals and Knox, 2001; Armstrong and Kotler, 2003; Vandermerwe, 2004; Srinivasan et al, 2002, Jain and Singh, 2002) which encompassed the view of a customer-centric organizational structure with dyadic interactive points targeted towards identification of key or valued customers through lifetime value computations, (b) organizing around CRM (Brown, 2000; Homburg et al, 2000; Ahmed and Rafique, 2003) which emphasized on customer-centric organizational functions with an objective to ensure value proposition to customers, (c) managing knowledge (Peppard, 2000; , Freeland, 2003; Stefanou et al, 2003; Stringfellow et al, 2004, Yim et al, 2004; Plessis and Boon, 2004; Brohman et al, 2003) whereby customerinformation are effectively transformed into customer-knowledge and disseminated across the organizational hierarchy which will equip salespeople with better understanding of customers' requirements and (d) adopting CRM-based technology (Butler, 2000; Pepperd, 2000; Vrechopoulos, 2004; Widmier et al, 2002) to optimize communication with customers, accurate service delivery with back-up and supportive information, managing customer-knowledge by data warehousing and data mining and providing customized services. However, there has been a dearth of research in identifying these CRM dimensions in the context of tourism industry. CRM philosophy was adopted by the tourism sector as it allowed them to be more proactive in predicting the changing line of customer demands and allowed them to realize the extent to which they can customize their service offer with adequate differentiation. Jain and Jain (2006) delved into CRM practices of hotels in central India to measure the effectiveness against factors like: value proposition, recognition, customer orientation, reliability, relationship orientation, credibility, customization, personalization and gestures. CRM has been proved to be an effective contributor to enhance perception of service quality. Literature, however, hinted that destination competitiveness can be one of the critical components of a modified relationship management framework which would be compatible to the tourism industry and may be nomenclated as Tourist Relationship Management (TRM). The gradual transition of ‗hard tourism' into futuristic ‗soft tourism' (Table-1) has catapulted the relationship management integration with the basic operational aspects.
Table-1: Transition of tourist demand pattern: Hard tourism to soft-tourism
| Hard tourism | Soft tourism |
|---|---|
| Package tours | Individual touring |
| Short-term residences | Long-term residences |
| Model of one big travel during holidays | Model of two shorter travels during a year |
| Predetermined tour schedule | Customized tour schedule |
| Comfort and passivity | Activity and effort |
| Travels and attractions | New experiences and higher quality |
| Sense of superiority, demonstration effect | Respect and relationship |
| Lack of knowledge about attractions, culture | Knowledge about destination |
| and tradition about destination | |
| imported life style and behaviour | Lifestyle following to an example of local Population |
| Purchases | Gifts |
| Freely available mass souvenirs | Individual & customized souvenirs |
| Lack of interest in language of destination | Studying local language |
| Fast transport and frequent moves | Less importance of moving speed |
| Curiosity | Tact |
| Expectation of comfort | Comfort is not essential |
| Hard tourism | Soft tourism |
|---|---|
| A distance between client and tourist | A good relationship with tourist |
| staff | staff |
Source: Ostrowski S., Krippendorfa, J. (1983)
Studies observed that formulation of relationship strategies followed an analytical planning and destination competitiveness which will allow firms to stay ahead of its competitors and to ensure destination sustainability (Ritchie and Crouch, 2000a & 2000b; Mihalic, 2000; Buhalis, 2000; Flagestad and Hope, 2001; Kozak, 2001; Heath and Wall, 1992; Bordas, 1994; Pearce, 1997). Poon (1993) observed that tourist satisfaction can be achieved with proper strategic initiatives to build destination image and that destination competitiveness can be ensured by virtue of organized form of interactions with tourists. Destination has been apprehended to be pivotal in nurturing relationship between tourism service providers and tourists as Buhalis (2000) listed six major components of tourism attractions towards evaluating tourism destination:
- a. Attraction natural, man-made, artificial, purpose-built, heritage, special events
- b. Accessibility transportation system, terminals & vehicles
- c. Amenities accommodations, catering facilities, retailing
- d. Available packages prearranged packages by intermediaries and principals
- e. Activities activities related to tourism products
- f. Ancillary services banks, telecommunications, hospitals etc.
In addition to destination, ‗purpose' is expected to play an important role in the relationship between the tourism service providers and tourists. In addition to destination, ‗purpose' is expected to play an important role in the relationship between the tourism service providers and tourists. Literature revealed a number of issues pertaining to travel purpose and linked it with motivation for travelling sighting satisfying need hierarchy (Maslow, 1954, 1970; Burns and Holden, 1995; Hudson, 1999). Leisure and vacation have been identified as two major purposes of travelling and were linked to satisfying self actualization needs (Miller and Morrison, 2002) and self esteem needs (Pearce, 1993). Pearce (1993) identified five levels of travel purpose hierarchy: relaxation, stimulation, relationship, development and fulfillment. Brown (2010) also identified purpose of travelling as a major deterministic factor in strategizing tourism packages while analyisng volunteer tourism facets. Dann (1977) and later supported by Crompton (1979) identified seven ‗Push&Pull' factors driving travelling: (i) escape from perceived mundane environment, (ii) exploration and evaluation of self, (iii) relaxation, (iv) prestige, (v) regression, (vi) enhancement of kinship relationships and (vii) novelty and education. Purpose of travelling allows the service providers to understand the psychogenic profiles of the visitors thereby assist them to prepare the blueprint to establish a dyadic relationship.
Relationship management banks on service quality and the prospect of a long -run customer dividend is high (Coyles and Gokey, 2002; Choi et al, 2004, Ojo, 2010). A number of studies were targeted towards revealing the global attributes of services that significantly contribute to quality assessments in conventional service environment (Gronroos, 1982, 1984; Parasuraman et al., 1985, 1988). Over the years, exploration to enhancement of service quality has remained as the focal research object (Yavas et.al., 1997, Rust and Zahorik, 1993; Cronin and Taylor, 1992, 1994; Buttle, 1996; Crosby and Stephens, 1987; Parasuraman et.al. 1988; Kearns and Nadler, 1992; Avkiran, 1994; Julian and Ramaseshan, 1994; Lewis, 1989; Llosa et.al., 1998). The study of service quality was pioneered by Parasuraman, Zeithaml and Berry (PZB), who developed the gaps framework in 1985 and its related SERVQUAL instrument in 1988 (Parasuraman,
Zeithaml and Berry [PZB] 1985, 1988, 1991). Baker and Crompton (2000) observed that the literature related to quality in the area tourism and allied area dates back to the early 1960's. Most of the contemporary research works involving service quality in tourism focused on the perceptual framework of tourists towards service quality (Atilgan, Akinci, & Aksoy, 2003; Baker & Crompton, 2000; Chadee & Mattsson, 1996; Frochot, 2004; Hudson, Hudson, & Miller,2004; Vogt & Fesenmaier, 1995; Weirmair & Fuchs, 1999), tour operator and travel agency quality (Ryan& Cliff, 1997), hotel and its hospitality quality (Suh, Lee, Park, & Shin, 1997) etc. However, Frochot (2004) pointed out that given the nature of service, the evaluation of its quality is quite complex. Vijayadurai (2008) identified service quality factors in hospitality industry and assumed them to be critical in creating loyal visitors who will return to the destination and recommend it to others (Tian-Cole & Cromption, 2003). Pawitra and Tan (2003) used SERVQUAL in order to analyse the destination image of Singapore from the perspective of tourists from Indonesia and noted that the use of SERVQUAL in measuring a destination image requires that it be modified in order to ensure that the data reflect the unique attributes provided by the destination. Atilgan et al. (2003) suggest that cultural characteristics have an effect on perceptions of service quality in tourism and found that different cultural groups can have different levels of expectations and perceptions in terms of service quality dimensions.
Tourist satisfaction can be obtained by assessing the gap between predicted and perceived service. Service quality has been recognized as an antecedent to tourist satisfaction (Suki, 2013, Canny and Hidayat, 2012). Dmitrovic et al (2009), in a study observed that tourist satisfaction as a result of sequential interrelated consequences starting with destination image through perceived service quality and value. Oliver (1981) claimed that tourist satisfaction can be seen as a tourists' post-purchase evaluation of the destination. In many studies, satisfaction was distinguished as an antecedent of loyalty (Kozak, 2001; Jang & Feng, 2006). Although Oppermann (2000) stated that studies on tourist satisfaction and destination loyalty have not been thoroughly investigated, Chi and Qu (2008, p. 624) claimed tourist satisfaction as critical to profitability. several studies have been conducted to examine the influence of customer satisfaction on loyalty (Gummesson, 1993; Anderson and Fornell, 1994; Um et al., 2006; Hui et al., 2007). Gotlieb et al. (1994) asserted that positive satisfaction had positive influence on tourists' repurchase intention. Similarly, Baker & Crompton (2000); Petrick et al. (2001), and Jang & Feng (2006) highlighted that satisfaction is the primary antecedent of revisit intention.
In tourist destination researches (e.g. Oliver, 1997; Yoon & Uysal 2005), tourist satisfaction has been measured by different items such as overall satisfaction, performance, expectation, and positive recommendation. Notably, Chi and Qu (2008) maintained loyalty to be a better predictor of actual behavior compared to satisfactio n. In this respect, Chen and Tsai (2007) conclude that a key effect of tourist satisfaction that influences tourism intentions for revisit both in short and long term is loyalty to the destination. Importantly, there is an agreement among several scholars that satisfaction provided a ground for revisit and positive word of mouth recommendations which are the indicators of loyalty (e.g. Kozak & Rimmington, 2000; Yoon & Uysal 2005; Chi and Qu, 2008). Kozak (2001) pointed that level of satisfaction as one of the most dominant variables in explaining revisit intention. Accordingly, in tourism destination's researches, it has been widely underlined that tourist satisfaction, loyalty and revisit intention have strong relationship (eg. Yoon & Uysal, 2005; Awadzi &
Panda, 2007), while a few studies disapproved the positive relationship between tourist satisfaction and revisit intention (e.g. Um et al., 2006).
Researchers have verified the relationship between the tourist satisfaction and destination loyalty (Chi and Qu, 2008; Yoon and Uysal, 2005) not in terms of revisit intention but also through advocacy (Bigne et al, 2009; Murray and Howat, 2002; Yoon and Uysal, 2005). Destination loyalty has been highlighted as one of the most importan t subjects in tourism researches. In many studies, revisit intention and positive word of mouth recommendation are noted as indicators of loyalty (e.g. Yoon & Uysal 2005; Chi and Qu, 2008). Several studies have attempted to identify major antecedents of revisit intention including satisfaction (Petrick et al., 2001; Kozak 2001), novelty seeking (Jang & Feng, 2007), image (Chi & QU, 2008), motivation and satisfaction (Yoon & Usal, 2005), safety (Chen & Gursoy, 2001), overall satisfaction (Campo- Martinez et al. 2010), cultural difference ( Chen & Gursoy, 2001), perceived value ( Petrick et al.,2001), past vacation experience( Kozak ,2001), and the like. In this regard, notably, Jang and Feng (2007) asserted that even though the extent of research finding is well focused on determinants of repeat visit intention, it can be contested that understanding tourists' revisit intention and their behavior remains limited. Revisit intention has also been focused as an important issue from economic perspective in tourism studies (e.g. Darnell & Johnson, 2001). Hsu et al. (2008) observed preserving loyalty of established customer as a crucial contributor to the achievement and profitability of business. Accordingly, the main reason why researchers should consider revisit intention is the fact that ―globalization of markets, competitive pressure, brand multiplication and, above all, the ever-changing lifestyles and consumer behavior have forced companies to develop strategies to keep their clients and create consumer loyalty programs‖ (Flambard-Ruaud, 2005), particularly in tourism industry.
Research gap identified
Literature remained inconclusive regarding the compatibility of relationship management dimensions in tourism perspective. Even, if Tourist Relationship Management framework has been worked upon; its impact as antecedent and moderating variable has not been tested on critical variables namely service quality, satisfaction and loyalty.
Formulation of hypotheses
Based on the review of literature this paper attempts empirically to explore possible linkages between perceived tourist service quality (PTSQ), tourist satisfaction (TS) and destination loyalty (DL) with probable moderating impact of TRM dimensions (TRMD) on PTSQ, TS and DL link.
Accordingly it is hypothesized that,
H1: TRM dimensions share relationship with PTSQ, TS and DL.
H2: Better performance of TRM dimensions (TRMD) will have stronger impact of perceived tourist service quality (PTSQ) on tourist satisfaction (TS) and vice versa.
H3: Better performance of TRM dimensions (TRMD) will have stronger tourist satisfaction (TS) on destination loyalty (DL) and vice versa.
H4: Destination loyalty (DL) behaviour will be strengthened under the impact of TRM dimensions (TRMD), if perceived tourist service quality (PTSQ) and tourist satisfaction (TS) are high.
Proposed research model
Based on the literature reviewed and hypotheses formulated, the researchers would like to test the following research model (Fig.1) for robustness.
Fig.1: Research Model
(Legends description: PTSQ-Perceived tourist service quality, TS-Tourist satisfaction, DL-Destination loyalty, TRMD-TRM dimensions)
RESEARCH METHOD
The study was conducted in two phases. A structured questionnaire was developed to obtain the primary data. Phase-I involved a pilot study to refine the test instrument with rectification of question ambiguity, refinement of research protocol and confirmation of scale reliability was given special emphasis (Teijlingen and Hundley, 2001). 20 respondents representing tourists of assorted demography and academicians were included to conduct the pilot study through focus group interview technique. Cronbach's α coefficient (>0.7) established scale reliability (Nunnally and Bernstein, 1994). The refined survey instrument had four sections. Section-I was targeted for tourists and it asked questions about tourists' expectation and perception of service quality offered by the service providers at Santiniketan, section-II was designed to generate response from the tourists with regard to their level of satisfaction derived out of the services they were offered and allied elements, section-III targeted tourist response in context of destination loyalty, section-IV was intended for the service providers whereby they were asked about the relationship management practices they have deployed in integration with their service offerings and section-V attempted to collect the demographic profile of the tourists. A 7 point Likert scale (Alkibisi and Lind, 2011) was used to generate response. The second phase of the study used convenience sampling technique as the tourists visiting Santiniketan and its adjoining areas were dispersed geographically. A total number of 1974 usable responses were generated out of 2500 questionnaires used for the tourists, with a response rate of 78.96%. For the section-IV of the questionnaire, service employees of the rank of managers, relationship executives etc. were interviewed. As many as 546 personnel associated with assorted tourism services in Santiniketan and its adjoining tourist areas were interviewed.
Factor constructs measurement
SERVQUAL, developed by Zeithaml, Parasuraman and Malhotra (2005), was used to develop a measure for perception of service quality with adequate modification to suit
responses with regard to tourist services. Respondents' perception of satisfaction was measured using the items developed by Weiermair and Fuchs, 1999 and Fuchs and Weiermair, 2003. Revisit intention and tourist referrals (advocacy) made up the destination loyalty indices (Taylor, 1998; Oh and Parks, 1997; Oh, 2000). The TRM dimensions were scaled on 20 items developed by Yim et al (2004) (to dimensionalize CRM) which were adequately modified to suit tourism platform. The additional constructs to make relationship management compatible with tourism imperatives on the basis of destination and purpose of visit were created with 5 and 6 items respectively and were tested for internal reliability and validity.
Reliability and validity
To examine the internal reliability and validity of the constructs, exploratory factor analysis (EFA) was deployed using principal axis factoring procedure with orthogonal rotation through VARIMAX process. Cronbach's α was obtained to test the reliability of the data, Kaiser-Meyer-Olkin (KMO) was done for sample adequacy and Barlett's sphericity test was conducted. Cronbach's α coefficient (>0.7) established scale reliability (Nunnally and Bernstein, 1994). The scales used in this study were adapted from established existing measures that have been applied and validated in numerous tourism studies. In addition, the validity of the measurement scales was also assessed via the confirmatory factor analysis. The convergent validity of the scales were measured by tests of composite reliability (CR) and average variance extracted (AVE). Higher CR and AVE values indicate higher convergent reliability of the measurement. The Discriminant validity is established when the AVE values exceed the square of the correlations between each pair of latent constructs (Fornell and Larcker, 1981).
Finally, LISREL 8.80 programme was used to conduct the Structural Equation Modeling (SEM) and Maximum Likelihood Estimation (MLE) was applied to estimate the CFA models.
DATA ANALYSIS AND INTERPRETATION
The demographic data obtained were tabulated in Table-2:
Table-2: Demographic data of the respondents
| Demographic Variables | Factors | Frequency | % |
|---|---|---|---|
| Male | 1397 | 70.77% | |
| Gender | Female | 577 | 29.23% |
| ≤ 21 years | 64 | 3.27% | |
| 22-32 years | 346 | 17.52% | |
| Age | 33-43 years | 634 | 32.11% |
| 44-54 years | 598 | 30.29% | |
| ≥ 55 years | 332 | 16.81% | |
| ≤ Rs. 14999.00 | 61 | 3.10% | |
| Rs. 15000-Rs. 24999.00 | 389 | 19.70% | |
| Income | Rs. 25000-Rs. 44999.00 | 1249 | 63.27% |
| ≥ Rs. 45000.00 | 275 | 13.93% |
| Demographic Variables | Factors | Frequency | % |
|---|---|---|---|
| Service [govt./prv] | 1046 | 52.98% | |
| Self employed | 467 | 23.65% | |
| Occupation | Professionals | 198 | 10.03% |
| Student | 42 | 2.12% | |
| Housewives | 180 | 9.11% | |
| Others [retd., VRS etc] | 41 | 2.11% | |
| High school | 29 | 1.48% | |
| Educational qualification | Graduate | 1386 | 70.21% |
| Postgraduate | 305 | 15.45% | |
| Doctorate & others (CA, fellow etc) | 254 | 12.86% |
The results of the EFA were displayed in Table-3. The Cronbach's Coefficient alpha was found significant enough, as it measure >.7 (Nunnally and Bernstein, 1994) for all constructs and therefore it is reasonable to conclude that the internal consistency of the instruments used were adequate. Each accepted construct displayed acceptable construct reliability with estimates well over .6 (Hair, Anderson, Tatham and William, 1998). Further to this the average variance extracted (AVE) surpassed minimum requirement of .5 (Haier et al., 1998). The KMO measure of sample adequacy (0.893) indicated a high shared variance and a relatively low uniqueness in variance (Kaiser and Cerny, 1979). Barlett's sphericity test (Chi-square=1972.0438, df= 287, p<0.001) indicated that the distribution is ellipsoid and amenable to data reduction (Cooper and Schindler, 1998).
Table-3: Measurement of reliability and validity of the variables
| Items | FL | t | α | AVE | ||||
| Perceived Tourist Service Quality (PTSQ) | ||||||||
| Physical infrastructures of tourism service providers at | 0.623 | 22.761 | .923 | 0.896 | ||||
| Santiniketan are updated. (PTSQ1) | ||||||||
| Physical facilities of tourism service providers at Santiniketan are visually appealing. (PTSQ2) | 0.634 | 27.028 | .923 | 0.896 | ||||
| The service employees representing the tourism service providers are smart in their appearance. (PTSQ3) | 0.601 | 18.312 | .923 | 0.896 | ||||
| The tourism service providers at Santiniketan operate at | 0.671 | 28.098 | .923 | 0.896 | ||||
| convenient hours. (PTSQ4) | ||||||||
| The tourism service providers at Santiniketan are easy to access. | 0.643 | 27.906 | .923 | 0.896 | ||||
| (PTSQ5) | ||||||||
| The service employees representing the tourism service | 0681 | 28.921 | .923 | 0.896 | ||||
| providers pay individual attention to tourists. (PTSQ6) | ||||||||
| Services are provided to the tourists when committed by the | 0.678 | 28.661 | .923 | 0.896 | ||||
| tourism service providers. (PTSQ7) | ||||||||
| The tourism service providers at Santiniketan are conveniently | ||||||||
| located. (PTSQ8) | 0.691 | 19.672 | .923 | 0.896 | ||||
| Physical ambience of the premise of the tourism service | 0.683 | 17.265 | .923 | 0.896 | ||||
| providers touches heart. (PTSQ9) | ||||||||
| Value proposition of the services are adequate to justify the | 0.702 | 18.487 | .923 | 0.896 | ||||
| benefit versus the sacrifices made. (PTSQ10) | ||||||||
| Items | FL | t | α | AVE |
|---|---|---|---|---|
| The tourism service providers at Santiniketan are providing the first time service right. (PTSQ11) | 0.719 | 23.921 | .923 | 0.896 |
| The ambience of the tourist venues is rich in aesthetics, culture and ethnicity. (PTSQ12) | 0.688 | 17.731 | .923 | 0.896 |
| The tourist spots are rich in greenery and have minimum level of pollution. (PTSQ13) | 0.727 | 26.001 | .923 | 0.896 |
| A number of well distinguished tourist spots are identifiable and accessible (PTSQ14) | 0.719 | 24.911 | .923 | 0.896 |
| The cultural and ethnic events provide opportunity to absorb the warmth of destination. (PTSQ15) | 0.691 | 19.672 | .923 | 0.896 |
| Santiniketan, as a tourist destination, is free from undesirable disturbances. (PTSQ16) | 0.682 | 17.264 | .923 | 0.896 |
| Local administration of Santiniketan takes well care of problems if reported. (PTSQ17) | 0.725 | 25.812 | .923 | 0.896 |
| Local people of Santiniketan are quite amicable and are ready to help if required. (PTSQ18) | 0.713 | 23.091 | .923 | 0.896 |
| Tourist satisfaction (TS) | ||||
| I am satisfied with the lodging facilities provided by my service provider at Santiniketan. (TS1). | 0.761 | 25.501 | .904 | 0.879 |
| I am satisfied with the dining facilities, covering variety of cuisine, quality, price, cleanliness, presentation, taste and convenience. (TS2). | 0.742 | 26.113 | .904 | 0.879 |
| I am satisfied with the shopping opportunity of the tourist destinations in Santiniketan. (TS3) | 0.789 | 27.815 | .904 | 0.879 |
| I am satisfied with the destination attractions namely cultural, ethnic, scenic, and historical attractions. (TS4) | 0.817 | 32.298 | .904 | 0.879 |
| I am satisfied with the activities and events of Santiniketan namely Pous Mela, Basantotsav, Baitalik, and local cultural programmes. (TS5) | 0.802 | 29.656 | .904 | 0.879 |
| I am satisfied with the general environment of Santiniketan pertaining to safety & security, cleanliness, peaceful atmosphere etc. (TS6) | 0.799 | 29.003 | .904 | 0.879 |
| I am satisfied with the accessibility of services at my tourist destination in terms of transportation, hospitality, logistics, parking, banking etc. (TS7) | 0.771 | 26.382 | .904 | 0.879 |
| Destination loyalty (DL) | ||||
| I shall definitely revisit Santiniketan. (DL1). | 0.718 | 26.442 | .922 | 0.893 |
| I shall promote Santiniketan as an excellent tourist destination amongst my friends, colleagues, relatives and other associates (DL2) | 0.701 | 24.052 | .922 | 0.893 |
| Tourist Relationship Management dimensions (TRMD) | ||||
| Our organization establishes and monitors customer-centric performance standards at all tourist touch points (TRMD1) | 0.699 | 22.981 | .914 | 0.874 |
| Our organization has established clear business goals related to tourist acquisition, development, retention and reactivation. (TRMD2) | 0.687 | 21.087 | .914 | 0.874 |
| Our organization has the sales and marketing expertise and resources to succeed in TRM (TRMD3) | 0.671 | 19.001 | .914 | 0.874 |
| Our employee training programme has been designed to develop the skills required for acquiring and deepening tourist relationships. (TRMD4) | 0.718 | 25.671 | .914 | 0.874 |
| Items | FL | t | α | AVE |
|---|---|---|---|---|
| Employee performance is measured and rewarded based on meeting tourist needs and on successfully serving the tourist. (TRMD5) | 0.679 | 18.762 | .914 | 0.874 |
| Our organizational structure has been designed to foster tourist centricity. (TRMD6) | 0.681 | 19.002 | .914 | 0.874 |
| Our organization commits time and resources to manage tourist relationships. (TRMD7) | 0.669 | 17.401 | .914 | 0.874 |
| Our organization has apt softwares to serve our tourists. (TRMD8) | 0.652 | 15.204 | .914 | 0.874 |
| Our organization has required hardwares to serve our tourists. (TRMD9) | 0.672 | 18.110 | .914 | 0.874 |
| Our organization has the proper technical personnel to provide technical support to our relationship management executives. (TRMD10) | 0.691 | 20.028 | .914 | 0.874 |
| Our organization maintains a comprehensive database of our tourists. (TRMD11) | 0.701 | 22.918 | .914 | 0.874 |
| Individual tourist information is available at every point of contact (TRMD12) | 0.684 | 19.278 | .914 | 0.874 |
| Our organization provides customized services to our valued and key tourists. (TRMD13) | 0.664 | 17.217 | .914 | 0.874 |
| Our organization communicates with key tourists to customize our offerings on demand. (TRMD14) | 0.631 | 14.283 | .914 | 0.874 |
| Our organization makes an effort to find out what the key tourist requirements are (TRMD15) | 0.679 | 19.005 | .914 | 0.874 |
| Our employees make coordinated efforts to deliver customize service once a tourist places a demand for such service (TRMD16) | 0.702 | 20.098 | .914 | 0.874 |
| Each and every employee of our organization treats tourists with great care. (TRMD17) | 0.617 | 14.562 | .914 | 0.874 |
| Our organization provides channels to enable ongoing two-way communication between our key tourists and us. (TRMD18) | 0.629 | 15.672 | .914 | 0.874 |
| Our tourists can expect exactly when services will be performed (TRMD19) | 0.718 | 25.091 | .914 | 0.874 |
| Our organization fully understands the requirements of our key tourists and us. (TRMD20) | 0.663 | 18.782 | .914 | 0.874 |
| Our organization maintains the database of major destination attractions for our key tourists. (TRMD21) | 0.687 | 19.871 | .914 | 0.874 |
| Our organization facilitates tourists in accessing the major destination attractions. (TRMD22) | 0.624 | 15.214 | .914 | 0.874 |
| Our organization provides requisite amenities to ensure safe visit for tourists to destinations. (TRMD23) | 0.609 | 14.009 | .914 | 0.874 |
| Our organization provides adequate packages that cover smooth and hassle-free destination visits. (TRMD24) | 0.672 | 18.918 | .914 | 0.874 |
| Our organization arranges activity supports for tourists as per destination requirements. (TRMD25) | 0.711 | 23.091 | .914 | 0.874 |
| Our organization has networked to provide ancillary services to tourists. (TRMD26) | 0.709 | 22.738 | .914 | 0.874 |
| Our organization understands the purpose of visit of tourists and provides services accordingly. (TRMD27) | 0.724 | 26.198 | .914 | 0.874 |
| Our organization has resources to match the purpose of tourist visits. (TRMD28) | 0.694 | 20.018 | .914 | 0.874 |
| Items | FL | t | α | AVE | |
|---|---|---|---|---|---|
| Our organization has necessary tie-ups and networks to synchronize with the purpose of visit of tourists. (TRMD29) | 0.648 | 16.552 | .914 | 0.874 | |
| KMO | 0.893 | ||||
| 2 Chi-square (χ ) | 1972.0438 | ||||
| Barlett's Test of sphericity | df | 287.000 | |||
| Sig. | .000 | ||||
** FL: factor loadings, t: t-value, α: Cronbach's α, AVE: average variance extracted
The dimensions of perceived tourist service quality (PTSQ) and CRM have been nomenclated as per the component-wise factor loadings in Table-4.
Table-4: Dimensions of PTSQ and CRM
| Items as per factor loadings post | Dimension name | ||||||||||
| EFA | |||||||||||
| PTSQ1, PTSQ2, PTSQ3, PTSQ9 | Servicescape | ||||||||||
| Perceived | PTSQ4, PTSQ5, PTSQ8 | Accessibility | |||||||||
| Tourist | PTSQ6, PTSQ7, PTSQ10, | ||||||||||
| Service | PTSQ11 | Reliability | |||||||||
| Quality | PTSQ12, PTSQ13, PTSQ14, | ||||||||||
| (PTSQ) | PTSQ15 | Ethnicity | |||||||||
| PTSQ16, PTSQ17, PTSQ18 | Hospitality | ||||||||||
| TRMD1 – TRMD7 | Organizing around TRM (TRMO) | ||||||||||
| Integrating TRM technology | |||||||||||
| Tourist | (TRMT) | ||||||||||
| Relationship | TRMD13 – TRMD17 | Key tourist focus (KFT) | |||||||||
| Management | TRMD18 – TRMD20 | Managing tourist knowledge (TKM) | |||||||||
| TRMD 21- TRMD26 | Destination denomination (DD) | ||||||||||
| TRMD 27 – TRMD 29 | Purpose denomination (PD) | ||||||||||
| Variable | TRMD8 – TRMD12 | ||||||||||
The path-analysis using LISREL-9.1 (Fig.2) confirms the convergence of the observed variables (TRMO, TRMT, KFT, TKM, DD & PD) and the latent variable [(Tourist Relationship Management (TRMD)] confirming the fact that the identified dimensions of tourist relationship management are adequate to justify the reliability and validity of the same.
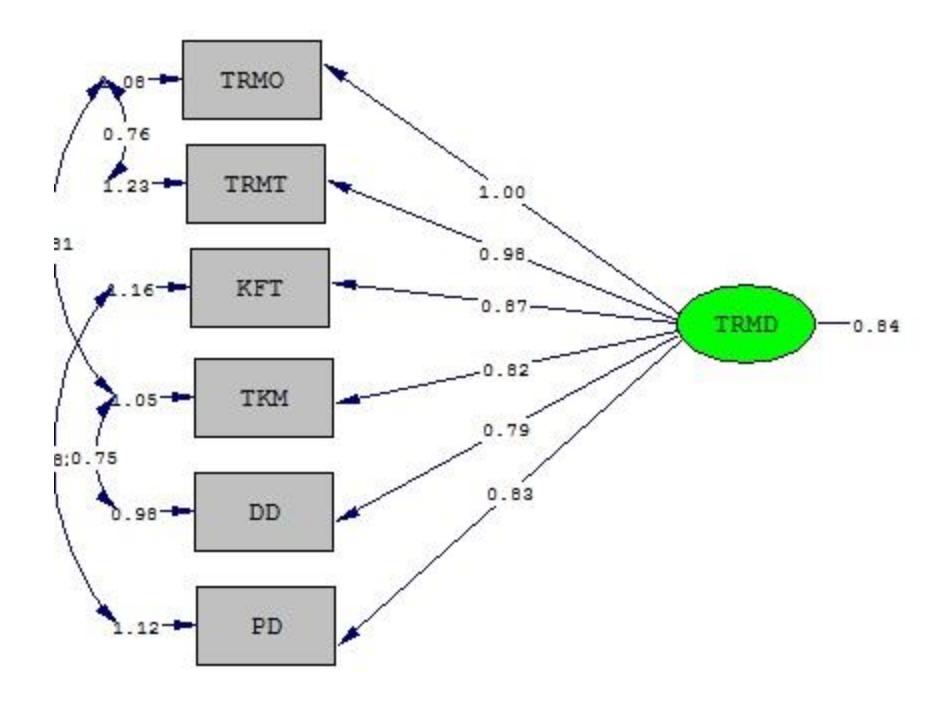
Fig.2: Path analysis depicting observed and latent variables
To test correlationship between perceived tourist service quality (PTSQ), tourist satisfaction (TS) destination loyalty (DL) and tourist relationship management (TRM), bivariate correlation was deployed. The mean response score was obtained for each of the variable across the items loaded in EFA for each individual tourist and later on summated and averaged to obtain the composite mean score for each variable. The results of the bivariate correlation analysis were displayed in Table-5. The results confirmed that TRM dimensional output shared strong and positive correlation with PTSQ (r=.162**, p<.001), moderately positive relationship with TS (r=.098*, p<.005) and strong and positive correlationship with DL (r=.101**, p<.001). TS and DL shared strong and positive correlation with each other (r=.136**, p<.001) while PTSQ shared significant correlation with DL (r=.205**, p<.001) and TS (r=.369**, p<.001). H1 is supported.
Table-5: Bivariate correlation between perceived tourist service quality (PTSQ), tourist satisfaction (TS) and destination loyalty (DL)
| TRMD | PTSQ | TS | DL | ||
|---|---|---|---|---|---|
| Pearson Correlation | 1 | 162** | .098* | 101** | |
| Sig. (2-tailed) | .000 | .001 | .000 | ||
| TRMD | Sum of Squares and Cross-products | 49.618 | 44.561 | 38.763 | 36.987 |
| Covariance | .783 | 1.763 | .609 | .599 | |
| N | 1974 | 1974 | 1974 | 1974 | |
| Pearson Correlation | 162** | 1 | .369** | .205** | |
| Sig. (2-tailed) | .000 | .000 | .000 | ||
| PTSQ | Sum of Squares and Cross-products | 44.561 | 57.662 | 48.634 | 43.817 |
| Covariance | 1.763 | .824 | .695 | .626 | |
| N | 1974 | 1974 | 1974 | 1974 | |
| Pearson Correlation | .098* | .369** | 1 | .136** | |
| Sig. (2-tailed) | .001 | .000 | .000 | ||
| TS | Sum of Squares and Cross-products | 38.763 | 48.634 | 83.437 | 53.718 |
| Covariance | .609 | .695 | 1.192 | .767 | |
| N | 1974 | 1974 | 1974 | 1974 | |
| Pearson Correlation | 101** | .205** | .136** | 1 | |
| Sig. (2-tailed) | .000 | .000 | .000 | ||
| DL | Sum of Squares and Cross-products | 36.987 | 43.817 | 53.718 | 83.859 |
| Covariance | .599 | .626 | .767 | 1.198 | |
| N | 1974 | 1974 | 1974 | 1974 |
** Correlation significant at 0.01 level (2-tailed)
Hierarchical regression analysis was deployed by considering the average (mean) values of the variables (across the items) to understand the direct and the mediating effects of TRMD on PTSQ-TS link and TS-DL link. For providing empirical evidence to our hypotheses, we proposed an ordinary least square (OLS) regression for our dependent variables TS and DL. The following models were constructed:
- (i) TS = β0 + β1*PTSQ + β2*TRMD + β3*PTSQ*TRMD+ εi
- (ii) DL = β0 + β1*TS + β2*TRMD + β3*TS*TRMD+ εi
- (iii) DL = β0 + β1*TS + β2*PTSQ+ β3*TRMD + β4*TS*PTSQ+ β5*PTSQ*TRMD + β6* TS*TRMD + β7* PTSQ*TS*TRMD + εi
The regression models were displayed in Table-6. Three models were generated. Model 1 depicted the direct effects, model 2 represented the binary interaction and model 3 portrayed the ternary interaction between variables. Standardization was applied to avoid interference with regression coefficients arising out of multicollinearity between
interaction variables (Irwin and McClellan, 2001; Aiken and West, 1991). The VIF (variance inflation factor) corresponding to each independent variable is less than 5, indicating that VIF is well within acceptable limit of 10 (Ranaweera and Neely, 2003). Results of Model-1 revealed that PTSQ is significantly predictive for TS (β = .652, t=6.009, p<0.01) while the direct effect of TRMD on TS was also found to be significant (β = .498, t=4.664, p<0.01). Model-1 further revealed that TS can significantly be associated with DL and that TS has the predicting capacity to predict DL ((β = .642, t=6.959, p<0.01). TRMD was also found to be predictive of DL (β = .589, t=5.876, p<0.01) and so was PTSQ (β = .354, t=2.873, p≤0.05). Results of Model-1 reinforced support to H1. The binary interaction between TRMD and PTSQ (Model-2) indicated that with the increase in TRMD performance the impact of PTSQ on TS increases significantly (β = .284, t=3.107, p<0.05) while the binary interaction between TRMD and TS assured that better performance of TRMDs will augment the impact of TS on DL (β = .553, t=6.252, p<0.01). Model-2 also revealed that an increased PTSQ will register a profound effect of TS on DL (β = .312, t=3.981, p<0.01). Results of Model-2 supported to H2 and H3. Model 3 revealed the ternary interaction whereby it was established that DL behaviour will be strengthened under moderating effects of TRMD if PTSQ and TS are perceived to be high (β = .491, t=4.871, p<0.01). Model-4 reassured H2 and H3 and supported H4.
Table-6: Hierarchical regression results
| Dependent variable-TS, Independent variable-PTSQ, Moderating variable | |||||||||||
|---|---|---|---|---|---|---|---|---|---|---|---|
| Independent | TRMD | ||||||||||
| Variables | Model-1 | Model-2 | Model-3 | ||||||||
| β /t /Sig. | β/t/Sig. | β/t/Sig. | VIF | ||||||||
| PTSQ | .652/6.009/.000 | 1.541 | |||||||||
| TRMD | .498/4.664/.000 | 1.457 | |||||||||
| Binary interaction effects | |||||||||||
| PTSQ*TRMD | .334/5.107/.000 | 1.481 | |||||||||
| 2 R | .492 | .555 | |||||||||
| Adjusted R2 | .484 | .542 | |||||||||
| F-value | 66.725 | 42.374 | |||||||||
| Sig. | .000 | .000 | |||||||||
| Dependent variable-DL, Independent variable: TS, Moderating variable-TRMD | |||||||||||
| TS | .642/6.959/.000 | 1.339 | |||||||||
| TRMD | .589/5.876/.000 | 1.421 | |||||||||
| Binary interaction effects | |||||||||||
| TS*TRMD | .553/6.252/.000 | 1.879 | |||||||||
| 2 R | .412 | .627 | |||||||||
| Adjusted R2 | .404 | .616 | |||||||||
| F-value | 48.430 | 57.121 | |||||||||
| Sig. | .000 | .000 | |||||||||
|---|---|---|---|---|---|---|---|---|---|---|---|
| Dependent variable-DL, Independent variable: PTSQ & TS, Moderating variable-TRMD | |||||||||||
| PTSQ | .354/2.873/.005 | 1.401 | |||||||||
| TS | .642/6.959/.000 | 1.225 | |||||||||
| TRMD | .739/9.115/.000 | 1.398 | |||||||||
| Binary interaction effects | |||||||||||
| PTSQ*TS | .312/3.981/.001 | 1.562 | |||||||||
| PTSQ*TRMD | .284/3.107/.003 | 1.671 | |||||||||
| TS*TRMD | .553/6.252/.000 | 1.879 | |||||||||
| Ternary interaction effects | |||||||||||
| PTSQ*TS*TRMD | .491/4.871/.001 | 1.273 | |||||||||
| 2 R | .412 | .476 | .664 | ||||||||
| Adjusted R2 | .404 | .461 | .649 | ||||||||
| F-value | 48.430 | 30.890 | 44.121 | ||||||||
| Sig. | .000 | .000 | .000 | ||||||||
a. Dependent variable: TS, DL b. Independent variable: PTSQ, TS c. Moderating variable: TRMD
Confirmatory factor analysis (CFA) was applied to assess the convergence, discriminant validity and dimensionality for each construct to determine whether all the 56 items (Table-3) measure the construct adequately as they had been assigned for. LISREL 9.90 programme was used to conduct the Structural Equation Modeling (SEM) and Maximum Likelihood Estimation (MLE) was applied to estimate the CFA models. A number of fitstatistics were obtained (Table-7) for the default (proposed) model. The comparative fit indices namely CFI (0.981), NFI (0.991) and TLI (0.973) were found significant enough to accept the fitness of the default (proposed) model (Schreiber et al, 2006). The Parsimonious fit indices (PNFI=0.697, PCFI=0.781, PGFI=0.713) also confirmed robustness of the model and indicated an absolute fit (Schreiber et al, 2006). The GFI (0.979) and AGFI (0.974) scores for all the constructs were found to be consistently >.900 indicating that a significant proportion of the variance in the sample variance covariance matrix is accounted for by the model and a good fit has been achieved (Hair et al, 1998; Baumgartner and Homburg, 1996; Hulland et. al, 1996; Kline, 1998; Holmes-Smith, 2002, Byrne, 2001). The CFI value (0.981) for all the constructs were obtained as > .900 which indicated an acceptable fit to the data (Bentler, 1992). The expected crossvalidation index was found to be small enough (ECVI=0.0026) to confirm the superiority of the default model to the saturated and independence model. The RMSEA value obtained (0.049) is < 0.08 for an adequate model fit (Hu and Bentler, 1999). The RMR value (0.003) is small enough (close to 0.00) to assure a robust-fit of the model. The 2006, Anglim, 2007). The probability value of Chi-square (χ2=176.16, df=89, p=0.000) is more than the conventional 0.05 level (P=0.02) indicating an absolute fit of the model to the data and the χ2/df value is ≤ 2 (1.97) suggesting its usefulness to justify the default model as the nested model.
| Absolute predictive fit | Comparative fit | Parsimonious fit | Others | |||||||||||
|---|---|---|---|---|---|---|---|---|---|---|---|---|---|---|
| 2 χ | Df | P | ECVI | NFI | TLI | CFI | PNFI | PCFI | PGFI | GFI | AGFI | RMR | SRMR | RMSEA |
| 176.16 | 89 | 0.02 | 0.0026 | 0.991 | 0.973 | 0.981 | 0.697 | 0.781 | 0.713 | 0.979 | 0.974 | 0.003 | 0.0302 | 0.049 |
Table-7: Fit indices for the default model
To construct the nomological network structural equation modeling (SEM) was used to test the nomological validity of the proposed research model. Composite PTSQ, TS, DL and CRMD scores across individual items were obtained by summating the ratings on the scale provided in the survey instrument items which were used as indicators of their latent version.
Structural Equation Modeling (SEM) was used to test the relationship among the constructs. All the 17 paths (including direct and indirect effects) and 3 paths (depicting moderating effects) drawn were found to be significant at both p<0.01 and p<0.05 levels. The research model holds well (Fig.2) as the fit-indices supported adequately the model fit to the data. The double-curved arrows indicated correlation between the exogenous and endogenous observed variables which was found significant. The residual variables (error variances) are indicated by Є1, Є2, Є3, etc. The regression weights are represented by λ. The relationship between the exogenous variables was represented by β. One of the factor loading was fixed to ‗1' to provide the latent factors an interpretable scale (Hox & Bechger). The direct and indirect effects of the constructs were calculated and tabulated in Table-8. Since there was an absence of indirect non-causal effect, model respecification was not required (Hair et al, 2010)
Table-8: Direct, indirect and total effects of independent variables on dependent variables
| Effects | ||||||||
|---|---|---|---|---|---|---|---|---|
| Relationship | Direct (causal) | Indirect (causal) | Indirect (non causal) | Total | ||||
| PTSQ TS | 0.96 | 0.96 | ||||||
| TS DL | 0.91 | 0.91 | ||||||
| PTSQ DL | 0.94 | 0.89 | ||||||
| PTSQ TS DL | 0.87 (0.96*0.91) | 0.87 | ||||||
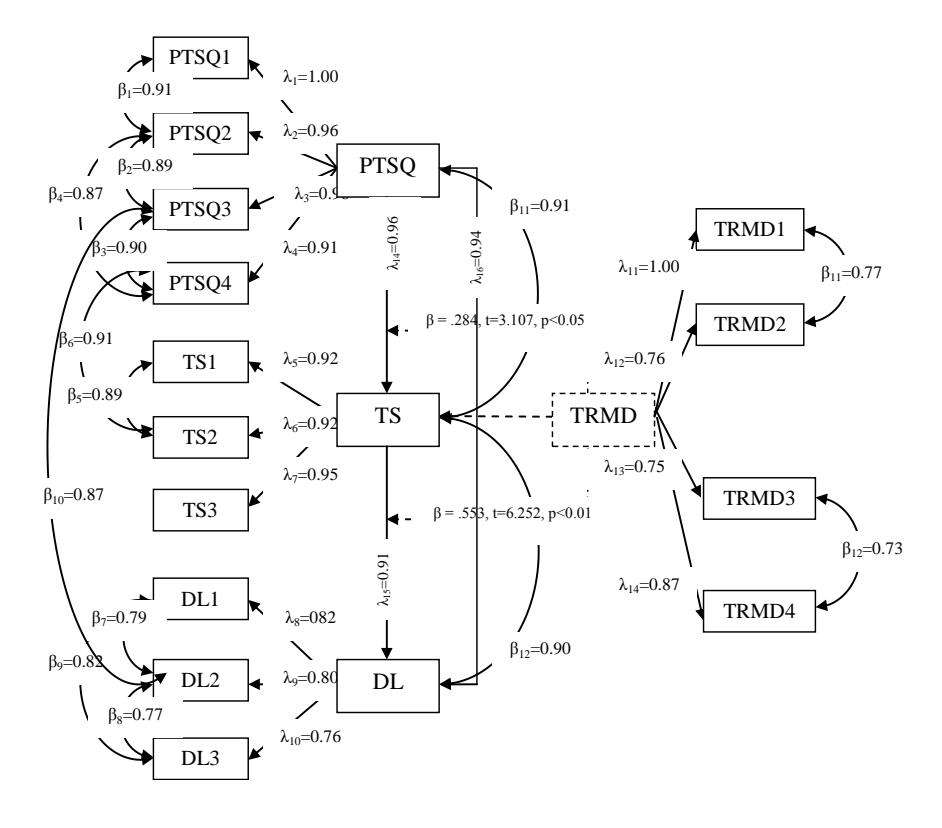
Fig.2: Structural model showing the path analysis indicates moderating effects
IMPLICATIONS FOR THEORIES AND PRACTICE
The present study shall expand the research domain pertaining to relationship management and its implications and shall add up to the extant literature by providing the foundation of tourism relationship management framework (TRM), an offshoot to customer relationship management model, with validated dimensions like destination denomination and purpose denomination. The intervening effects of TRM while linking perceived tourist service quality, tourist satisfaction and destination loyalty were also found to be significant. Further to this, the study reinforces the applicability and integration of TRM dimensions (Yim et al, 2004) with the functional and behavioural modalities of tourism industry. The moderating effects of TRM on PTSQ and TS, TS and DL and on the link PTSQ-TS-DL opens up new research frontiers whereby additional exploration to the dimensional impact of TRM on sectoral tourist behaviours can be analysed. Existing literature emphasized the role of tourist service quality towards influencing tourist satisfaction by using the conventional dimensions of SERVQUAL. The service quality dimensions identified in this study may be tested for its robustness, but it definitely provides researchers with scope to identify ethnicity, hospitality and servicescape as significant and critical quality dimensions for indigenous and aborigin tourism.
The tourism phenomenon in Santiniketan is not new, but it has changed its dynamics with the rapid change in demographic, psychographic, cultural and ethnic factors. With the communication system to the destination improving by leaps and bounds the influx of tourist has also increased. The increased flow of assorted tourist from both domestic and foreign origin forced a complete metamorphosis of the hospitality and tourism map of Santiniketan. The hotels, restaurants, tour-arrangers and other down-the-line service providers underwent a serious make-over as they updated themselves to meet the specific demand and quality perception of both domestic and foreign tourist. The tourism service providers in Santiniketan are well aware about the tourist behaviour based on the destination dynamics and purpose of their visit. Technology has played a pivotal role towards allowing the tourists to avail services on virtual platform. The results ensured that the tourism services provided by the hoteliers, restauranters, logistic -service providers, tour-arrangers etc. at Santiniketan were well absorbed by the tourist and they were satisfied. It was revealed that the perceived tourist service quality was instrumental in assuring tourist satisfaction which subsequently was found to have a positive effect on destination loyalty. The hospitality industry as a whole in Santiniketan was found acceptable by the tourists who were visiting on the occasion of cultural and ethnic events like Pous Mela, Basantotsav etc. in terms of service quality and they have expressed their intention of revisiting the destination and promoting the destination to other tourists.
The study had managerial implication as the changing rural psychogeodemographic pattern (multi-attribute stratification process also known as geoclustering leading to compressed segmentation models namely PRIZM-Potential Index Rating by Zip Markets) of Santiniketan may pose challenges to the managers of tourism service providers to analyse tourist demand and personalize tourism products accordingly. TRM framework is likely to provide tourism managers with analytics to segregate tourists on the basis of identified dimensions particularly the destination denomination and purpose denomination which will enable them to strategise their approach towards satisfying the tourists.
The study had geographical limitations as it has been restricted to Santiniketan in West Bengal, which in future, can be widened to obtain a more generalized conclusion. Future extrapolations of the study can be done by considering other service variables into consideration namely impact of servicescape, perceived service recovery etc.