
INTRODUCTION
Bali is one of the most popular tourist destinations in the world due to its cultural activities and natural scenery. Tourism has now become the leading economic sector in Bali. As Bali"s economy has been developed mostly through tourism, the focus of economic development in Bali province has changed from the primary sector (agriculture) to the tertiary sector (tourism). The contribution of the primary sector (agriculture) to the Gross Domestic Product (GDP) of Bali has decreased dramatically from 61.21% in 1969 to 16.84% in 2012, while the contribution of the tertiary sector (trade and tourism) has increased from 9.52% in 1969 to 30.66 % in 2012 (Bali Statistical Office, 2013). Meanwhile, the contribution of the secondary sector (handicraft and other industries) increased from 1.67% in 1969 to 9.97% in 2010 (Erawan, 1994 in Wiranatha, 2001; Bali Statistical Office, 2011).
1Lecturer at Doctoral Program in Tourism, Udayana University, Bali Indonesia.
* Corresponding author, email: gungdani@gmail.com
Tourism in Bali has been developed significantly as can be seen from the increasing number of visitors and tourism facilities. The number of direct arrivals of foreign tourists in Bali increased dramatically from 23,340 tourists in 1970 to 1,412,839 tourists in 2000. However, the terrorist attack on Bali on 12 October 2002 resulted in a decrease in the number of foreign tourist direct arrivals only 993.029 in 2003, although it then increased again in 2004. Furthermore, the second terrorist attack on Bali in 2005 led to an other decrease in foreign visitors in 2006 (see Figure 1). Efforts were undertaken by the government and the tourism industry to convince foreign tourists to visit Bali. Gradual increases have been reported in the following years and reach the highest fore ign tourist direct arrivals in 2012, about 2.892.019 tourists (Bali Government Tourism Office, 2013). During period 2007 to 2012 the average growth rate of direct foreign tourist arrivals to Bali was 14.7 % per year.
As a world tourism destination, Bali is supported by the availability of infrastructure, including an international airport which provides easy access to Bali, and main roads which provide access to various tourism facilities and tourism attractions within the region. According to Bali Government Tourism Office (2013), there were 2,212 accommodation establishments with a total of 46,025 rooms registered in Bali in 2012. These included 156 star-rated hotels (20,269 rooms), 1,031 Non star-rated hotels (21,114 rooms), and 1,025 homestays (4,642 rooms). Development of registered accommodations in Bali during period of 2002-2012 is shown in Figure 2. However, Bali Hotel and Restaurant Association (PHRI Bali) counted 3,346 accommodation establishments (62,407 rooms) in Bali in 2011, that consisted of 165 star-rated hotels (22,161 rooms), 1,371 Non star-rated hotels (28,585 rooms), 1,760 homestays (9,282 rooms), 15 condotels (1,793 rooms), and 35 rental houses (586 rooms). There could be more accommodation available in Bali than the above numbers as many more accommodations are unregistered or operate illegally.
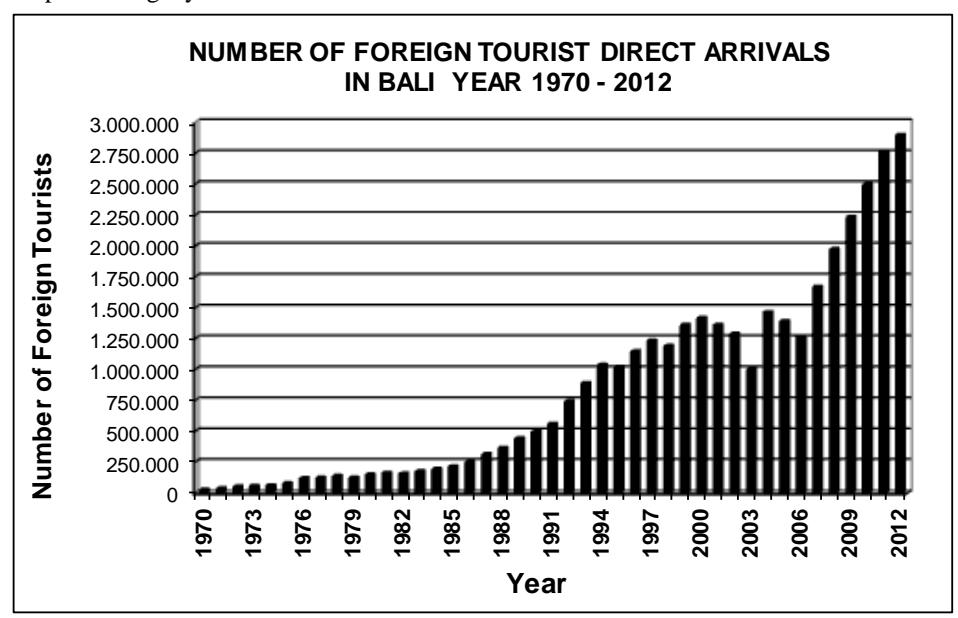
Figure 1. Number of Direct Arrivals of Foreign Tourists in Bali Year 1970 - 2012 (Source: Bali Tourism Government Office, 2013)
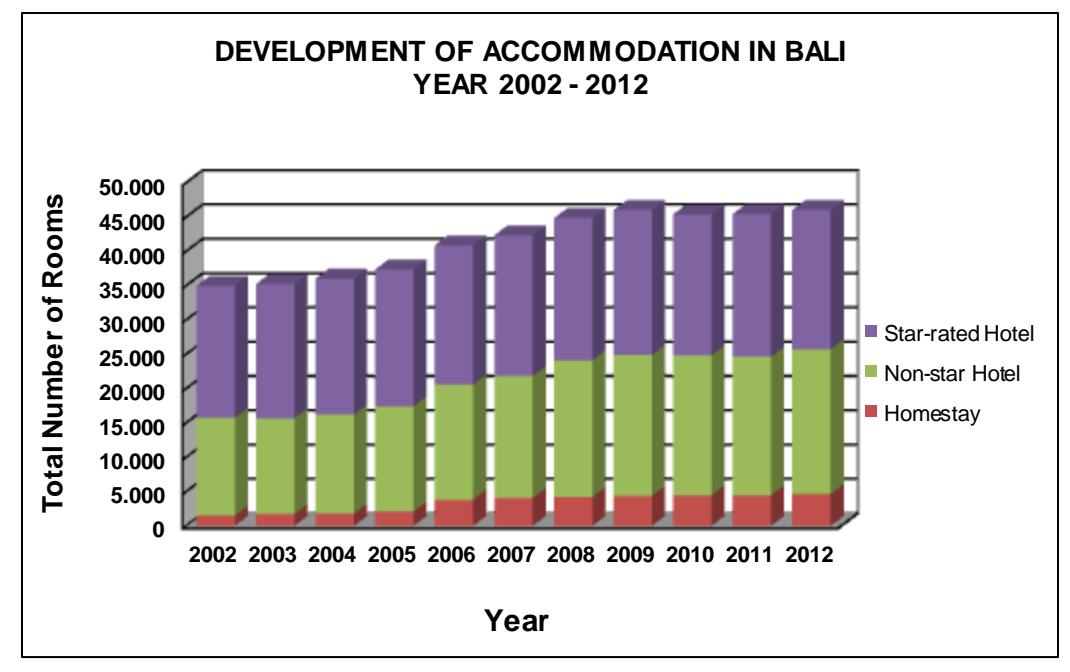
Figure 2. Number of Rooms Available in Bali in 2002 – 2012 (Source: Bali Tourism Government Office, 2013)
Global economic crisis in 2008 did not obviously have an effect on foreign tourists to Bali. It was proven by the number of foreign tourists to Bali, as outlined above, as well as the average their expenditures and length of stay. The average expenditure of foreign tourists per person per day increased from US$ 137.90 in 2009 to US$ 158.87 in 2011. The length of stay of foreign tourists also went up from 8.75 days in 2009 to 9.27 days in 2011 (Bali Government Tourism Office, 2012). Regarding the growth of number of foreign tourists to Bali, it seems that tourism in Bali will keep being promising as a source of household income for Balinese inhabitants, contribute to the national exchange rate as well as improve job opportunities.
Even though tourism brings about development for Bali"s economy for many years, however, the economic impacts of tourism development has not been convinced to be fully beneficial for Balinese community (Dewi, 2009; Dermawan in Wiranatha, 2001). There is a phenomenon that tourists" expenditures have not been totally become income of Bali"s economy because some portions of tourists" expenditures leak out the destination in the form of payment for imported products and services, payment of wages for foreign employees, and profits transfer to foreign owners. According to Lundberg, et al. (1991), leakage occurs when industry imports both consumption and resources from other countries to support the growth of industry. Bull (1991) added that in economic terms, leakage could be defined as losses from the national income flow which have been generated during the transition from the local/national consumption income cycle to the spending chain. Furthermore, Harrison (1992) pointed out that import can be seen to be a leakage that limits the positive impact of tourist"s expenditure on a destination. So that , there is a need to ascertain the current amount of leakage from tourism in Bali. Regarding the scope of tourism is relatively wide, this study focused on accommodation sector only, as most of foreign tourists" expenditures in Bali has been on accommodation. Therefore, the objective of this study is to calculate the amount of the tourism leakage from accommodation sector in Bali. The results of this research are expected to give a better understanding, awareness, and gaining positive responses from government and stakeholders in order to improve economic impacts of tourism on Balinese community. A study by Rodenburg (1980) is the only reference about import leakage from tourism in Bali. The import leakage was estimated to be about 40% for international standard hotels, and 20% for small economy standard hotels. The import leakage from international standard hotels was estimated from the Nusa Dua Project in 1977, but that from small economy standard hotels was assumed . There has not yet been any research about tourism leakage in the tourist accommodation sector that has used a combination analysis of micro (industrial) level and macro (regional) level. The focus of the analysis in this research was on the accommodation sector because the highest percentage of expenditure by foreign tourists in Bali is on accommodation, i.e. 40.5% (Bali Government Tourism Office, 2011).
LITERATURE REVIEW
Leakage in Tourism
Leakage has long been known as one of negative economic impacts of tourism (Bull, 1991; Hudman and Hawkins, 1989; Lundberg, et. al., 1991; and Mill and Morrison, 2009). Hudman and Hawkins (1989) define tourism leakage as: (i) import goods and services for consumption or investment in tourism; (ii) payments for foreign tour operators and agencies; (iii) payment to foreigners for management contract and royalties; (iv) profits which are paid to foreign stakeholders; (v) interest paid for external credits in the tourism sector; (vi) exchange costs for tourism investment; (vii) advertising in international marketing and promotion expenditures; (viii) commissions paid to foreign banks, credit cards and for agency used by tourists; (ix) savings of foreign employees; (x) education abroad and training costs of tourism employees; (xi) saving of employers, employees, and entrepreneurs; and (xii) taxes paid to government. The cause of imported products entering a destination is incapability of a destination in producing product which fulfill standard of product quality needed by foreign tourists. In addition, Unluonen, et. al. (2011) said that savings delayed the transformation of new economic values into investment. Moreover, they agreed that although taxes decreased the economic impact of new dollars, they could be spent later. Finally, they pointed out that when compared with savings and taxes, import inputs were the most important leakage items, because import includes expenditures that flow out from the local or national economy. Furthermore, Smith and Jenner (1992) stated that there is also another type of leakage called "invisible" leakage. The "invisible" leakage is the physical effects of tourism, including the depletion or destruction of a country"s infrastructure, natural habitats, environments and historical as well as cultural heritage that have a leakage effect on tourism receipts.
According to Meyer (2007), leakage tends to be highest when the local destination economy is weak and lack of the quantity and quality of inputs required by tourism industry. He said that a prevailing trend in many developing countries depends heavily on imports. Therefore, attempt had been made to reduce leakage by developing stronger links between tourism and other sectors in the local economy. He added that government policy needs to concentrate on strengthening the economic linkages between tourism and agriculture to support import substitution.
Minimizing Leakages for Optimizing Tourism Benefits
Mill and Morrison (2009) suggested some strategies in minimizing leakage, including: (i) reducing imported food, goods and materials, and encouraging the use of local products as import substitution; (ii) implementing incentive program to develop infrastruct ure by using traditional architecture concept and encouraging using local goods and materials; (iii) doing effective negotiation with multinational companies dealing with travel agencies and tour operators; and (iv) encouraging cultural tourism with the au thenticity of destinations so that tourist love local products. Furthermore, leakage impacts on multiplier effects (Hughes, 1994). Therefore, reducing leakage is crucially important to increase economic benefit of tourism in a destination because leakage will reduce the multiplier effects of tourism (Unluonen, et. al., 2011).
Dwyer and Forsyth (1994) said that tourism multiplier is a ratio measuring the triple effects of tourist spending on local economy. A higher multiplier suggests a greater impact of tourist expenditure on local economy. Bull (1991) observed tourism multipliers ranging from 2.5 (in Canada) to 0.8 (in the Bahamas). He has found that large diversified economies tend to have larger multipliers, while developing countries and small island states tend to have smaller multipliers because of considerable leakage. Furthermore, Kim and Jamal (2007) reported that tourism income multipliers were 1.96 (in Turkey) and 0.39 (in Western Samoa). They argued that tourism leakage weakens the tourism multiplier. Lundberg, et. al. (1991) supported these statements. He said that decreasing in multiplier leads to decreasing in tourism benefit in economic development. Moreover, a study by Lacher and Nepal (2010) also found that by using precise strategic based o n the authenticity of a destination, economic leakage can be reduced.
Mill and Morrison (2009) said that there are three categories of tourism benefits, namely: increasing income, increasing job opportunity, and increasing foreign exchange earnings. Tourist"s expenditures will become income for the destination economy. The income generated from tourism sector will stimulate the infrastructure development. Furthermore, tourism produces many job opportunities, direct and indirect employment. The amount of indirect employment depends upon the extent to which tourism is integrated with the rest of the local economy. The more integration and diversification occurs, the more indirect employment generated (Hughes, 1994). However, the larger hotel properties are mo re inclined to use imported labour especially for managerial position (Fridgen, 1996). Moreover, tourism is also a way to increase foreign exchange earnings to produce the investment necessary to finance growth in other economy sectors. Fridgen (1996) argu ed that there is a danger of overstating the foreign exchange earnings generated by tourism unless the important factor, such as leakage is known. The tourist"s expenditure that leaks from destination"s economy must be subtracted from foreign exchange earn ings in order to determine the true impact. According to Fridgen (1996) and Mill and Morrison (2009), foreign exchange earnings will be reduced as a result of of leakage. In other words, the extent to which a destination can minimize leakage will determine the size of the foreign exchange earnings.
RESEARCH METHOD
The research was undertaken during period of April-June 2013 at four main tourist destinations in Bali Province i.e. Kuta, Nusa Dua, Sanur and Ubud. Locations of this research were selected purposively with consideration that the above destinations are the main tourist destinations in Bali.
Sample Design
Probability Proportional to Size (PPS) sampling method proposed by Kish (1965: 234) and Yamane (1973) was applied in this research. Calculation of samples followed the equation below:
\[n = \frac{N}{N \cdot \alpha^2 + 1}\] where: \[n = sample \ size\] \[N = population\]
Three clusters of accommodation were chosen namely: (i) 1, 2 & 3 Star-rated hotel; (ii) 4 & 5 Star-rated hotels either chain hotel or non-chain hotel; and (iii) Non-star rated hotel. Population of these three types of hotel can be seen in Table 1. Using an error of 20% (α=0.2), total number of samples were 63 hotels (see Table 1). According to Sevilla et. al. (1993) maximum error can be tolerant for social science is about 20%.
Table 1 Sample Size
| No | Cluster | Population (N) | Sample Size (n) | Error (α) | Remarks |
|---|---|---|---|---|---|
| 1 | 1, 2 & 3 Star-rated hotels | 70 | 21 | 18% | - |
| 2 | 4 & 5 Star-rated hotels | 85 | 26 | 17% | 12 chain hotels 14 non-chain hotels |
| 3 | Non-star rated hotels | 1,563 | 32 | 18% | - |
| Total Sample | 1,718 | 79 | 18% | ||
Note: Population was the number of hotels in Bali in year 2011 (Bali in Figure 2011)
Data Analysis
α = error
Method for calculating tourism leakage was constructed based on the model developed by Unluonen, et. al. (2011), but it was modified to calculate tourism leakage on accommodation sector only. The operational equations are outlined as follow:
n \[L = \sum_{i=1}^{n} L_{i}\] \[(2)\] where:
L = total leakage
Li = the leakage items in a group i.
n = 3, where L1 is the import leakage group, L2 is the delayed leakage group, and L3 is the invisible leakage group.
(note: in this study, the delayed leakage (L2) and the invisible leakage (L3 ) were not calculated).
In this study, the delayed leakage (L2) and the invisible leakage (L3) are not calculated. Import leakage group (L1) is only leakage that is examined in this study, as follow:
\[V\] \[L1 = \sum L1k\] \[k = 1\] (3)
The number of import leakage items (v) was 8.
where:
- L11 = Total payments for the import of goods and services for consumption and investment made by accommodation sector.
- L12 = Total payments of earning transfers abroad, for licenses, technology transfers, royalties, patents, etc. in the accommodation sector.
- L13 = Total percentage payments to foreign banks for credit cards used by foreigners.
- L14 = Total savings of foreign employees in accommodation sector and the money they send abroad.
- L15 = Payments of credit interest provided from abroad
- L16 = Total payment abroad for training personnel needed by accommodation sector
- L17 = Payments for international marketing and promotion public sector
- L18 = Payments for international marketing and promotion by accommodation sector Assumptions of the model by Unluonen, et. al. (2011) are as follow:
- (i) All import goods and services that are tourist-related are used in the country of import,
- (ii) The saving tendency of expatriates is equal to the saving tendency of citizens,
- (iii) Regardless of why and by whom they are done, all marketing and promotion activities make some contribution to the tourism demand in the country,
- (iv) The demand generated from one unit of import input is equal for both tourists and residents
Description of Variables
Basically, variables in this study consist of imported products, foreign employee, foreign services, and income of the hotels. All of variables are outlined below:
- (i) Imported products were classified into imported foods, imported beverages, imported equipment (utensils) and other imported goods and materials related to design, furniture and decoration used in the hotel.
- (ii) Foreign employee was the number of foreigners who work in accommodation sectors as well as their wages and salaries (payment for foreign employees).
- (iii) Foreign services include any fees related to the operational of hotels undertaken in overseas, such as services abroad, and payments for foreign productions, overseas education and training costs of tourism employees.
Details of the variables related to cause of leakage that were used in this study are outlined in Table 2. All of the above imported products, foreign employees and foreign services were calculated in all types of accommodation, namely: (i) Non - star rated hotels; (ii) 1, 2 & 3 Star-rated hotels; (iii) 4 & 5 Star-rated non-chain hotels; and (iv) 4 & 5 Star-rated chain hotels.
Table 2 Indicators and Variables Related to Cause of Leakages
| No | Indicators | Variables (unit/year) | ||
|---|---|---|---|---|
| 1 | Imported foods | a. Imported meat (beef, chicken, pork, lamb). | ||
| b. Imported fisheries (fish, prawn, lobsters, octopus, and squid). | ||||
| c. Imported food favour | ||||
| 2 | Imported | a. Imported dairy products (fresh milk, yoghurt, juice). | ||
| beverages | b. Imported wine, beer and alcoholic drinks. | |||
| 3 | Imported fruits | a. Imported varieties of fruits | ||
| and vegetables | b. Imported varieties of vegetables | |||
| 4 | Imported utensils | a. Imported household utensils (stove, pan, frying pan, mixer, | ||
| No | Indicators | Variables (unit/year) | ||
|---|---|---|---|---|
| blender, cook, microwave) b. Imported plates, glass, cups, cutleries, and mugs. | ||||
| 5 | Imported goods and materials | a. Imported furniture (beds, tables, desks, chairs, shelves, wardrobes). b. Imported materials for building accessories. | ||
| 6 | Services abroad | a. Promotion and advertising Indirect Promotion and advertisement through Media Channels (Televisions, broadcasting) Direct promotion through visiting some countries. b. Public Relation, publicity payments, foreigner operational payments | ||
| 7 | Foreign payments for foreign productions. | a. Transfer payment for commission of travel agents and tour operators. b. Import payment. c. Government tax payment for imported goods and services. d. Exchange cost for tourism investment. e. Interest payment for external credits in the tourism sector. | ||
| 8 | Payment for foreign employees | a. Number of foreign employees b. Total payments for foreign employees c. Transfer payments for foreign employees | ||
| 9 | Saving of foreign employees | a. Amount of foreign saving | ||
| 10 | Education abroad and training costs of tourism employees | a. The number of overseas training staff b. Payment for overseas training staff | ||
Sources: Hudman and Hawkins (1989), Lacer and Nepal (2010), Mill and Morrison (2009), Unluonen, et. al. (2011), Zheng (2011).
Another variable was total revenue of the hotels. Total revenue of a hotel was calculated based on the formula as follow:
n
\[Y = \sum_{i=1}^{n} Y_{i}\]
\(i=1\)
\(Y = Y_{1} + Y_{2} + Y_{3} \dots (4)\)
where:
Y = Annual revenue of an hotel
Y1 = Revenue from rooms
Y2 = Revenue from selling foods and beverages
Y3 = Revenue from others (laundry, spa, telephone, internet, business centre, etc.)
Revenue from rooms = Room night sold x Room rate (Rupiah/day)
Room night sold = Average occupancy rate (%) x number of rooms x number of days in a year
Therefore, the percentage of tourism leakage of one hotel can be calculated as the total amount of imported products and services divided by total revenue of the hotel, as equation below.
Percentage of leakage = Total Leakage x 100% . . . . . . . . (5) Total Revenue
Limitation of The Model
Limitation of model in this study is that delayed leakage and invisible leakage were excluded from this study due to difficulties on obtaining data related to delayed leakage (taxes, and savings of entrepreneurs and employees) and calculating the invisible leakage (physical negative impacts of tourism, destruction of a country"s infrastructure, natural habitats, environments and historical as well as cultural heritage). Another limitation of calculating leakage in this study is that saving of foreign employees and the money they send abroad could not be obtained in this study. So that, the above variables were excluded from the model. Even though these variables were not included in the model, it was not significantly affect the result (the percentage of tourism leakage), as all of wages/salaries of foreign employees were already included in the hotels" expenditure. It was real situation that the sampling hotels had never known about savings of foreign employees as this kind of data was really confidential and impolite to be asked.
RESULTS AND DISCUSSIONS
Sources of Tourism Leakage
In general, the sources of leakage in accommodation sector were as follow:
- (i) Imported foods: all imported foods that were used in hotels to serve their guests.
- (ii) Imported beverages: all imported beverages that were used in hotels to serve their guests.
- (iii) Imported of fruits and vegetables: all imported fruits and vegetables that were used in hotels to serve their guests.
- (iv) Imported utensils and equipment: all imported utensils and equipment that were used in hotels.
- (v) Overseas marketing and education: all overseas activities that were undertaken by hotel"s personnel to improve the ability of staffs and/or to improve the performance of hotels. These activities include promotion and other marketing activities as well as training for staffs and hotel management that was done in overseas.
- (vi) Profit transfer for foreign owners: profit which was transferred to owners in overseas.
- (vii) Payment for foreign employees.
- (viii)Payment for booking fees that was paid to overseas travel agents.
- (ix) Payment for online fees that was paid for online agent in overseas.
- (x) Management fees: payment for the international chain hotel management system.
The Sequence of the Sources of Tourism Leakage
Based on the survey undertaken on 79 hotels, the sequence of the sources of leakage were as follow:
(i) Overall, imported beverages were the first source of leakage in all types of hotels. Meanwhile, profit transfer for foreign owners was also the main source of leakage in 4 & 5 Star-rated chain hotels. This was the second source of leakage after imported
- beverages. In 4 & 5 Star-rated chain hotels, management fees paid to international chain management were the third source of leakage.
- (ii) Imported foods and payment for online fees also played a crucial role as the sources of leakage in mostly all type of hotels. In 4 & 5 Star-rated chain and non-chain hotels, the payment for foreign employees was also a significant source of leakage.
- (iii) Imported fruit and vegetables were also as source of leakage especially for all Starrated hotels.
- (iv) Lastly, imported utensils and payment for booking fee stated in the last rank of the source of leakage.
More detail on the sequence of leakage"s sources in each type of hotels is shown in Table 3.
Table 3 The Sequence of the Sources of Tourism Leakage in the Sampling Hotels
| Type of Hotels | Sequence of the Sources of Leakage | |||||||||
|---|---|---|---|---|---|---|---|---|---|---|
| 1 | 2 | 3 | 4 | 5 | 6 | 7 | 8 | 9 | 10 | |
| 1,2 & 3 Star-rated hotels | b | a | i | C | E | h | d | - | - | - |
| 4 & 5 Star-rated hotels -chain hotels | b b | f a | a i | e c | j e | i g | g d | c h | d - | h - |
| Non-star rated hotels | b | i | a | H | - | - | - | - | - | - |
Remarks:
- a : Imported foods
- b : Imported beverages
- c : Imported fruits and vegetables
- d : Imported utensils and equipment
- e : Payment for overseas marketing or training
- f : Profit transfer for foreign owners
- g : Payment for foreign employees
- h : Payment for booking fees
- i : Payment for online fees
- j : Payment for international chain hotel management fees
Calculation of Revenue and Leakage of the Sampling Hotels Tourism leakage of a hotel
Tourism leakage of a hotel can be calculated as below:
\[L = L1 + L2 + L3 + L4 \dots + L9 \dots (6)\] where:
- L = Annual tourism leakage of an hotel
- L1 = Payment for imported foods
- L2 = Payment for imported beverages
- L3 = Payment for imported fruits and vegetables
- L4 = Payment for imported utensils and equipment
- L5 = Payment for overseas marketing or training
L6 = Payment for foreign employees
L7 = Payment for booking fees
L8 = Payment for online fees
L9 = Payment for management fees
Based on the sources of tourism leakage, an example of calculation for annual leakage of a sampling hotel is as follow:
Type of hotel : 4 & 5 Star-rated chain hotel
Code of sampling hotel : 3
Calculation of the annual leakage of this hotel included:
| (i) Payment for imported foods (L1) | = Rph 12,582,810,648 |
|---|---|
| (ii) Payment for imported beverages (L2) | = Rph 120,610,800,000 |
| (iii) | = Rph |
| Payment for imported fruits and vegetables (L3) | 112,512,000 |
| (iv) | = Rph |
| Payment for imported utensils and equipment (L4) | 104,800,000 |
| (v) | = Rph |
| Payment for overseas marketing or training (L5) | 3,000,000,000 |
| (vi) | = Rph |
| Payment for foreign employees (L6) | 1,500,000,000 |
| (vii) | = Rph |
| Payment for booking fees (L7) | 530,904,290 |
| (viii)Payment for online fees (L8) | = Rph 5,990,672,705 |
| (ix) | = Rph |
| Payment for management fees (L9) | 6,112,931,332 |
| The annual leakage of this hotel was Y1+ Y2 … + Y9 | = Rph 150,545,430,975 |
Revenue of a hotel
Based on the sources of revenue, an example of calculation for annual revenue of a sampling hotel is as follow:
Type of hotel : 4 & 5 Star-rated chain hotel
Code of sampling hotel : 3
Calculation of the annual revenue of this hotel included:
| (i) | Revenue from rooms (Y1) | = Rph 213,952,596,624 |
|---|---|---|
| (ii) | Revenue from selling foods and beverages (Y2) | = Rph 76,411,641,651 |
| (iii) | Revenue from others: laundry, spa, etc. (Y3) | = Rph 15,282,328,330 |
| The annual revenue of this hotel was Y1+ Y2 + Y3 | = Rph 305,646,566,605 |
Percentage of Tourism Leakage of a Hotel
Based on the calculation of revenue and leakage outlined above, the percentage of tourism leakage of the sampling hotel was:
Percentage of Leakage = Total Leakage x 100%
                       Total Revenue
                = Rph 150,545,430,975 x 100%
                       Rph 305,646,566,605
                = 49.25 %
Tourism Leakage of All Sampling Hotels
Furthermore, the amount of tourism leakage of all sampling hotels for each type of accommodation is presented in Table 4. As can be seen from Table 4, the h ighest amount
Tourism Leakage of The Accommodation Sector in Bali
of tourism leakage on all types of accommodations was imported beverages. The amount of imported beverages was about 65% of total leakage of Non-star rated hotels; about 45% of 1,2&3 Star-rated hotels; about 70% of 4&5 Star-rated non-chain hotels; and about 64% of 4&5 Star-rated chain hotels. Meanwhile, imported foods were also important source of leakage on all types of accommodations. Among all types of accommodation, the highest imported foods were occurred on 1,2&3 star-rated hotels (about 24% of total leakage). Management fee was one source of leakage in 4&5 Star-rated hotels as this type of accommodation managed by international chain hotel management. It was about 4% of the total leakage of 4&5 Star-rated hotels. In addition, profit transfer was also occurred at 4&5 Star-rated hotels, as one of the sampling hotels owned by foreigner. The profit transfer was about 0,1% of total leakage of 4&5 Star-rated hotels.
Table 4 The Amount of Leakage of All Sampling Hotels for Each Type of Accommodation in Bali in Year 2012
| Non-Star rated | 1,2&3 Star-rated | 4&5 Star-rated | 4&5 Star-rated | ||||||
|---|---|---|---|---|---|---|---|---|---|
| Source of | Hotels | Hotels | Non-Chain | Chain Hotels | |||||
| No | Import | (Rupiah) | (Rupiah) | Hotels | (Rupiah) | ||||
| (Rupiah) | |||||||||
| 1 | Foods | 213.933.002.18 | |||||||
| 85.902.675.005 | 37.469.160.987 | 77.521.698.402 | 4 | ||||||
| (12.6%) | (23.7%) | (6.3%) | (20.5%) | ||||||
| 2 | Beverages | 667.635.480.00 | |||||||
| 449.259.159.786 | 70.822.831.218 | 863.174.734.286 | 0 | ||||||
| (65.7%) | (44.8%) | (69.8%) | (64.1%) | ||||||
| 3 | Fruits and | 6.821.380.980 | 6.531.464.288 | 1.735.344.000 | |||||
| Vegetables | - | (4.3%) | (0.5%) | (0.2%) | |||||
| 4 | Good, Utensils, | ||||||||
| Equipment, | 11.294.569.374 | 4.000.702.429 | 1.376.700.000 | ||||||
| Materials | - | (7.2%) | (0.3%) | (0.1%) | |||||
| 5 | Marketing and | 8.820.000.000 | 108.938.461.538 | 49.800.000.000 | |||||
| Staff Training | - | (5.6%) | (8.8%) | (4.8%) | |||||
| 7 | Payments for | ||||||||
| Foreign | 87.600.000.000 | 21.984.000.000 | |||||||
| Employees | - | - | (7.1%) | (2.1%) | |||||
| 10 | Online fees | 147.996.492.159 | 22.686.927.806 | 89.115.720.828 | 37.104.023.687 | ||||
| (21.7%) | (14.4%) | (7.2%) | (3.6%) | ||||||
| 11 | Booking Fees | 6.370.851.474 | |||||||
| - | - | - | (0.6%) | ||||||
| 12 | Management | 40.828.660.693 | |||||||
| Fees | - | - | - | (3.9%) | |||||
| 13 | Profit Transfer | 604.457.301 | |||||||
| - | - | - | (0,1%) | ||||||
| Total Leakage | 1.236.882.781.77 | 1.041.372.519.3 | |||||||
| 683.158.326.950 | 157.914.870.365 | 1 | 39 | ||||||
| (100%) | (100%) | (100%) | (100%) | ||||||
| Total Revenue of | 7.778.374.966.3 | 1.318.129.502.48 | 5.448.951.999.20 | 2.041.433.034.6 | |||||
| Hotels | 75 | 1 | 7 | 66 | |||||
| Percentage of | 8.8% | 12.0% | 22.7% | 51.0% | |||||
| Leakage | |||||||||
| Average Leakage | 18.8% | ||||||||
The results show that the highest percentage of tourism leakage from the accommodation sector in Bali was on the 4,5 Star-rated chain hotels (51.0 %). It was followed by the 4,5 Star-rated non-chain hotels (22.7 %), and 1,2,3 Star-rated hotels (12.0 %). Meanwhile, the lowest leakage was on the Non star-rated hotels (8.8%), see Figure 3. The average tourism leakage of all types of accommodations in year 2012 was 18.8%. These results indicate that: (i) the higher the level of hotel classification, the more leakage will be; and (ii) the accommodations which are managed by international chain hotel systems and/or owned by foreigners have more leakage than other type of accommodations. The more leakage, therefore the less revenue from tourism will be directly received by hotel and undirectly by the local community as tourism is the main source of economic development of Bali Province.
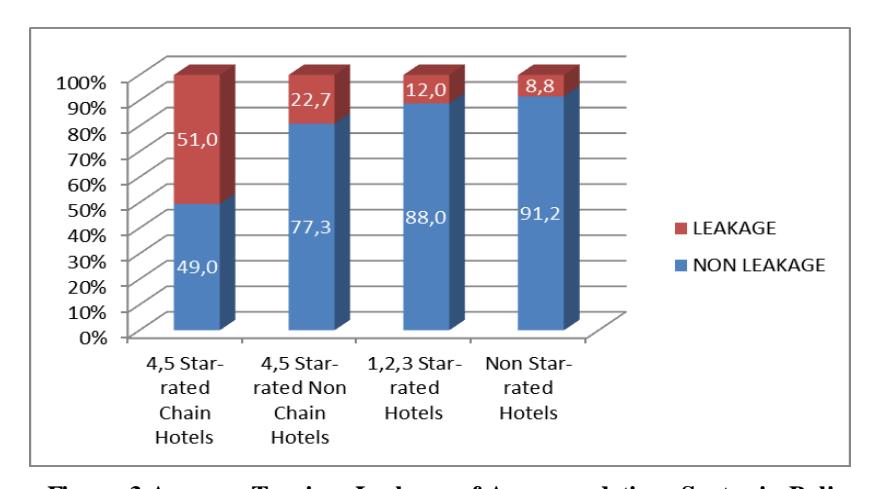
Figure 3 Average Tourism Leakage of Accommodation Sector in Bali
There is a need to minimize tourism leakage from accommodation sector particularly in the 4,5 Star-rated chain and non-chain hotels by reducing the use of imported products and services. One opportunity in reducing imported products is to provide substitute products for imported products. Another opportunity in reducing leakage is to minimize the number of foreign employees hired in the star-rated hotels by local employees. However, quality of products and human resources are crucial to be addressed in order to minimize tourism leakage.
Reducing tourism leakage means giving more opportunity for local products to be consumed by tourists, and providing more job opportunities for local people. In other words, less leakage means more benefits for local people from tourism. It will bring implications to the improvement of quality of life of the community, maintaining quality of environment, and better quality experiences for tourists.
CONCLUSION
Calculation of tourism leakage on accommodation sector in Bali shows that the highest percentage of tourism leakage on accommodation sector was on the 4&5 Star-rated chain hotels (51.0 %), followed by the 4,5 Star-rated non-chain hotels (22.7 %), and 1,2&3
Star-rated hotels (12.0 %). The lowest tourism leakage was on the Non-star rated hotels (8.8 %). Overall, the average tourism leakage on accommodation sector in Bali was 18.8 %. These results indicate that the higher the level of hotel classifications, the more leakage will be; and accommodation which was managed by international chain hotel system and/or owned by foreigner had more leakage than other types of accommodation. The more leakage, therefore the less revenue from tourism will be directly received by hotel and undirectly by the local community as tourism is the main source of economic development of Bali Province.
The main sources of tourism leakage from accommodation sector were imported food and beverages, payment for booking fees, overseas marketing and staff training, payment for foreign employees, and management fees. Payment for profit transfe r for the ownership of the accommodation was also been found as a source of tourism leakage on 4&5 Star-rated chain hotels. Tourism leakage from accommodation sector needs to be minimized. Implication of successful in minimizing leakage is gaining better quality of life for local community in destination.
SUGGESTIONS
A further research could be undertaken to include all factors that are used in the calculation of tourism leakage as mentioned in the model of Unluonen, et. al. (2011) in order to obtain more accurate results. Moreover, it is suggested to develop a holistic strategy to reduce tourism leakage from accommodation sector. For future development of accommodation sector in Bali, priority should be given to accommodations which are owned and/or managed by local and national company in order to minimize the leakage and to maximize the benefits for local community.