
INTRODUCTION
Tourism consists of various economic activities, and plays a big role in regional economic development. However, it also easily influenced by external factors such as natural disaster, terrorism, viral epidemics, changes in the economic environment, etc. Especially, when a large-scale disaster far beyond imagination occurs, it will cause not only enormous damage to the surrounding area, but also a serious impact to the tourism sector over a wide area because of harmful rumors and the growing mood of self-restraint which results in plummeting tourist numbers. In addition, disaster measures in local governments so far are mostly focused on damage mitigation, emergency response plan and recovery functions of public facilities etc., but not economic recovery. It is due, in part, to that they never estimated the economic damage. To contribute to sustainable tourism development and formulation of disaster prevention plans, the factors that affect tourism activities need to be explored and the economic damage to the tourism sector estimated and reflected in disaster measures.
Some of Recent studies have shown the analysis of tourism damage by natural disaster. For example, Karatani (2007)1 summarized the damage and recovery process of tourism sector based on hearing survey in the disaster area of southern Thailand where was suffered by the Indian Ocean Tsunami in 2004; Muranaka (2012) 2 proposed the possible reconstruction of tourism sector of Iwaki City after the Great East Japan Earthquake 2011 based on field survey. Most of these studies have reported and discussed the damage and recovery of tourism sector based on their surveys, however few of them have conducted the estimation of tourism damage.
* Corresponding author, email: Mingji@fc.ritsumei.ac.jp
<sup>1</sup> Institute of Disaster Mitigation for Urban Cultural Heritage, Ritsumeikan University
<sup>2</sup> National Research Institute for Earth Science and Disaster Prevention
<sup>3</sup> College of Policy Science, Ritsumeikan University
Kyoto city which is the subject area of this study, is an ancient city located in the central part of the island of Honsyu, Japan. It was Japan's capital for over one thousand years, and there remains lots of cultural heritage, such as UNESCO world heritage sites, and more than 2,000 shrines and temples 3. As a result, Kyoto attracts annually about 50 million tourists from Japan and overseas 4. However, in the past 50 years, the tourism sector in Kyoto has suffered from natural disasters twice, and had obvious impacts on the local economy. One is the disaster of the Great Hanshin-Awaji Earthquake in 1995 and the other is the Great East Japan Earthquake in 2011, both of which brought serious damage to Japan. In the present study, focusing on the two disaster cases of Kyoto City, we estimate the amount of economic damage to the tourism sector, which consists of direct damage from decreasing tourism activities and indirect damage from influences to the regional economy caused by decreases in tourism consumption, as estimated by the input-output analysis. Then from the analysis of the decreasing tourists and estimation of the results, we considered factors which impacted tourism activities and the regional economy.
RESEARCH METHOD Defining Tourism Damage
Tourism damage is capable of classifying into stock damage and flow loss as shown in Figure 1. The stock damage can be divided into three types: the tourism resources damage that include culture assets, natural landscape and hot spring etc.; the tourism infrastructure damage that includes road, facilities, lifelines etc. in the tourism area; and the private tourism facilities damage that includes accommodation, restaurants, souvenir shop etc. The flow loss can be classified into direct and indirect damage: the direct damage is defined as the decreasing of tourism income according to reduction of visitor number after a disaster; and the indirect damage is defined as the negative spillover effects to the local economy caused by decreasing tourism consumption.
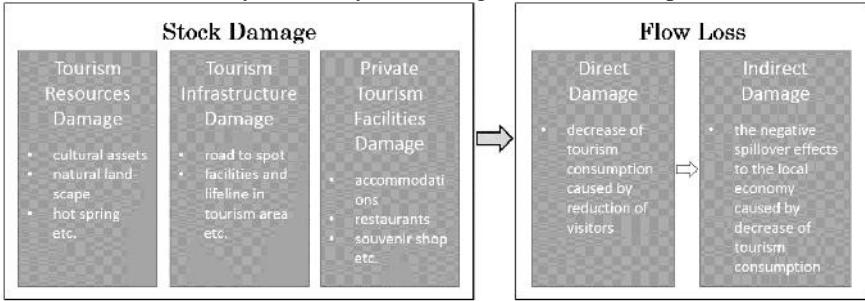
Figure1. Classification of Tourism Damage
The stock damage is the physical damage that occurs simultaneously with disasters. In general, the restoration cost of stock can be estimated, and the aggregate amount of recovery costs calculated to clarify the amount of stock damage. The flow loss is the aggregate amount of economic losses from the time the disaster occurs to when the economic indicators recover to normal level.
Extracting Two Cases of Tourism Damage
The Kyoto Tourism Office created the Tourist Annual Survey 5 in 1948 and it has run since then. Figure 2 below indicates the changes in the number of tourists in Kyoto, as determined by the data reported from the tourist survey. The changes of tourists number can be divided into three periods: the first phase is the first growth period that shows the rapid growth of up to 1976; the second phase is a long-term period that shows a plateau over 23 years from 1977 to 2000; and the last phase is the second growth period from 2001, according to the practice of "Kyoto City Tourism Promotion: Easy-to-Visit Plan 21" which was formulated in 2001.
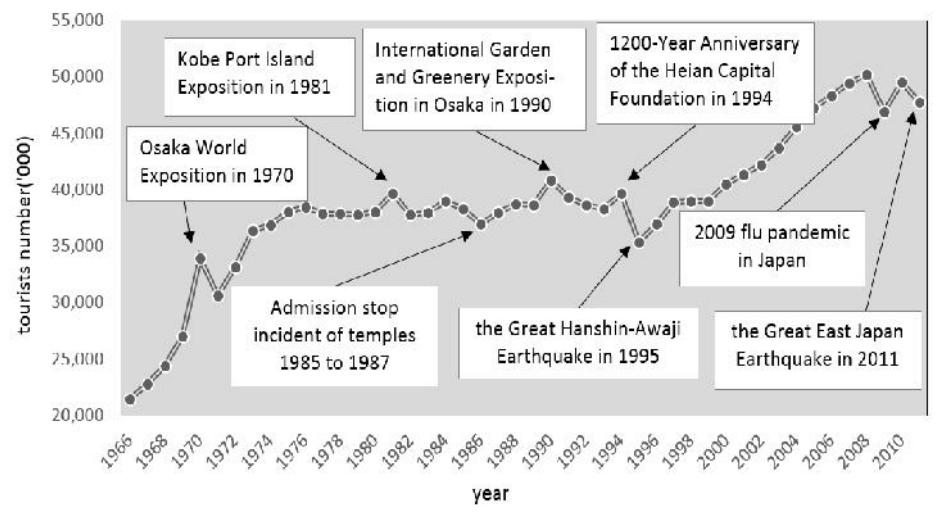
Figure2. The Transition of Tourists Number of Kyoto City
However, there are some significant movements that show abrupt increases or decreases in each place: the increasing changes are due to holding large-scale events to attract customers in the Kansai area, such as Osaka World Exposition in 1970, Kobe Port Island Exposition in 1981, International Garden and Greenery Exposition in Osaka in 1990 and the 1200-Year Anniversary of the Heian Capital Foundation in 1994; the decreasing changes are caused by some damage such as stopping admission to temples from 1985 to 1987, the Great Hanshin-Awaji Earthquake in 1995, the 2009 flu pandemic in Japan and the Great East Japan Earthquake in 2011.
In the present study, we focus on the two cases of tourist decreasing caused by disasters, which are the 1995 Great Hanshin-Awaji Earthquake and the 2011 Great East Japan Earthquake, and consider the factors that affect the tourism sector and estimate the amount of economic damage.
Case1. The Great Hanshin-Awaji Earthquake in 1995:
The Great Hanshin-Awaji Earthquake with the magnitude 7.2 occurred on January 17th, 1995, at 5:46 JST. The epicenter, located in the northern part of Awaji Island, was at a 16km-depth. The observed intensity in Kyoto was 5. According to the Fire and Disaster Management Agency, 9 houses were damaged (3 buildings completely and 6 buildings partly destroyed), and one fire occurred that caused 2 buildings to burn in the Kyoto Prefecture. Moreover, in Kyoto City, except for an apartment fire (1 room burned down), some damage such as falling or displacement of roof tiles, cracks or peeling of the wall etc., there was no tourism stock damage6. Though the stock damage was insignificant, the tourists' arrivals were decreased obviously and it took about two years to recover. The location of the Great Hanshin Awaji Earthquake is presented in Figure 3.
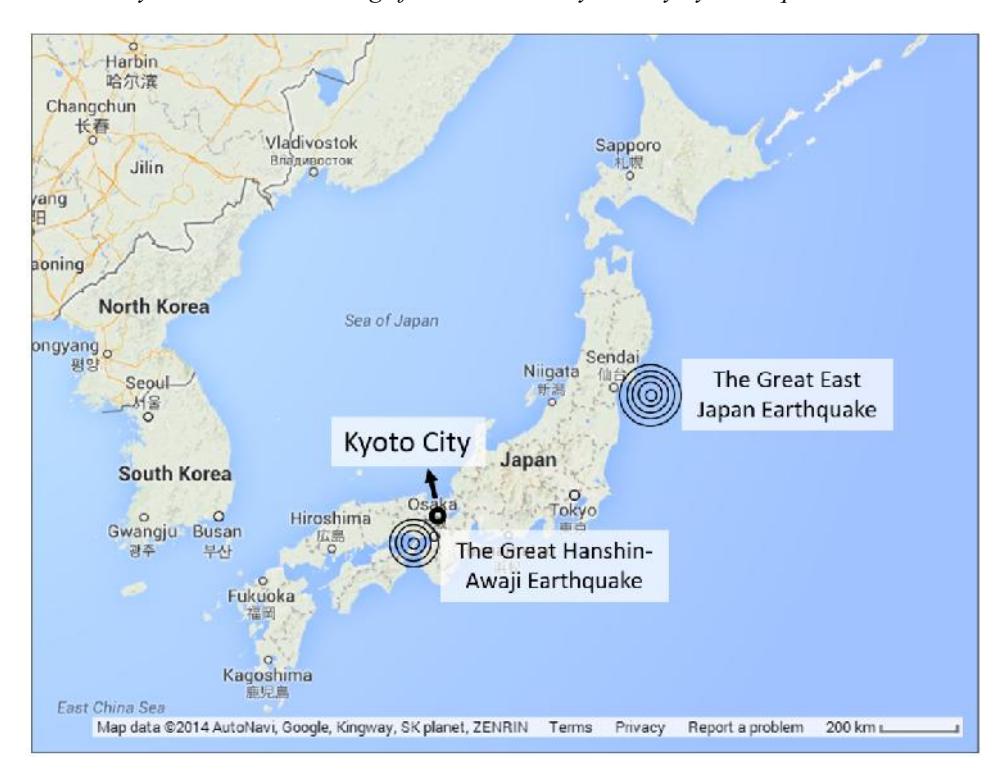
Figure 3. Locations of Kyoto City and Seismic Centers of the Two Earthquakes
Case2. The Great East Japan Earthquake in 2011:
The Great East Japan Earthquake occurred on March 11th, 2011, at 14:46 JST. The magnitude was 9.0, and the epicenter was near the Sanriku Offshore of northeast of Japan. The highest intensity observed in the Miyagi Prefecture was 7, and the intensity observed in Kyoto was 3 7. It was a large-scale and complex earthquake disaster with a tsunami, and also with the subsequent accident of the Fukushima No.1 Nuclear Power Plant. Though Kyoto was far from the disaster area, and there was no stock damage, the tourist number dropped due to the earthquake disaster. The location of the Great East Japan Earthquake is shown in Figure3.
Defining the Reference Values of Non-Disaster Cases
Because the stock damage was insignificant in the both cases, in the present study, we intend to clarify only the impact to the local economy caused by flow loss of tourism sector based on the decreasing of tourist numbers.
Moreover, estimation of damage amount would be leaded different or incorrect results, if there is no defining reference value of non-disaster cases and the time of recovery. In order to estimate the tourism damage, reference indicators need to be established. Thus, we defined the tourist number of the previous year of the disaster as the indicator of non disaster, based on the transition of tourists in Figure 2. To prevent overestimation of the damage amount, we eliminated the year that held tourist-attracting events. Hence, in case 1, the year 1993 was set to reference time because the 1200-Year Anniversary of the Heian Capital Foundation was held in 1994; in case 2, the year 2010 was defined as the reference time.
Furthermore, the recovery time was defined to that when tourist number increased to the reference level of non-disaster. In case 1, it took 2 years to recover; however, in case 2, the year of recovery could not be established because the data after 2011 has not been reported yet. Hence, we only estimated the damage that occurred in 2011 in case 2.
Estimation Methods and Data
The tourism sector relates to various kinds of industries, such as accommodation, food services, retail services, agriculture, and manufacturing industries, which supply the materials to these service sectors. Therefore, damage of tourism sector would affect other industries and it may have significant impact on the regional economy.
In the present study, tourist consumption is classified into city transportation expenses, accommodation expenses, food expenses, souvenir expenses and others based on Tourist Annual Survey. All of the decreasing amounts of these expenses are defined as the direct flow loss and it is estimated the amount based on using the data of Tourist Annual Survey.
Moreover, estimation of negative spillover effects which is the indirect flow loss of tourism sector is conducted to clarify the influence to the regional economy using input output analysis. We used the input-output table 8) of the Kyoto Prefecture, which published every 5 years. We used the data of 1995 for case 1 and 2005 for case 2 to estimate that the decreasing of tourists in Kyoto City affects the economy of the Kyoto Prefecture.
RESULTS
The Direct Flow Loss
As shown in the previous chapter, the direct flow loss is defined as the decreasing of tourism income according to the reduction of visitor number after a disaster. The damage amount can be estimated by clarifying tourists' consumption reduction.
Therefore, the direct flow loss can be expressed as follows:
\[C_i = \alpha_i \times N_i \tag{1}\]
\[\Delta C = \sum_{i=y} (C_R - C_i)\] (2)
α : Consumption per capita
N : Tourist number of i year
C : Tourists' consumption of i year
C : Tourists' c onsumption of reference year
y: The year damage occurred
∆C: The direct flow loss (Decreasing of Tourists' c onsumption)
In the above formulas, (1) is the general formula of tourism consumption equation and (2) represents the tourism consumption decrease due to reduction of the number of tourists (the direct flow loss). However, in case 2, we use the data of consumption per capita 2010 both to the year 2010 and 2011, since the 2011 data has not been published.
The Indirect Flow Loss
In order to classify the tourism consumption into the sectors of input-output table, we used the consumption per capita in each category that was reported in the Tourist Annual Survey. The consumption amounts in each category can be calculated from each kind of consumption per capita and tourist number. The consumption amounts can be collaborated to the sectors of input-output table that shown in Table 1. In addition, we classified the souvenir based on the tourist souvenirs purchase from above survey.
The local tourism consumption amount that is equal to the amount of tourism demand can be expressed as follows:
\[\Delta C = \Delta D \tag{3}\]
∆D: Demand amount of tourism sector
Table 1. Classifying the Tourism Consumption into Sectors of input-output table
| Tourist Consumption Classification | Detcrease of Tourism Total | Detcrease of Tourism Demand Total | ||||||
|---|---|---|---|---|---|---|---|---|
| Sector Classification of Input-Output Table | ||||||||
| Day-Tripper | Overnight- Visitor | Day-Tripper | Overnight -Visitor | |||||
| City Transportation Expenses | Transportation | 11,996 | 6,852 | 5,143 | 11,996 | 6,852 | 5,143 | |
| Accommodation Expenses | Services for Individuals | 9,526 | 0 | 9,526 | 9,526 | 0 | 9,526 | |
| Food Expenses | Services for Individuals | 16,141 | 10,275 | 5,866 | 16,141 | 10,275 | 5,866 | |
| Others | Services for Individuals | 12,459 | 9,617 | 2,841 | 12,459 | 9,517 | 2,841 | |
| Sourvenir Expenses | Confection eries | Food and Beverage | 6,857 | 2,200 | 4,657 | 3,385 | 1,086 | 2,299 |
| Favor | Food and Beverage | 2,252 | 723 | 1,529 | ||||
| Buddhist Altar Fittings | Other Manufacturing Industrial Product | 76 | 24 | 52 | ||||
| Postcard | Pulp, Paper and Wood Products | 102 | 33 | 69 | ||||
| Arts and Crafts | Other Manufacturing Industrial Product | 320 | 103 | 217 | ||||
| Kiyomizu Pottery | Ceramic, Stone and Clay Products | 291 | 91 | 200 | ||||
| Ohers | Other Manufacturing Industrial Product | 192 | 62 | 131 | ||||
| Wallet and Bag | Other Manufacturing Industrial Product | 105 | 34 | 72 | ||||
| Nishijin- Brocade | Textile Product | 65 | 21 | 44 | ||||
| Ohers | Textile Product | 65 | 21 | 44 | ||||
Moreover, since the demand amount of tourism sector includes part of transferred goods from outside the region and imported goods from abroad, we determined the local production of tourism demand amount using the transfer and import rate of the region. The primary spillover effects can be estimated by multiplying local demand amount to production inducement coefficient of the input-output table. It can be expressed as follows:
\[\Delta P_1 = \{I - (I - M) \times A\}^{-1} \times (I - M) \times \Delta D \tag{4}\]
∆Ρ1 : Primary spillover effects
M: Transfer and import coefficient (A column vector of n -tuple)
n: Sectors number of input-output table
Ι: Unit matrix (n×n)
Furthermore, the second spillover effects estimation is conducted. The employee income decreased by primary spillover effects and it affects consumption expenditure that becomes final demand. The part of reduced demand also relates to the decreasing of regional production and it becomes the second negative spillover effect to the local economy. It can be expressed by formula (5):
\[\Delta P_2 = \Delta P_1 \times \ell \times c \times \{I - (I - M)A\}^{-1}(I - M)\] (5)
∆Ρ2 : Second spillover effects
ℓ: Employee income rate
c: Consumption conversion rate (percentage of employee income)
Thus, the amount of indirect flow loss is expressed as formula (6) :
\[\Delta P = \Delta P_1 + \Delta P_2 \tag{6}\]
The total amount of flow loss is
Total Amount of Flow Loss= \[C+P\] (7)
Results of Estimation
According to the above steps of calculations, we estimated the damage amounts of flow loss. The results are presented in table 2. In case 1, the decreasing amount of tourist consumption (the direct flow loss) is 85535 million yen (including 56979 million yen in 1995 and 28557 million yen in 1996), and the damage affected to local economy (the indirect flow loss) is 72833 million yen (51624 million yen in 1995 and 21209 million yen in 1996). The total damage amount of flow is estimated as 158368 million yen. In case 2, it is estimated 41954 million yen as the direct flow loss, and 31488 million yen as indirect flow loss. The total amount of flow loss of case 2 is 73442 million yen. Although it is about half the amount of case 1, it is also the large damage as the tourist city is far away from the disaster area.
Table 2 Results of Estimation ('000,000 Yen)
| The Direct Damage of Flow Loss | The Indirect Damage of Flow Loss | Total | ||
|---|---|---|---|---|
| 1995 | 56,979 | 51,624 | 108,603 | |
| Casel | 1996 | 28,557 | 21,209 | 49,766 |
| Subtotal | 85,535 | 72,833 | 158,368 | |
| Case2 | 2011 | 41,954 | 31,488 | 73,442 |
DISCUSSIONS
In the two cases of tourism damages in Kyoto, although stock damage was minimal or there wasn't any stock damage, the amounts of flow loss were still large, and they brought large economic damage to local economy.
The tourism sector is easily influenced by the direct and indirect factors such as harmful rumor and the growing mood of self-restraint. Moreover, different disasters cause different levels of damage. The factors such as tourists' behavior and decreasing of number, etc. which influenced the activities of tourists need to be clarified to contribute to the policy implementation of recovery and future disaster prevention plans of tourism areas.
We considered the changes of tourist arrivals and consumption behaviors based on the data from Tourist Annual Survey of Kyoto City to examine what factors affect the tourism sector and local economy after an earthquake disaster.
Clarifying Tourism Behaviors based on Tourist Annual Survey of Kyoto City
"Tourist Annual Survey of Kyoto City" which is published from Tourism Office of Kyoto City, is including the number of tourists, consumption activities and amount, satisfaction of tourists, etc. The influence factors to tourism sectors can be clarified according to consider the transition of these data in the disaster periods.
Table 3 shows the number of tourists by travel type of day-tripper and overnight-visitor in each case, and the cells with background color indicate a decrease in number of tourists. In case 1, there are significant reductions in day-tripper tourists rather than overnight, while reduction of overnight-visitors shows more obviously than day-trippers in case 2. It can be predicted that in case 1, lots of visitors from near the area of Kansai region were decreased, because most of them suffered damage from disaster and could not go out to travel. Then in case 2, though it was far away from the disaster area, shows a decrease in the number of tourists, especially in overnight-visitors. It can be predicted that the visitors from distant places were reduced because of consumption restraint of Kanto and northeast area after disaster.
Table 3. Decrease of Tourists of Day-Trippers and Overnight-Visitors ('000)
| Case1 | Case2 | |||||
|---|---|---|---|---|---|---|
| 1993 (Refference value) | 1995 | 1996 | 2010 (Refference value) | 2011 | ||
| T 4 1 | 38,288 | 35,343 | 36,986 | 49,555 | 47,800 | |
| Total | -2,945 | -1,302 | - | -1,755 | ||
| Day Walanaa | 29,516 | 27,111 | 28,090 | 36,455 | 36,934 | |
| Day-Tripper | × | -2,405 | -1,426 | - | 479 | |
| O | 8,772 | 8,232 | 8,896 | 13,100 | 10,866 | |
| Overnight-Vistor | × | -540 | 124 | - | -2,234 | |
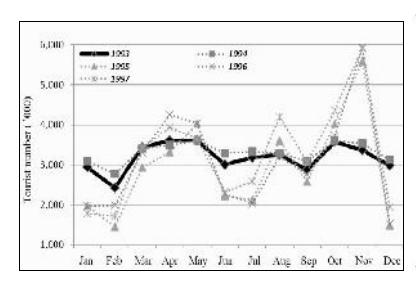
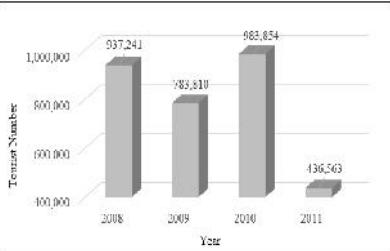
Figure 4. Monthly Transition of Tourist Number in the Case1
Figure 5. The Number of Foreign Hotel Gussets in the Case2
Figure 4 shows the monthly transition of tourist number in case 1.Both in 1995 and 1996, although annual number of visitors decreased, the graph shows higher number of visitors than the reference value in the tourist seasons that are from March to May, August and October to November. It can be predicted there would be some special events for attracting tourists in the tourist seasons. According to the tourists recovered in the tourist season, it can be inferred that the infrastructure, such as traffic system to Kyoto, did not suffer damage.
Figure5 shows the number of foreign hotel guests in recent years. The decrease in 2009 is due to flu pandemic in Japan. According to the graph, the number of tourists in 2011 is 436563, which is 55.6% less than the reference year 2010. The graph can thus be used to infer that the foreign tourist number in Kyoto was influenced by harmful rumors of Fukushima nuclear accidents.
Summary of the Two Cases
Case 1: The Great Hanshin-Awaji Earthquake in 1995
In the case of Great Hanshin-Awaji Earthquake, although stock damage was minimal, the reduction in tourists was large; it took about two years to return to the level before the earthquake. However, it was found that the network traffic and tourism-related infrastructure and facilities are functioning according to the recovery in the number of tourists in the peak seasons and even performed higher than the reference year before the earthquake.
Moreover, the day-trippers decreased significantly over two years, while the overnight visitors recovered in the following year due to relatively decreasing by only a small amount. It can be inferred that the decrease in tourism consumer confidence and consumption capacity in the disaster area caused the reduction of tourists, who would be the main day-trippers to Kyoto before the earthquake.
In this case, the damage amount of influence to region economy is estimated at about 158 billion yen in two years. The number of tourists and tourist consumption recovered two years after the earthquake.
Case 2: The Great East Japan Earthquake in 2011
In the case of the Great East Japan Earthquake, although far away the disaster areas, Kyoto City affected economic damage due to the decrease of tourists. As opposed to the case of Hanshin-Awaji Earthquake, it shows the significant decrease in accommodation arrivals, while there is no reduction of day-trippers. It can be inferred that a wide area of Japan suffered impacts from indirect factors such as consumption suppression and selfrestrained moods after a large-scale disaster.
In addition, the foreign accommodation arrivals reduced about 56%. It can be inferred that the decrease of foreign tourists is caused by the harmful rumor of Fukushima nuclear accidents and the damage to the image of tourist destinations. Regarding the long distance between Kyoto and the affected areas of the Fukushima nuclear accident, without effects of radiation, the business of accommodation facilities in Kyoto are seriously impacted by decrease of foreign guests. It is reconfirmed that continually transmitting the correct disaster information abroad is important in preventing damage from harmful rumors.
The amount of damage to the regional economy is estimated at about 73 billion yen in 2011. It can be understood that the non-ocular factors such as harmful rumors and selfrestrained moods after the disaster brought large impacts to the regional economy, causing damage over the wide area as well as the disaster area.
CONCLUSION
In the present study, we extracted two cases of tourism damage caused by the earthquake disasters from the tourist transition of Kyoto City in the past fifty years: one is the Great Hanshin-Awaji Earthquake in 1995, and the other is the Great East Japan Earthquake in 2011. It was conducted considering the features of tourists decreasing and consumption reduction, and estimated the economic damage amount of the two cases using the input output analysis.
The major findings of this study are shown below:
- 1) The tourist number recovered over two years in the case of the Great Hanshin-Awaji Earthquake, and the total amount of economic damage is estimated at 158 billion yen, with 85 billion for direct damage to tourism activities, and 73 billion for indirect damage to regional economy. In the case of the Great East Japan Earthquake, the total amount of economic damage is estimated at 64 billion yen, 37 billion for direct damage and 27 billion for indirect damage.
- 2) In the case of the Great Hanshin-Awaji Earthquake, Kyoto was 80 km away from the epicenter and there was no damage of stock such as cultural heritages and tourism facilities. However, it is confirmed that lots of tourists from neighboring disaster areas were reduced, because the tourists themselves suffered disaster.
- 3) In the case of the Great East Japan Earthquake, although Kyoto is far away from the disaster areas, there was a decrease in the number of tourists, especially a 56% plummet in foreign visitors compared to the previous year. It can be inferred that the tourist number in Kyoto was influenced by the harmful rumors of Fukushima nuclear accidents and the growing mood of self-restraint after the large-scale disaster, and these factors have impacted on the tourist consumption activities.