
1. INTRODUCTION
The increase in regional the income of Pacitan Regency from the service sector in the past 4 years allowed to increase tourism potential. The government's plan to create a superior tourism zone is an important study so that tourism growth is on target and has a sustainable impact, both for the economy, social, and environmental sustainability. Pacitan Regency has a tourist destination characterized by nature and the relationship between humans and nature. These characters consist of 3 forms: geo-diversity (a unique diversity of earth structures, such as caves and various forms of rock), biodiversity (biodiversity, such as plants, animals, and natural panorama beauty), and culture-diversity (cultural diversity, such as village tours and art shows). Along with the significant growth of tourism trends in Pacitan, it is very important to conduct an appropriate management and development plan.
Ecotourism development is one of the right answers in order to answer the character of tourism needs in the future based on their potential. Conceptually, ecotourism is defined as the concept of sustainable tourism development that aims to support efforts to preserve local nature and culture, and increase community participation in management, thus providing great economic benefits. Ecotourism also acts as a form of independent protection with social and economic needs (Wang, et al., 2014; Klak, 2017; Diamantis,1999).
Correspondence:
Email: ritaparmawati1990@gmail.com
Regional Planning Agency of Pacitan, Indonesia
3 Ecology and Animal Diversity Laboratory, Departement of Biology, Brawijaya of University, Malang, Indonesia
Ecotourism activities are currently becoming an interesting trend carried out by tourists to enjoy different forms of tourism. So far, ecotourism development is not inferior to conventional tourism which has long been introduced. In a case of opening ecotourism in Redang Island, Malaysia, 938 jobs directly emerged with various criteria, both directly and indirectly affected (Yacob, et al., 2007). In fact, since 1994, ecotourism has created a huge economic impact in the world. Approximately 12-25 billion USD is spent by international visitors to countries that are building ecotourism. In the 1990s, ecotourism experienced a steady increase throughout ecological awareness and sustainable tourism development (Khan & Hawkins, 1977). In 2005, the travel and tourism sector were estimated to create 6201.49 billion USD from world economic activity, or reach 10.6% of GDP. It is also estimated that there were 22,159,000 jobs or 8.3 % of the world jobs in 2005 and created 12% of world exports. In 2015, it was suspected that tourism would increase the contribution of economic income by 10678.5 billion USD (WTTC, 2008). Although many positive values are offered in the concept of ecotourism, this model still leaves criticism and problems with the implementation. Some criticisms of the concept of ecotourism include environmental damage, low participation, and mismanagement (Buckley, 2009; Mirsanjari, 2012; Koens, et al., 2009; Theingthae, 2017).
It is very important also for stakeholders to understand the suitable approach before building an eco-tourism concept and framework. Therefore, we assess Pacitan Regency needs an active approach in identifying potential, problems, and management strategies in the future. The purpose of this study is to identify the potential, problems, carrying capacity and constraints of ecotourism development, as well as develop management strategies in Pacitan Regency.
2. MATERIAL AND METHOD
2.1 Data Collection
Observations and interviews were conducted to reveal information related to the research objectives. The interviews were carried out on the owners/managers of tourist objects, the village government, the village community, and the Pacitan Regency Culture and Tourism Office. Samples are taken by snowball sampling technique. The sample size is limited by the level of saturation of the respondent's answer. The snowball sampling technique is carried out with key informants, namely with the community selected purposively or considered to have more knowledge of the ecotourism conditions in the area. There were 25 informants used in this study, ranging from village officials, community leaders, and the community.
The results of interviews and direct observations are classified as primary research data. The target of primary data extraction: potential tourist attraction, tourism supporting elements, community perceptions and expectations, ecotourism demand conditions, ecotourism supply conditions, and promotion of ecotourism. In addition, researchers also collected secondary data to support the interpretation of the findings, which focused on: the physical condition of the area, social conditions, and tourist objects in the buffer zone.
2.2 Analysis
We do indexing on the components of ecotourism management that we have designed. The Analytical Hierarchy Process (AHP) is carried out to weigh these components. Parameters used are 1) variable development and ecotourism management, 2) variable carrying capacity for ecotourism development and 3) variable support for development and management of ecotourism, consisting of the parameters of carrying capacity. In the AHP method, it is necessary to input key informants. This is needed to formulate practical policy and policy recommendations.
In order to gain weight on each of the variables of development and management of ecotourism, the following steps are taken:
- 1) Comparison matrix at level 1
- A. This step is conducted on variable at level 1
- B. Normalization of columns for each row of matrices.
\[BN = \sum (SXi / \sum SXi)/n\]
Where: Sxi: score variable X, BN: normal weight, n: number of variables.
- C. Calculating Consistency Index (CI) from the assessment of experts Where: mak = SXi . BN
- D. Calculating Consistency Ratio (CR) from the assessment of experts Where, RI: random index is seen in the table. Conditions:
- If CR ≤ 0.10, then it is accepted.
- If CR> 0.10, then it is rejected.
- 1) Comparison Matrix at level 2.
The steps are the same as step 1 but use the second level variable. The result is CR from level
- 2) Summing up the consistency of the hierarchy as a whole.
- 3) Conclusions
2.3 SWOT Analysis
SWOT analysis is used to determine and map the potential and problems of management and development of ecotourism. Strengths, Weaknesses, Opportunities, and Threats. Internal factors are strengths and weaknesses, and external are opportunities and threats. The SWOT is produced by 1) determining the aspects of management and development, 2) creating a SWOT matrix, 3) identifying each aspect into the matrix, 4) determining the weighting score for each factor, 5) determining the plot of management and development positions, 6 ) determination of the strategy, 7) preparation of plot positions in the quadrant.
3. RESULT AND DISCUSSION
3.1 General Conditions of the Economic Study Area
The level of economic activity in an area can be measured from the indicator of Gross Regional Domestic Income (GRDP). GRDP reflects the size of the production of the economic sector or the level of public consumption as measured by the amount of gross value added produced by units of economic activity operating in an area within a certain period of time. Therefore, the results of GRDP can also, describe the ability of a region or region to manage
natural resources and other production factors. GRDP is presented in two ways: first, GRDP at current prices apply to see real-time economic conditions, and second, GRDP on the basis of constant prices that are useful for viewing trends or comparing GRDP values between years. The development of GRDP on the basis of the current price shows that in the last five years (figure 1), the amount has increased very largely, namely from Rp. 8,477,649.5 million (2012) to Rp. 12,766,618,7 million (2016). Increase in 2012-2016, amounting to Rp. 4,288,969.2 million or 50.59 % (average 12.65% / year). The biggest contributors are Agriculture, Forestry, and Fisheries Business Fields reaching Rp. 2,569,127.1 million or 30.30 % (2012) and decreased to Rp. 3,800,379.6 million or 29.77 % (2016). The decline is likely caused by the data is not being recorded. This argument is based on the contribution in 2013-2015 which always rose, 30.31 %, 30.53 %, and 30.45 %. The second-largest is the Large and Retail Trade Business Field; Car and Motorcycle Repair Rp. 1,350,420.6 million or 15.93 % (2012) and rose to Rp. 1,866,552.9 million or 16.54 % (2016). Third, the Construction Business Field is Rp. 1,250,720.6 million or 14.75 % (2012) and rose to Rp. 1,941,039.1 million or 15.20 % (2016).
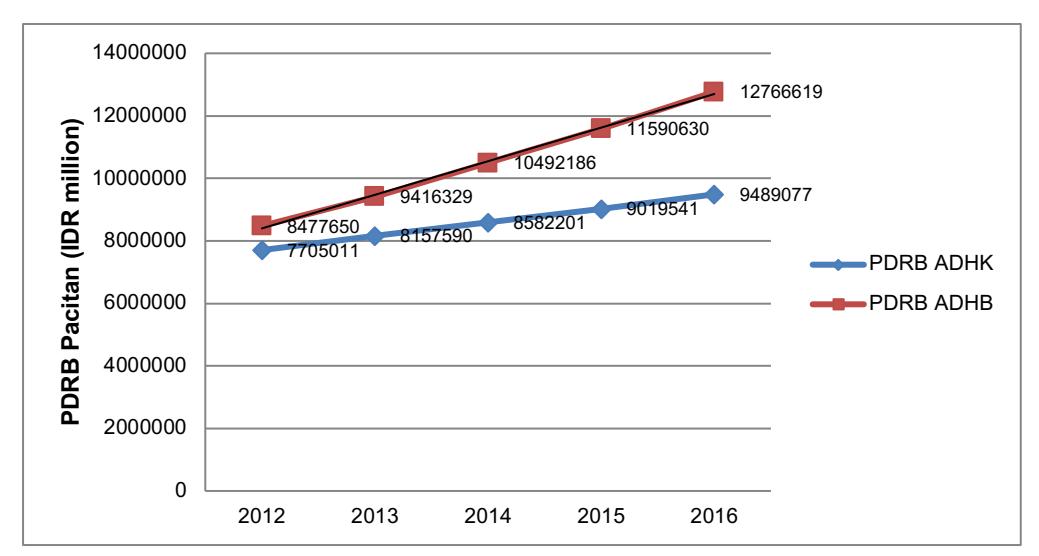
Figure 1. GRDP at Prices (IDR million) Source: Analysis Result, 2016
The amount of GRDP at current prices has a large difference. This shows that there is an indication of the influence of a large price. Its development shows that the number has always increased considerably over the past five years. In 2012 it reached Rp. 7,705,010.60 million, then in 2016 it rose to Rp. 9,489,077.00 million. Even though in 2016 the number was very temporary because there was some data that had not yet entered but the number had shown an increase. However, this amount can show an increase from the previous year, 2015. The increase during 2012-2016 was also quite large at Rp. 1,784,066.4 million or 23.15 %, with an average of 5.79 % per year. The biggest contributors are Agriculture, Forestry and Fisheries Business Fields reaching Rp. 2,250,553.30 million or 29.21 % (2012) and decreased to Rp. 2,566,546.40 million or 27.05 % (2016). The decline occurs in real because the amount/value is in constant price so it is not affected by price changes. Even seen from the development from year to year shows a decrease that is 29.21 %, 28.32 %, 27.88 %, 27.55 %, and 27.05 %. The second-largest is the Field of Services, the Field of Business for Wholesale and Retail Trade; Car and Motorcycle Repair Rp. 1,258,353.40 million or 16.33 % (2012) and rose to Rp. 1,649,679.80 million or 17.39 % (2016). Third, the Construction Business Field is Rp. 1,104,189.00 million or 14.33 % (2012) and rose to Rp. 1,369,671.00 million or 14.43 % (2016). In fact, the service sector, including tourism, experienced a rapid increase.
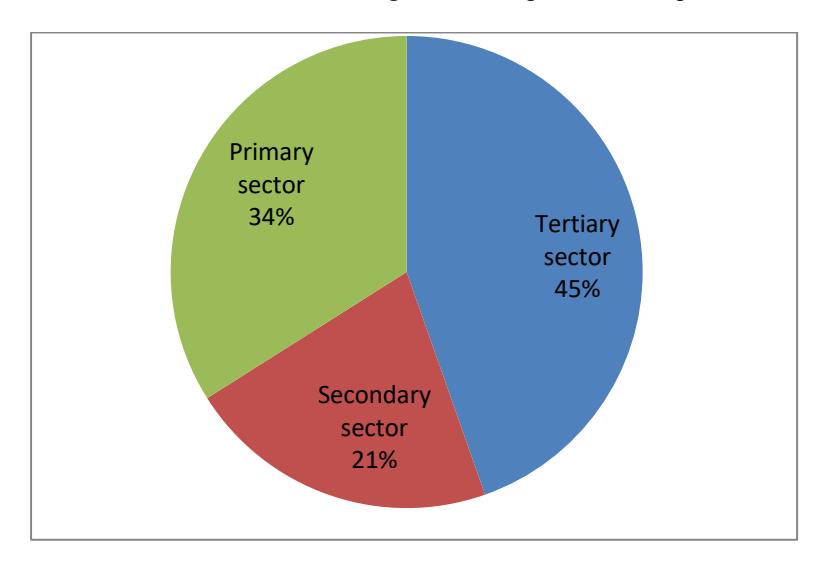
Figure 2. The Average of GRDP Contribution on Sector Groups Source: Analysis Result, 2016
Table 1. The Economic Structure of Pacitan Regency
| Primer | Secondary | Tertiary |
|---|---|---|
| Agriculture, Forestry, and Fisheries | Processing Industry | Wholesale and retail trade, car repair, and motorbikes |
| Mining and excavation | Electricity and Gas Procurement | Transportation and warehousing |
| Water Supply, Waste Management, Waste and Recycling | Provision of accommodation and eating drinks | |
| Construction | Information and communication Financial services and insurance Real estate Company services Government administration, defense and mandatory social security Education services Health services and social activities |
Source: Analysis Result, 2016
The next important economic indicator is the trend of regional economic growth. This condition is seen from the total GRDP growth and each business field in the GRDP. This indicator is used to see the economic growth and trends of a region in the future, both the growth rate and the trends in the sectors. Sectoral and aggregate GRDP values (total GRDP)
are the production values produced by the economic sector or business fields in each year. This value describes the economic production capacity of each business field and all sectors (total GRDP). On the other hand, it is necessary to look at the economic performance in a simple way, the level of sectoral contribution and its growth which illustrates the development of a more relevant performance than only limited to its capacity. Sectoral contributions describe the structure of the regional economy. Its contribution shows the components that make up the economic activities of an area or consist of what activities this economy is composed of. The economic structure is grouped into three sector groups; primary, secondary and tertiary (Table 1).
Based on the contribution during the five years, the average contribution was as obtained following:
a. Primary Sector: 34.03%. b. Secondary Sector: 21.42% c. Tertiary Sector: 44.54%.
Of the total GRDP shows that the economy of Pacitan Regency is characterized by the economy of the Tertiary Sector (figure 2). This can be seen from the magnitude of the sector's GRDP of Rp. 4,338,322.30 million (2016), then in the Primary Sector sequentially amounting to Rp. 3,125,681.80 million and the smallest Secondary The sector is Rp. 2,025,072.90 million. This condition will make it difficult to draw visual logic justifications in the Pacitan Regency.
In terms of accessibility, this area is classified as difficult, so mobility from other regions and towards the regions is hampered. This will cause tertiary sector activities that require high interaction will be increasingly hampered. This is very unique where the regional characteristics of the Pacitan Regency and their economic activities visually and regional programs show agrarian characteristics. We found the fact that the tertiary sector dominated by services had the biggest contribution. This is evidence that the creative economy has experienced support from the community. These facts also show that tourism has the opportunity to be built quickly.
Sequentially the sectoral growth rates during 2012 - 2016 are as follows:
- a. First, the tertiary Sector is 6.90 %.
- b. Second, the secondary Sector is 5.21 %.
- c. Third, the primary Sector is 3.45 %.
The growth rate between the three-sector groups shows a quite different growth pattern. The primary sector group has the longest growth rate between tertiary and secondary sectors between 2 - 3%. Tourism, which is an economic driver in the service sector, is very likely to develop into potential priorities that arise in the tertiary sector. This shows that the primary sector is becoming obsolete. Pacitan people have a more creative economy.
3.2 Conditions of Pacitan Tourism and The Problems
We observed 4 leading tourist sites in Pacitan: Pantai Taman, Mangrove Park Area, Goa Gong, and Goa Tabuhan (table 2). Holistically, we draw conclusions from perceptions based on the main information presented by respondents through non-structural interviews.
In general, the conditions of each location positively support the development of tourism. Ticket prices are mostly managed by the community and the local government has a low price. This is one of the attractions for the arrival of local tourists from around the location. Entry rates are one of the factors of economic sustainability as a tourist attraction. Affordable tariffs can attract tourists (Sayidov & Adomaitiene, 2016). However, the tariff is also used as a selection tool for visitors. Selective tariffs are used to protect natural damage from too many visitors. Tariff competition is a fundamental component and occurs in almost all tourist areas. Broadly speaking, this is accepted when the tariff setting decision has the purpose of protecting the area and providing benefits. However, tariff setting considers several data that describe the potential and limits of tourist spendings, such as airport taxes, national energy prices, fuel prices, and hotel rates around tourist areas (Dwyer, et al., 2000).
Cheap entry rates, as happened in Pacitan tourist locations, must be re-adjusted for the existence of facilities and the interests of nature conservation and the benefits of the manager. The conditions of these tourist sites are also felt to have sufficient cleanliness and are supported by social factors that are friendly and support tourism. Most visitors have a preference for tourist locations that have natural and cultural nuances.
On the topic of accessibility, there is a gap in each tourist location. Some of these locations are not easy to access, especially by potential tourists who are not Pacitan residents. However, some others have been equipped with clear directions and locations. Accessibility factors are very important for a tourist location. The strength of promotion and ease of access are contributing to the level of prospective tourist preference. Accessibility is obtained from road quality, information boards, and information access, both online and through pamphlets, pocketbooks, maps, etc. (Tomic & Bozil, 2015; Lai & Vinh, 2013; Govers, et al., 2007).
However, in general, respondents stated that supporting facilities at tourist sites were not adequate. This illustrates that the attention of the government or the management is still low. Most of them are not equipped with toilets, access roads, signposts, information, rest locations, or prayer rooms.
This section contains the results of the analysis and interpretation or discussion of the results of the analysis. Describe a structured, detailed, complete and concise explanation, so that the reader can follow the flow of analysis and think of researchers (Khan & Hawkins, 1977). Part of the results study should be integrated with the results of the analysis and the results and discussion is not separated.
3.3 The Main Tourism Sites
Pantai Taman is a tourist spot in Hadiwarno Village, Nagadirojo District. Park Beach infrastructure is better, equipped with directions and paved roads. Park Beach is being developed by the local government. Some Gazebo, Musholla, and toilets are built. Communities and managers work together to clean the location independently once a week. Park Beach is incidentally also the location of nesting Green Turtles (Chelonia mydas). Conservation locations are in coastal tourism areas and are managed independently. It is also an interesting object for visitors.
Table 2. Tourist Perceptions of Destination Visited
| Notes | |||
|---|---|---|---|
| Perception | Number | Age (%) | |
| Ticket Price | |||
| - Cheap | 8 | 100 | |
| - Expensive | - | - | |
| Preferred Tourist Site | |||
| - Nature | 2 | 25 | |
| - Culture | 1 | 12,5 | |
| - Nature and Culture | 5 | 62,5 | |
| Condition of Tourist Site | |||
| - Good and clean | 7 | 87,5 | |
| - Bad and Dirty | 1 | 12,5 | |
| The Kindness of Society | |||
| - Kind | 8 | 100 | |
| - Unkind | - | - | |
| The Accessibility | |||
| - Reachable | 4 | 50 | |
| - Hard to Reach | 4 | 50 | |
| Ecotourism Object Facilities and | |||
| Infrastructure | |||
| - Adequate | 2 | 25 | |
| - Inadequate | 6 | 75 | |
| Tourist Security | |||
| - Secure | 8 | 100 | |
| - Unsecure | - | - | |
| The Desire to Buy | |||
| - Yes | 5 | 62,5 | |
| - No | 3 | 37,5 | |
Mangrove Conservation is an additional location that requires 15 minutes drive from Taman Beach, with a worse road (narrow and unpaved), so that only one car can be passed. Directions and locations are also not found. The mangrove area itself is not supported by the sustainability of the surrounding community. This is illustrated by the low level of community participation. Even so, the community benefits indirectly from the presence of mangroves from the side of the fisheries managed by them.
Gong Cave, as one of the main tourist destinations in Pacitan, has the most complete facilities. The manager provides toilets, a small mosque, souvenirs, food, and public transportation. Counters are also available with a variety of clearly installed instructions. Goa Tabuhan is a well-known tourist destination after Goa Gong. Stalactites and stalagmites from this cave can be struck like a gamelan (Javanese musical instrument). Unfortunately, there are only 2 signposts available to get to this location. Road conditions are also quite narrow and not good.
Table 3. The Composition of Internal-External Factors, Values, and Weights.
| Strategy Factors | Values | Weights (valuex 0.5) | |
|---|---|---|---|
| Internal Factor | Strengths | ||
| Ticket price | 0.067 | 0.033 | |
| Potency of natural resources | 0.408 | 0.204 | |
| Region physiographic | 0.154 | 0.077 | |
| Culture (the kindness of society) | 0.153 | 0.076 | |
| The support of society | 0.219 | 0.109 | |
| Weaknesses | |||
| Potency of human resources | 0.224 | 0.112 | |
| Capital access | 0.096 | 0.048 | |
| The un-optimal promotion | 0.114 | 0.057 | |
| Facilities and infrastructure | 0.261 | 0.130 | |
| Accessibility | 0.306 | 0.153 | |
| External factors | Opportunities | ||
| Government policy support | 0.270 | 0.135 | |
| The existence of investors | 0.161 | 0.081 | |
| Tourist interest tendency (natural and traditional tourism) | 0.265 | 0.133 | |
| Domestic market opportunities | 0.187 | 0.093 | |
| Development of information technology | 0.116 | 0.058 | |
| Threats | |||
| Equation of types of attractions with other regions | 0.210 | 0.105 | |
| Security | 0.211 | 0.106 | |
| Regional economy | 0.199 | 0.100 | |
| Transfer of land functions | 0.197 | 0.098 | |
| Exploitation of natural resources | 0.183 | 0.092 | |
In the section of Goa Tabuhan location, information boards are available quite well, and cleaning facilities, buying and selling, recreation, and parking are sufficiently available.
3.4 The Potency of Development
In the period of 4 years (2011-2015), the Pacitan tourism sector which was originally ranked 32 out of 38 Regencies / Cities in East Java, grew to 14th. Thus, it is necessary to describe the direction of tourism development. There are 3 types of tourism that are the mainstay of Pacitan; geo-diversity (park tourism range), bio-diversity (nature tourism range), culturediversity (various cultures and histories).
The government itself has a tourism development plan which is divided into three large zones: 1) west, covering Donorojo, Punung, Pringkuku, and Pacitan Districts, 2) North, including Nawangan, Arjosari, Bandar, and Tegalombo Districts, and 3) East, including Kebonagung, Tulakan, Ngadirojo, and Sudimoro. Based on observations, the western zone is the most crowded tourist location complex, compared to the other two zones. This zone has a variety of tourist locations with a panoramic view, ranging from natural, cultural and artificial tourism.
3.5 SWOT Analysis
The SWOT method used in the study revealed the position of tourism development in Pacitan by connecting positive and negative factors. This method allows the development of strategies that can actually be applied to maximize tourism potential. We describe the tourism conditions in Pacitan through the factors collected based on the results of observations and assessments based on respondents. Furthermore, a rating calculation table is prepared for the factors used. Rating is used to determine the effect of each factor, where rating 4 represents a very strong level of influence and 1 represents a very weak level of influence (Table 3).
3.6 Internal Strategy Factor Analysis
Through internal strategy factor analysis with IFAS matrix, strengths that can be developed and weaknesses that must be minimized in tourism development in Pacitan Regency can be obtained. From the strength factor, the potential of natural resources reaches the highest weight (0.204) while the ticket price reaches the lowest weight (0.033). The difference from both: 0.171, then divided by three, produces an interval value of 0.057. From the value of the hose, the form of classification is obtained (see Table 4).
Based on the results of the strength factor analysis, the potential of natural resources plays a very important role (weight value 0.204) and has a very strong influence (rating 4) on the development of tourism in Pacitan Regency (Table 5). Community support plays an important role (weight value 0.109) with a fairly strong influence (rating 3). As for the physiographic area and customs (public friendliness), the role is quite important (weighing 0.077 and 0.076) with a strong enough influence (rating value 3). For ticket prices, the role is quite important (0.033 weight value) with a fairly weak influence (rating value 2).
From the weakness factor, accessibility reaches the highest weight (0.153) while capital access reaches the lowest weight (0.048), the result of the reduction (0.105) after being divided into three produces an interval value of 0.035 and the classification is determined (Table 5). Based on the results of the analysis of weaknesses, accessibility and facilities and infrastructure plays a very important role (weighted values 0.153 and 0.130) and has a very strong influence (rating 3). HR conditions play an important role (weight value 0.112) with a strong enough influence (rating 3). The promotion is not optimal and access to capital roles is quite important (weight values 0.057 and 0.048) with a fairly weak influence (rating value 2). Furthermore, the IFAS calculation specified in the table 5 is determined.
Table 4. Classification of Weakness Factor
| Classification | Value |
|---|---|
| Important enough | 0,048 – 0,082 |
| Important | 0,083 – 0,117 |
| Very important | 0,118 – 0,153 |
Table 5. Rating Calculation
| Strategy Factors | Rating | Final | ||||
|---|---|---|---|---|---|---|
| 1 | 2 | 3 | 4 | Average | Value | |
| Internal factor | ||||||
| Strangth | ||||||
| 1. Ticket price | 7 | 1 | 2 | 15 | 2 | |
| 2. Potency of natural resources | 1 | 1 | 8 | 36 | 4 | |
| 3. regional physiographic | 3 | 7 | 27 | 3 | ||
| 4. Culture | 1 | 4 | 3 | 2 | 26 | 3 |
| 5. the supports of society | 1 | 2 | 5 | 2 | 28 | 3 |
| Weaknesses | ||||||
| Potency of human resources | 3 | 2 | 2 | 3 | 25 | 3 |
| Capital access | 1 | 6 | 3 | 22 | 2 | |
| The unoptimal promotion | 2 | 4 | 3 | 1 | 23 | 2 |
| Facilities and infrastructure | 3 | 4 | 3 | 30 | 3 | |
| Accessibility | 2 | 4 | 4 | 32 | 3 | |
| External Factors | ||||||
| Opportunity | ||||||
| Government policy support | 1 | 1 | 4 | 4 | 31 | 3 |
| The existence of investors | 2 | 4 | 3 | 1 | 23 | 3 |
| Tourist interest tendency | 3 | 3 | 4 | 31 | 3 | |
| Domestic market opportunities | 1 | 1 | 5 | 3 | 30 | 3 |
| Information technology | 2 | 5 | 2 | 1 | 22 | 2 |
| Threats | ||||||
| Equation of types of attractions with other regions | 3 | 4 | 1 | 2 | 22 | 2 |
| Security | 5 | 1 | 4 | 23 | 2 | |
| Regional economy | 1 | 2 | 7 | 26 | 3 | |
| Transfer of land functions | 5 | 4 | 1 | 26 | 3 | |
| Exploitation | 4 | 4 | 2 | 28 | 3 | |
Table 6. IFAS of tourism development in Pacitan
| Internal Strategy Factors | Weights | Rating | Score |
|---|---|---|---|
| Strengths | |||
| 1. Ticket price | 0.033 | 2 | 0.067 |
| 2. Potency of natural resources | 0.204 | 4 | 0.816 |
| 3. regional physiographic | 0.077 | 3 | 0.231 |
| 4. Culture (the kindness of society) | 0.076 | 3 | 0.229 |
| 5. The supports of society | 0.109 | 3 | 0.328 |
| Total | 1.671 | ||
| Weaknesses | |||
| 1. Potency of human resources | 0.112 | 3 | 0.335 |
| 2. Capital access | 0.048 | 2 | 0.096 |
| 3. The unoptimal promotion | 0.057 | 2 | 0.114 |
| 4. Facilities and infrastructure | 0.130 | 3 | 0.391 |
| 5. Accessibility | 0.153 | 3 | 0.458 |
| Total | 1.395 | ||
Source: Analysis Result, 2016
Table 7. Classification of Opportunity Factor
| Classification | Value |
|---|---|
| Important enough | 0,058 – 0,083 |
| Important | 0,084 – 0,109 |
| Very important | 0,110 – 0,350 |
Table 8. Classification of Threat Factor
| Classification | Value |
|---|---|
| Important enough | 0,092 – 0 096 |
| Important | 0,097 – 0,101 |
| Very important | 0,102 – 0,106 |
Source: Analysis Result, 2016
3.7 External Strategy Factor Analysis
From the opportunity factors, government policy support reaches the highest weight (0.135) while the development of information technology reaches the lowest weight (0.058). The difference between the two reaches 0.077 after divided by three resulting in an interval value of 0.025. From the value of the interval, a classification is obtained which divides the conditions of the factors used (Table 7).
Based on the results of the analysis of opportunity factors, government policy support and tourist interest trends (natural and traditional tourism) play a very important role (weight values of 0.135 and 0.133) and have a strong influence (rating 3) on tourism development in Pacitan Regency. Market opportunities for domestic tourists play an important role (weighted 0.093) with a fairly strong influence (rating 3). The existence of investors and the development of an information technology role is quite important (weight values 0.081 and 0.058) with a fairly weak influence (rating value 2).
From the threat factor, security reaches the highest weight (0.106) while the exploitation of natural resources reaches the lowest weight (0.092). The difference between the two is 0.014, then after being divided into three produces an interval value of 0.004. Based on the interval value, a classification is obtained which divides the conditions of the factors used (Table 8).
Based on the analysis of threat factors, security and object equality with other regions play a very important role (weight values 0.106 and 0.105) but have a fairly weak influence (rating value 2) on the development of tourism in the Pacitan Regency. Regional economics and landuse change play an important role (weight values of 0.100 and 0.098) with a fairly strong influence (rating value 3). As for the exploitation of SDA, the role is quite important (0.092 weight value) with a fairly strong influence (rating 3). Next, we did the preparation of the EFAS calculation structure (Table 9).
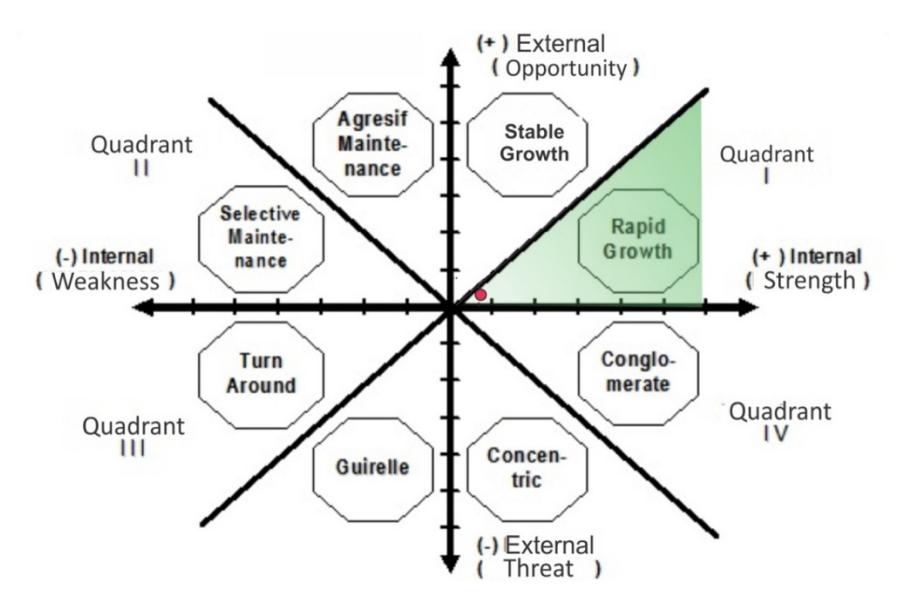
Figure 3. Matrix Space
3.8 Internal Analysis Matrix
The results of the matrix space analysis can be used to sharpen the strategy to be developed (Figure 3). Parameters used from the results of internal strategy factor analysis and external strategy factor analysis; the difference from the internal score (strength because it is considered to have the power to be able to capture and take advantage of existing opportunities and reduce existing weaknesses.
3.9 Suggestions for Developing Pacitan Tourism
As the first step to provide a sustainable ecotourism development direction is to do an analysis using the SWOT method. This SWOT method combines the weight values that have been obtained from the previous AHP analysis to be combined with the analysis design Strengths, Weaknesses, Opportunities and Threats (Table 11).
Table 9. EFAS of Tourism Development in Pacitan Regency
| Internal Strategy Factors | Weight | Rating | Score |
|---|---|---|---|
| Strengths | |||
| 1. Ticket price | 0.135 | 3 | 0.405 |
| 2. Potency of natural resources | 0.081 | 2 | 0.161 |
| 3. regional physiographic | 0.133 | 3 | 0.398 |
| 4. Culture (the kindness of society) | 0.093 | 3 | 0.280 |
| 5. The supports of society | 0.058 | 2 | 0.116 |
| Total | 1.361 | ||
| Weaknesses | |||
| 1. Potency of human resources | 0.105 | 2 | 0.210 |
| 2. Capital access | 0.106 | 2 | 0.211 |
| 3. The unoptimal promotion | 0.100 | 2 | 0.299 |
| 4. Facilities and infrastructure | 0.098 | 3 | 0.295 |
| 5. Accessibility | 0.092 | 3 | 0.275 |
| Total | 0.072 |
Based on the results of SWOT and previous analyses, this study has implications in the form of improvements to the current tourism policies without making radical changes to existing policies. The four formulation directions for the development of sustainable ecotourism areas in Pacitan Regency is as follows:
- 1. Making 4 (four) ecotourism areas. Making an ecotourism area will give more choices to tourists can further highlight the distinctive potential possessed in the form of natural resource potential and tradition, facilitate conservation efforts to prevent excessive exploitation and environmental damage and facilitate its management. There are four main areas that can be developed in Pacitan Regency, namely Taman beach ecotourism, mangrove ecotourism, Goa Tabuhan, and Goa Gong ecotourism areas.
- 2. Considering the condition of tourism in Gunungkidul Regency which is supported by the advantages of accessibility and road infrastructure that leads to its tourism objects as well as the large role of the community, the direction of tourism policy in Pacitan Regency is encouraged to further increase the accessibility and infrastructure of the area around tourism objects that are adjusted to the local wisdom of the community. For example, the construction of a village shaft road network to the location of a tourism object is more appropriate to make road rebates compared to road paving. Road rebate models are easier to maintain compared to asphalt roads.
- 3. Providing wider opportunities for the community to enjoy the benefits of the existence of tourism objects so that the support and active participation of the community can be expected. Some tourism objects that have not or cannot be managed by the local government can be handed over to the management of the community; Improve the quality of human resources related to tourism, access to capital of the community around tourism objects, promotion and networking of investors through developing information technology. The participation and cooperation between the Regional Government Work Unit (SKPD) of the Pacitan Regency Government is absolutely necessary especially between the Youth and Sports Tourism Culture Office with the Regional Development Planning Agency, the Trade Industry Office of the UMKM Cooperative, the Investment Board and Integrated Services, the Community Empowerment Agency, the Forest Service and Plantation, Livestock and Fisheries Service, Environmental Office, Development Section, Public Relations Section, Perhutani and Non-Governmental Organizations.
- 4. Efforts to strengthen tourism cooperation with neighboring districts through building partnerships and forming networks with the principle of mutual benefit.
Table 10. The SWOT Result
| Strengths (S) | Weakness (W) | |
|---|---|---|
| 1. Ticket price (0.067) | 1. Condition of human | |
| 2. Potency of natural | resources (0.335) | |
| resources (0.816) | 2. Capital access (0.096) | |
| 3. Regional physiographic (0.231) | 3. The unoptimal promotion (0.114) | |
| 4. Culture / the kindness of | 4. Facilities and | |
| society (0.229) | infrastructure (0.391). | |
| 5. The supports of society | 5. Accessibility (0.458) | |
| (0.328) | ||
| Opportunities (O) | Strategi SO | Strategi WO |
| 1. Government policy support | 1. Maintaining the | 1. Maximizing the role of |
| (0.405) | sustainability of the | local government in |
| 2. The existence of investors | potential of natural and | increasing the quantity |
| (0.161) | cultural tourism objects | and quality of |
| 3. Tourist interest preferences | local community (S2-4 & | accessibility, |
| (0.398) | O3) = 1,674 | infrastructure and |
| 4. Domestic market | 2. Strive for local government | conditions. HR related to |
| opportunities (0.280). | policies that are more pro | tourism in accordance |
| 5. Development of information | tourism by increasing | with local community |
| technology | collaboration between | wisdom (W1,4-5&O1) = |
| SKPD, attracting credible | 1,589. | |
| investors and providing a | 2. Optimizing promotion | |
| greater proportion of | through information | |
| tourism management to | technology in capturing | |
| community through | local tourists (W3&O4- 5) | |
| institutions incorporated | = 0,510. | |
| (S5&O1-2) = 0,894 | ||
| Threats (T) | Strategi ST | Strategi WT |
| 1. Object Type Equations | 1. Seek community support to | 1. Increasing the quantity |
| with other regions (0,210) | minimize security | and quality of |
| 2. Security (0,211) | disturbances that can | accessibility, |
| 3. Regional economic (0,299) | impact on economic | infrastructure through |
| 4. Transfer of Land | stability regional and | collaboration with |
| Functions (0,295) | environmental damage due | neighboring districts (W4- |
| 5. Natural resource | to the impact of tourism | 5&T1) = 1,059 |
| exploitation (0,275) | (S4-5&T2- 5) = 1,375 | 2. Facilitate access to public |
| 2. Maintaining the | capital and the conditions | |
| sustainability of tourism | of surrounding human | |
| potentials and increasing | resources security-related | |
| cooperation with | tourism objects that | |
| neighboring districts with | impact economic stability | |
| the principle of mutual | the community (W1- | |
| benefit | 2&T2- 3) = 0,941 |
4. CONCLUSION
The economy of Pacitan Regency is characterized by the economy of the Tertiary Sector. The potential of natural resources plays a very important strength (weight value 0.204) and on the weaknesses, accessibility and facilities and infrastructure plays a very important role (weighted values 0.153 and 0.130). Government policy support reaches the highest weight (0.135) on opportunity, and on threat factors, security and object equality with other regions
play a very important role (0.106 and 0.105). The four formulation directions for sustainable development of Pacitan ecotourism: 1. Making 4 (four) ecotourism areas; 2. Increase the accessibility and infrastructure; 3. Providing wider opportunities for the community to enjoy the tourism benefits; 4. Efforts to strengthen tourism cooperation.
ACKNOWLEDGEMENT
Authors thank to government of Pacitan for research permission and secondary data. Authors also thank to Gong and Tabuhan cave communities for being local guides in this study.