
1. Introduction
Today, tourism is one of the world's largest industries. Its contribution to the global GDP was US$ 8.8 trillion in 2018, with a projected growth rate of 3.8% annually throughout the next decade (World Travel & Tourism Council [WTTC], 2019). The tourism industry earns its revenue from expenditures tourists make on trips; this revenue is directly dependent on the length of stay of tourists in destinations. Destination managers are therefore quite interested in motivating tourists to book longer stays. Simply put, tourists are likely to generate more revenue when remaining at destinations for longer durations (Downward et al., 2009). Hence the length of stay (LOS) of tourists is an important variable in tourism. A survey of the relevant literature, however, reveals that, though this variable has been investigated in the context of the tourism markets of different countries, very scant research has been conducted toward understanding the nature and determining factors of LOS of tourists in the Indian context.
In the current scenario of emerging new tourist markets, a trend has been observed toward shorter LOS's tourists, coupled with an increased number of trips spread throughout the year, due largely to the expansion of business tourism and a decrease in flight fares (Martinez et al., 2008; Yang & Liu, 2003). When planning a holiday, tourists must make a number of decisions pertaining to a range of aspects of the trip e.g., accommodation type, destination choice, modes of transport, etc. Though it is possible to consider such decisions on a sequential basis, such decisions are essentially interdependent. (Dellaert, Ettema, & Lindh, 1998). LOS is one of the vital elements of a holiday plan. Tourists' age, level of education, family status, and profession are examples of family and personal characteristics that might influence tourists' duration of stay at a given destination. Income and cost of travel are some of the economic variables that should also impact the length of stay (Alegre & Pou, 2006). The LOS has been considered a major issue in the tourism literature, necessitating a study regarding factors that contribute to tourists' decisions regarding trip duration (Decrop & Snelders, 2004). The selection of destination and determining what to do while staying there involves evaluating a range of options within the constraints of budget and time and, further, sociodemographic and economic factors and also factors like with whom to travel may impact these decisions (Fesenmaier & Jeng, 2000).
For tourist-attracting as well as tourist-generating destinations, several factors may arise that could disrupt the flow to a given destination. These may be economic or time-related; they also might include income, age, occupation, time, cost, motivation, distance, etc. Destination availability can also be a factor (Gokovali et al., 2017). Since the LOS of tourists has a major impact on the economic performance of a destination, providing opportunities for tourists to have more positive experiences might increase the amount of money they spend at a given destination (Kozak, 2004). Destination attractiveness aside, other factors influencing LOS may be the availability of time, flexibility of package tour deals available, the cost, number of people accompanying the traveler, familiarity with the destination, etc. (Gokovali et al., 2007). In spite of its importance, tourist demand has been analyzed in very few studies (Garcia & Raya, 2008). In past studies, a number of variables impacting travel expenditures have been empirically analysed, and length of stay is a critical variable in this context (Thrane & Farstad, 2011). Balearics (the Balearic Islands are an archipelago off eastern Spain, in the Mediterranean known for tourist attractions) has seen a drop in LOS of tourists successively in recent years; this has resulted in reduced profits for the region from tourism. It is a phenomenon not only confined to that region; rather, it is all-pervasive as found by past studies (Martinez et al., 2008). This issue thus merits the attention of researchers who can (a) analyze and model LOS's and (b) identify factors impacting travel duration. Despite the importance of these concerns for the Indian tourist industry (or for that matter, the industry as a whole), the determinants of tourists' LOS has thus far been largely ignored in past studies (Alegre et al., 2011).
Survival models have gained popularity in recent times for analyzing the LOS of tourists in destinations; these have led to various insights into the causes of tourists prolonging or cutting short their stay duration at a given destination. But these models involve a great deal of statistical complexity, compared to better-known substitutes such as Ordinary Least Squares (OLS) regression models (Thrane, 2012). Thrane further argues in the same paper that the application of survival models in analyzing tourists' LOS leads to undue complications and makes matters worse. He further suggests that justifying the application of survival models for LOS analysis does not hold because of its use in social sciences and economics (Thrane, 2012). In tourism policy, LOS management is of critical importance (Peypoch et al., 2012). It is one of the most important influencing factors impacting the tourism economy (Wang et al., 2012). The salience of identifying the factors influencing LOS and the resultant benefits to researchers and policymakers has become more important in view of universally shortening LOS's (Carlos & Richard, 2010).
In light of the above discussions, a need was felt to study the determinants of tourists' LOS empirically and systematically. A survey of literature pertaining to this aspect further showed there was the insufficient study of LOS and its determinants, particularly, in the context of Indian domestic tourism, with the exception of one study by Lal et al., (2018) despite the fact that this is a huge tourism market (WTTC, 2019). Travel and tourism is the largest service industry in India. It provides heritagerelated, cultural, medical, business, and sports tourism (https://www.india.gov.in/topics/traveltourism). In 2017, 1.65 billion domestic tourists undertook tourism within India contrasted with 26.8 million foreign tourists visiting India ( India Tourism Statistics, Govt. of India, Ministry of Tourism, 2018). In 2018, India's contribution was around 6% to global travel- and tourism-related GDP growth, representing the third-highest amount in the world after China (25%) and the USA (12%) (WTTC, 2019).
From these statistics, it may be inferred that India is an important market in global tourism; further, Indian domestic tourism is far larger than foreign tourism in India. Hence, this study was conducted to investigate factors determining LOS in the context of Indian domestic tourism. Such an investigation fills an essential void existing in tourism research. The paper contributes to the tourism literature in two ways: (a) by analyzing the determinants of LOS of Indian domestic tourists and (b) by adopting a multivariate adaptive regression splines (MARS) model for data analysis, which, in the context of the tourism literature, is a novelty. To the best of our knowledge, no researcher has adopted the MARS model in a similar study. The findings will fill the gap in tourism literature in terms of the dearth of research on Indian domestic tourism. It will also help destination marketers to appreciate the nuances affecting tourists' LOS. In so doing, it will enable them to better manage their marketing mix to earn more revenue by motivating tourists to stay longer in their destinations.
The subsequent sections of the paper are organized as follows. The second section presents a detailed review of past studies in this field. The third section presents the data collection and research methodology adopted in the current investigation. The fourth section presents results and discussions; the fifth section covers the conclusion and implications of the study.
2. Literature review
Various authors have shown the impact of LOS on revenues of the destinations generated by tourist in the past (Agarwal & Yochum, 1999; Alegre & Pou, 2003, 2006; Cannon & Ford, 2002; Mules, 1998; Nogawa, Yamaguchi, & Hagi, 1996; Seaton & Palmer, 1997; Spotts & Mahoney, 1991; Taylor, Fletcher, & Clabaugh, 1993; van Limburg, 1997). Alen et al., (2014) found a positive relationship between age and LOS of senior Spanish tourists by applying the negative binomial model. The LOS at the destination was concluded to be positively related to age in the study. The other factors impacting the LOS were found to be the purpose of travel, accommodation type, group size, etc.
The experience of tourism significantly impacts the LOS of tourist, and other influencing factors could be recreational activities, quality of hospitality at the destination, hygiene, nationality, age, number of accompaniments, budget, etc. (Adongo et al., 2017). Thrane (2012) conducted a study applying several econometric techniques to investigate the effect of a number of independent variables and nationality on the LOS.
A limited number of studies have used econometric models to study the determinants of LOS. Wang et al. (2012) adopted a survival model analysis to study the LOS in Dalian northeastern China. The authors concluded that repeat visitors and distance of travel to the destination were significant factors determining the LOS at the destination. Another investigation applying the survival model (Peypoch et al., 2012) concluded that income, age, and education apart from nationality had an effect on LOS. Garcia & Raya (2008) conducted a study on the LOS for low-cost tourism in order to analyze the extent to which tourists' personal characteristics impacted LOS and found that time constraints, income, costs, and destination-related characteristics are significant factors in determining the LOS at a given destination. The results further showed that age, education, occupation type, type of accommodation, etc. had an impact on tourists' LOS.
Gokovali et al. (2007) conducted a study to analyze the determinants of tourists' LOS, applying the survival model. They found that income, education, experience, familiarity with the destination, and costs were significant determinants of LOS. Barros and Machado (2009) conducted a study to analyze the tourists' LOS in the vacation destination of Madeira; they concluded that gender, education, and age had an effect on the LOS of tourists. Lal et al. (2018) conducted a study applying interpretive structural modeling (ISM) to investigate the factors that influence the tourist LOS in India. The findings suggested that age, budget, purpose of visit, cost, etc. are factors impacting the LOS of Indian tourists. Brida et al. (2013) examined cultural tourists' LOS by applying a zero–truncated negative binomial model; their results suggested that nationality, income, age, employment status, costs, etc. impacted the LOS. In another investigation, the findings confirmed that tourist LOS was impacted by socioeconomic characteristics related to their travel (Alegre et al., 2013).
Thrane (2016) found that trip motives, booking time, daily trip costs, and gender are major factors affecting variations in the LOS. Alegre et al. (2011) analyzed factors impacting tourists' LOS by applying a latent class truncated Poisson regression. These authors found that socioeconomic and demographic characteristics, along with constraints of time and money, have an impact on the LOS of tourists. Menezes et al. (2008) investigated the determinants of tourists' LOS in the Azores. They found that sociodemographic characteristics such as Azorean ascendancy, nationality, and trip attributes (e.g., repeat visits and type of travel arrangements) were significant determinants of LOS. The results further showed that destination image and approach toward environmental initiatives had an effect on tourist LOS. Machado (2010) studied the relationship between LOS and the image of the tourist destination. He applied the discrete-choice duration model for the analysis of data; results suggested that destination image had a direct positive correlation with LOS. The study found that education level and age also impacted the duration of stay of tourists at a given destination. Alegre and Pou (2006) studied the trend toward shorter stays during holidays. Their findings suggest that tourists' sociodemographic characteristics impact LOS. Their results further indicated that price changes had an additional impact on the duration of stay. Another study conducted by Santos et al. (2015) used a shared heterogeneity duration model for analyzing tourists' LOS. The results were helpful in understanding tourists' behavior and also predicted their duration of stay according to relevant variables. Nicolau et al. (2009) found that LOS was impacted by destination-related characteristics, personal restrictions such as age and income, and sociodemographic factors.
A study by Thrane and Farstad (2011) in a Norwegian context found a positive but diminishing relationship between tourism expenditure and LOS and a convex relationship between tourism expenditure and travel party size. Nicolau et al. (2018) conducted a study to investigate the impact of first-time visitation and distance on tourists' LOS. The analysis of LOS and its determinant factors remain significant in tourism due to its profound implications for tourism. The results showed that both first-time visitation and distance had a positive impact on the LOS of tourists. Thrane (2012) reviewed studies employing 'survival models' to explain variations in the LOS at destinations and concluded that justifications offered for employing survival models in place of traditional OLS regression do not hold, the OLS regression model was as robust as survival models.
Kruger and Saayman (2014) conducted a study in southern and northern regions of Kruger National Park in South Africa to analyze factors determining LOS; they found a clear difference between factors impacting the duration of stay for these two regions. A reliable indicator of tourists' level of consumption is a LOS index (Rugg, 1973).
Based on the preceding discussions, it may be concluded that past researchers have attempted to investigate factors impacting tourists' LOS by applying various methods and models. They have come up with a range of variables that impact the LOS of tourists in different contexts. The current study focuses on Indian domestic tourists and investigates the factors that impact their LOS at destinations. The current study adopts the MARS model; this framework can analyze the nonlinear influence of variables that result in a better model fit.
3. Data and methodology
3.1 Data collection
The population of the study is all Indian domestic tourists, 15 years old and above, who have undertaken travel to domestic destinations in the last 36 months either individually (selecting their own destinations and planning their own trips) or participating in tours offered by tour operators with prepackaged destinations and itineraries. Tourists were approached online using email or social media through a network of contacts maintained by the investigator. As a first step, a letter soliciting participation in the study, with a brief description of research and several questions on demographic and tour history information, was sent to 3270 contacts. The questionnaire investigated the demographic and tour history profile of prospective participants (e.g., age, gender, education, marital status, occupation, monthly income, LOS, and the number of accompanying travelers) The data collection was done from November 2018 to May 2019.
Table 1. The variables are used in the study.
| Variables | Description | |||
|---|---|---|---|---|
| Length of Stay | Dependent variable: number of days | |||
| Age | In years | |||
| Income | In INR per month | |||
| No-accompanied | Number of persons accompanied | |||
| Male | - | |||
| Marital | - | |||
| Graduate | - | |||
| Employer | - | |||
| Employee | - | |||
| Self-employed | - | |||
| Student | - | |||
| Housewife | - | |||
| Alone | - | |||
| Spouse | - | |||
| Friends | - | |||
Data collection was accomplished using both an online and offline mode. A sufficient number of questionnaires were printed for off-line distribution. The questionnaire was also converted into an HTML format for online data collection. Offline questionnaires were physically distributed to respondents in face-to-face contact and with a request to complete and return the questionnaires in person to the investigator or to his representative in the next face-to-face contact scheduled after 3 days. Online questionnaires were either sent to individual respondents whose email contact was available or posted on Facebook with a general appeal to complete and submit. With few follow-ups, 556 respondents returned the questionnaires. Of these, questionnaires of 30 respondents had to be discarded due to incomplete information. The remaining 526 questionnaires were used for final data analysis. The summary statistics of the variables chosen for analysis are given in table 2.
Table 2. Descriptive Statistics
| Variables | Mean | Std. Dev. | Kurtosis | Skewness |
|---|---|---|---|---|
| Stay | 2.341 | 1.023 | -0.275 | 0.613 |
| Male | 0.428 | 0.496 | -1.932 | 0.294 |
| Age | 28.067 | 10.992 | 2.395 | 1.796 |
| Marital | 0.351 | 0.478 | -1.620 | 0.629 |
| Graduate | 0.803 | 0.399 | 0.356 | -1.534 |
| Employer | 0.024 | 0.154 | 37.550 | 6.260 |
| Employee | 0.346 | 0.477 | -1.591 | 0.651 |
| Self-employed | 0.178 | 0.383 | 0.888 | 1.697 |
| Student | 0.394 | 0.490 | -1.828 | 0.436 |
| Housewife | 0.034 | 0.181 | 25.384 | 5.210 |
| Income | 30,553 | 29,776 | 0.378 | 1.298 |
| Alone | 0.197 | 0.399 | 0.356 | 1.534 |
| Spouse | 0.308 | 0.463 | -1.308 | 0.839 |
| Friends | 0.524 | 0.501 | -2.010 | -0.097 |
| No-accompanied | 3.587 | 1.969 | 0.908 | 0.966 |
3.2 Methodology
The data hence collected were analyzed taking a number of days stayed, as the dependent variable and others as independent variables using a multiple regression model, and subsequent analysis was done applying 'Multivariate Adaptive Regression Splines' (MARS model). MARS model was first suggested by Freedman (1991) as a flexible process to establish the relationship between the input variables and the dependent variable that is nearly additive and sometimes interacts with a few other variables. MARS can construct a flexible model by joining piecewise linear regression functions, and the non-homogeneity of the relationship is estimated at different intervals of the input variables through the use of separate regression slopes. Therefore, it is permissible to change the slope of the regression line from one interval to another when "knot" points are crossed. MARS searches for interactions between intervals in the variable space and allowing a large number of splits in the range of each independent variable. It is an unconventional statistical technique in which the input variables are divided into discrete pieces of different gradients (slopes), that enables it to find relationships in a complex data organization, hidden in data, and effectively reveal important data patterns that are not possible in other models to discover.
The final MARS model is developed in steps. First, MARS makes a large number of basis functions (BFs), that overfits the available data by allowing a large number of interactions, in the model creation process, MARS is able to track a very complex relationship hidden in a complex data structure. The selection of the knot continues until the maximum model size is met, after which a backward-sorting process is used in which basis functions, that contribute negligibly in the model fitting, are gradually removed. At this stage, a predictive variable can be fully removed from the model altogether if its
basis functions do not make a significant contribution to model performance. In the next step, the BFs are detached in order of contribution made by them, and the generalized cross-validation (GCV) measure is used. When variables are removed from the model, the measure of variable significance can be estimated by looking at the calculated GCV reduction.
One advantage of MARS is that it does not require assumptions on the nature of the relationship between the variables (Friedman, 1991). As a result, the MARS model has the ability to illustrate the nonlinear relationship between variables, which is not possible to reveal in the OLS model. Detail information about the model construction process can be found in Friedman (1991).
Suppose that the dependent variable y is a function of other independent variables such that:
\[y = \alpha + f(x_1, x_2, \dots x_n) + \varepsilon\], ..... equation (1)
MARS can construct the relationship into the additive format of a linear function of X similar to \[y = \alpha + f(x_1) + f(x_2) + \dots + f(x_n) + \varepsilon\] ..... equation (2)
In equation (2), (#) is Basis Function (BF), which uses the format of max(0, x - t) for a knot at position t. The max (.) function selects only the positive estimates; if the estimate is negative, a zero value is assigned. Thus, the MARS constructs flexible models by capturing the nonlinear effects of the basis functions from the independent variable. The relationship is estimated by different regression slopes in the different range of each input variable.
Stay = 3.028 - 1.526 * Graduate + 1.164 * Employer + 0.589 * Self-employed + 0.452
* Spouse + 0.052 * BF1: Max (0, (Age-35)) + -0.077 * BF2: Max (0, (Age-45)) + 0.48 *
BF3: Max (0, (No-accompanied-2)) + -0.621 * BF4: Max (0, (No-accompanied-3)) + ε
……………………………………………………………………....……equation (3)
4. Results Results and discussions
The analysis of the relationship of LOS with other determining variables has been carried out using both multiple regression and MARS. The result of multiple regression is shown in Table 2; it reveals that age, education, and employers had a significant relationship with LOS. The coefficient value of age is positive, indicating that LOS increases with age. This implies older people stay much longer compared to younger people, thus corroborating the findings of Alegre and Pou (2003); Alen et al. (2014); Barros and Machado (2010); Blazey (1992); Fleischer and Pizam (2002); Martinez-Garcia and Raya (2008); Meng and Usyal (2008); Nicolau and Mas (2009); Romsa and Blenman (1989); and Salmasi et al. (2012). The coefficient of graduates was negative, indicating that people with higher degrees and qualifications stay for fewer nights, an effect, that may be due to other commitments and less time for tourism. This result is consistent with the findings of Antonio and Jose (2009); Gokovali et al. (2007); and Wang et al. (2012). Tourists falling under the employer category stayed for longer durations as the coefficient value is positive; one possible reason could be that employers need to travel more for business-related matters. To the best of the knowledge of the authors, no past study has investigated this variable. It hence may be considered a new finding of our study. Results of other variables were not found to be significant and hence are not discussed.
Variable Estimate Std. Error t-value (Intercept) 2.96E+00 5.87E-01 0.000 *** Male 1.86E-01 1.42E-01 0.193 Age 1.79E-02 8.34E-03 0.034 ** Marital -2.90E-01 2.78E-01 0.298 Graduate -1.36E+00 1.86E-01 0.000 *** Employer 1.53E+00 5.14E-01 0.003 *** Employee 2.08E-02 3.94E-01 0.958 Self-employed 4.27E-01 4.04E-01 0.292 Student -1.29E-01 3.98E-01 0.747 Housewife 1.49E-02 4.58E-01 0.974 Income -2.85E-06 2.97E-06 0.340 Alone -4.02E-02 2.39E-01 0.867 Spouse 4.42E-01 2.82E-01 0.119 Friends 7.90E-02 2.11E-01 0.708 No-accompanied -4.43E-02 2.87E-02 0.124
Table 3. Results of Multiple regression
Multiple R-squared: 0.4816
Nevertheless, the above results of multiple regression could not reveal much useful information. Hence, we replicated the analysis using MARS and found that tourists with graduation or higher degree travel less and employer-category tourists travel more. These two findings are similar to the findings of OLS regression. Coefficients associated with the self-employed category were also found to be positive and significant. The findings imply that self-employed people need to travel more, similar to the employed category; however, the coefficient of self-employed people is around half of the tourists falling into the employers' category. It was further found that people traveling with spouses stay for longer periods of time; perhaps given that they have no hurry to return home.
The most interesting result of using MARS is that age had a nonlinear relationship with LOS. As can be seen from Panel 1 of Figure 1, the coefficient of age remains unchanged up to 35 years of age; thereafter, it slopes upward until 45 years of age and starts declining thereafter. This indicated that people's travel duration increases from 35 years to 45 years and then decreases with age. This result is similar to the findings of Alegre et al. (2011), whose findings suggested that tourists in the age interval 45 and above are more likely to have a reduced LOS in comparison to tourists under the age of 45. The similarity of findings with those of past studies is partial, our findings show that, though LOS increased from age 35 up to the age of 45, it began to decrease thereafter, which may be considered as a refinement of the past findings. This finding could be attributed to their declining energy level beyond 45 years of age, and also they start retiring from active work life which may lead to fewer business-related travel commitments. Reduction in income level could be another reason for reduced LOS at the destination, as they may be retiring from their active work life or saving for retirement.
The number of persons in the group also shows similar nonlinear behavior (see figure 6); this is in agreement with the findings of Thrane and Farstad (2011). The coefficient value remains fixed up to two persons and increases up to three persons and thereafter declines. This indicates that couples accompanied by one child or another relative stay for a longer time and, as the group size increases beyond three, the number of days reduces, possibly because of higher expenditures and availability of time for others. Expenditure, one could say, explains LOS. It is found that, the higher the expenditure, the shorter the LOS (Barros et al., 2010; Thrane & Farstad, 2011). In the Indian context, it is all the more true, since Indian tourists are highly cost-conscious. The reason why the duration of stay is highest for three persons traveling could be because three is the most optimal number to minimize per-person costs. The three persons may stay in one room with a marginal extra cost;
ordering food is also the most economical per person if the cost is shared by three tourists sharing the food.
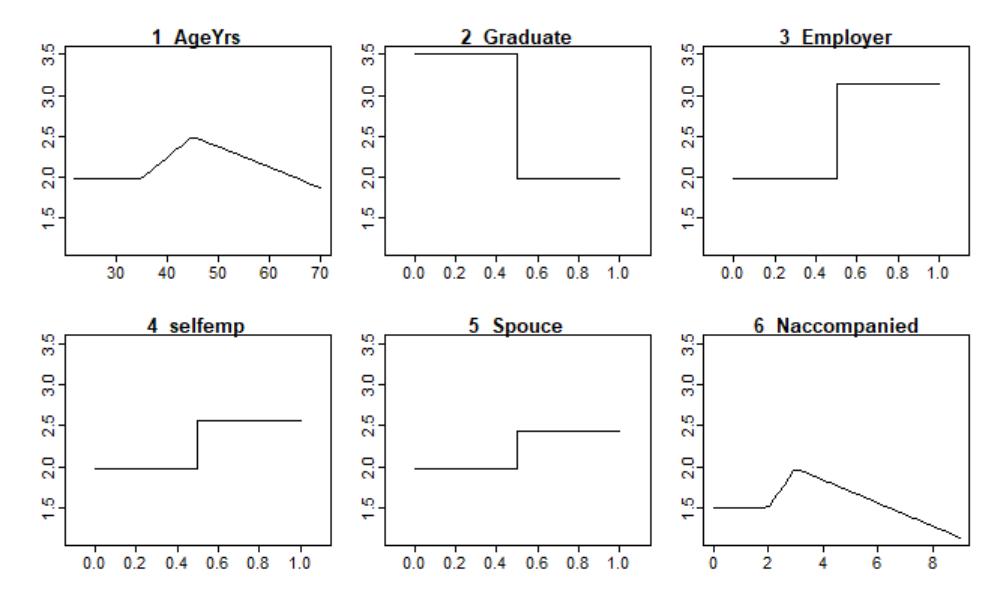
Figure 1. The number of persons in the group also shows similar nonlinear behavior (see figure 6)
The results of the MARS expressed in Table 3 are reproduced in equation format in equation 3. The R-squared value of the MARS model was 52.38%; this was higher compared to the R- squared value of multiple regression, which was 48.16%. Thus, the MARS model is a better fit compared to the multiple regression model. The MARS approach has another built-in ability to select only the important variables and drop variables that are not significant. The variables found to be unimportant were dropped in the MARS model in equation 3. We also produced variable importance scores of the multiple regression model and the MARS model in Table 4. These results show that education (graduate or above), and employer, are the two most important determining factors for LOS in both models.
Table 3. Results of MARS
| Variable | Estimate | Std. Error | t-value | |
|---|---|---|---|---|
| (Intercept) | 3.028 | 0.183 | 16.538 | *** |
| Graduate | -1.526 | 0.165 | -9.274 | *** |
| Employer | 1.164 | 0.348 | 3.345 | *** |
| Self-employed | 0.589 | 0.159 | 3.700 | *** |
| Spouse | 0.452 | 0.127 | 3.566 | *** |
| BF1: Max(0,(Age-35)) | 0.052 | 0.020 | 2.532 | ** |
| BF2: Max(0,(Age-45)) | -0.077 | 0.035 | -2.229 | ** |
| BF3: Max(0,(No-accompanied-2)) | 0.480 | 0.128 | 3.751 | *** |
| BF4: Max(0,(No-accompanied-3)) | -0.621 | 0.145 | -4.294 | *** |
Multiple R-squared: 0.5238473
Variables VIF VIF Graduate 100.00 100.00 Employer 40.85 56.97 Age 29.39 23.94 Spouse 21.49 46.92 No-accompanied 21.23 38.3 Male 17.93 0.00 Self-employed 14.51 25.82 Marital 14.33 0.00 Income 13.14 0.00 Friends 5.15 0.00 Student 4.44 0.00 Alone 2.31 0.00 Employee 0.72 0.00 Housewife 0.45 0.00
Table 4. Variable Importance Scores
5. Conclusions and Implications
The current study sought to find empirical evidence of the impact of sociodemographic variables of Indian domestic tourists on their LOS in destinations. The findings confirm that 'education,' 'age,' and tourist status as 'employers' were the most significant determining variables for the LOS of Indian domestic tourists. Age was found to be an important variable in the study by Lal et al. (2019) in the context of Indian domestic tourists. Further analysis, applying the MARS model, also showed that 'self-employed' tourists tended to travel more like those falling into the 'employed' category. The study also found that tourists traveling with spouses tended to have a longer LOS in the destination possibly due to less hurry to return home. The findings further suggest that the number of persons in the travel party also impact LOS at the destination. Up to two persons, the LOS remains unchanged; then it shows an increase up to three persons and thereafter declines. This indicates that couples accompanied by one child or another relative stay for a longer time. As the group size increases, the number of days of stay reduces possibly because of increasing expenditure and also the other's time availability in the group.
These findings can be leveraged by destination or tourism marketers by aiming to target the tourists between 35 and 45 years of age as they tend to stay for longer duration at the destination, thereby adding to tourism revenue. Since tourists in this age group may undertake travel for both pleasure and business purposes, the destination marketing organizations (DMOs) must create facilities that cater to both types of needs. Ideally, the destination should have meeting and conference rooms, business desks, secretarial assistance and, as well, a bar, good food, theme parks, and scenic beauty such as sea or mountains near the destination.
Destination marketers should also develop their tourist locations with the aim of attracting tourists beyond 45 years of age by adding attractions such as libraries and temples and, as well, health-related factors. By such means, destinations can be promoted as health-promoting, as mature tourists will be more interested in peaceful and health-supporting destinations than ones that offer fun and adventure. Altogether, an atmosphere that is serene and peaceful and promotes self-reflection will attract elderly tourists (45 plus age group). It is unnecessary for destination marketing organizations (DMOs) to incur extra costs to overly develop their destinations with too much modernization in order to attract such senior tourists, rather adding aesthetic values like beaches, cultural heritage, and historical relics might help them attract tourists in the age group of 45 plus.
Since findings further suggest that 'employers,' 'employed,' and 'self-employed' have higher propensity to stay longer, the DMOs should develop facilities that support business-related travel like conference halls, meeting rooms, Internet, secretarial assistance, bars, and business desks to attract this category of tourists. Optional facilities, such as gym, games room, swimming pool, spa, dance floor, and music, should be provided for entertainment as well. This study has shown that tourists accompanied by their spouses also tend to stay longer; hence, DMOs should target their promotional mix to attract couples, for example, giving extra discounts for the spouse; further, rooms should be designed to suit the requirements of a couple. Special honeymoon suites should be available for newly-married couples.
Since the present study also found that, up to three accompaniments LOS increases, marketers should keep this fact in mind while designing their marketing strategies as well as rooms and facilities. Extra discounts, for example, can be given for the third person accompanying the party either a child or one of the relatives or friends. Rooms must be designed in such a way that it can comfortably accommodate three people. Also, DMOs should pay attention to providing accommodation targeted at youngsters e.g., a playground, fun zones, and children's amusement center. Yoga centers may be provided for elderly parents accompanying the couple. Regarding the number of persons accompanying the traveler, our findings suggest that beyond the size of three persons, the LOS decreases, possibly due to increasing expenditures; hence, DMOs should invest in group transportation facilities and make available larger rooms with more beds at reasonable costs to motivate guests to stay longer. In general, the tourists traveling in large groups (four and above) should be incentivized to stay longer.
To conclude, the findings of the study may be summarized as follows, education, age, nature of employment (self-employed, employer, or employed), and the number of accompaniments are significant factors impacting the LOS of Indian domestic tourists. In our opinion, Indian destination marketers have yet to adopt a professional approach based on customer (tourists) consumption behavior analysis. As a result, they are not fully harnessing the market potential of the Indian domestic tourism market. Some suggestions have been provided for DMOs for refining their marketing mix to leverage these findings. More research is needed, including more variables on both larger and more heterogeneous samples for better generalization of the findings of this study.