
1. Introduction
The municipality of Tinambac offers a wide range of tourist destinations such as beaches, sanctuaries, and mangrove areas. It is uniquely bounded by the municipality of Siruma on the north, the pacific ocean on the northeast, San Miguel Bay on the west, the municipalities of Goa and Lagonoy on the east as well as the rivers of Himoragat and Timban on the south. As one of the coastal communities in Camarines Sur, Tinambac has been one of the target areas for research studies mostly on coastal resource management and fisheries development. Very limited studies are conducted on its tourism aspect. It is on this premise that the researcher initiated this undertaking.
The purpose of this study is to determine tourism suitability and assess the carrying capacity of selected tourist sites in Tinambac. Information that will be provided by this study can be used by the local government as their reference for the development planning of their tourism sites.
The paper begins with the background of the municipality of Tinambac, its geographical features, and the present status of their tourism potentials. Then it discusses the utilization of the tourism suitability index and carrying capacity in assessing selected tourist destinations of the municipality.
The measures were applied to the relevant data gathered from surveys and interviews conducted. Results of the tourism suitability summarized in a matrix table and computations for carrying capacity were presented. Finally, the paper provides recommendations based on the findings and analysis.
2. Study context and conceptual review
2.1. Tinambac and Status of Tourism
Tinambac is a Philippine municipality located in the province of Camarines Sur in the Bicol region. It is located about 26 km north of the province of Pili and about 265 km east-south-east of Metro Manila. The geographic coordinates are 13 49' 0" N, 123 19' 59" E. The municipality consists of 44 barangays, 6 of which are in the center of the municipality, and the remaining 38 are in the outlying areas. The urbanization status of this municipality is classified as partly urban. According to the 2015 Census, Tinambac has a total of 67,559 household populations. Residents are mainly Roman Catholic. They celebrate fiestas at the regional level (Feast of Our Lady of Penafrancia during September), municipal level (Feast of St. Paschal Baylon during May), and barangay level (Feast of St. Mary during August). The climatic classification of Tinambac is described as tropical climate. Heavy rains are expected between October to February. Two other phenomena that influence the area are the Intertropical Convergence Zone (ICZ) and the occurrence of cold fronts. The temperature drops as low as 18 degrees during this period. The municipality falls under the type II climate under the modified Corona Climate Classification System. This is characterized by the absence of dry season with a very pronounced maximum rain period during the months of December to January (tinambac.gov.pg/tourism).
The agricultural area of Tinambac is estimated to be 17,230 hectares, 96% of which are planted with coconut while only 4% are planted with rice, banana, and root crops. There are 17 barangays who rely on fishing as their main source of income. Among the barangays, the most important fishing areas are San Miguel Bay and Lamit Bay (tinambac.gov.pg/tourism). The data on the Philippines Statistics Authority in 2015 shows that 36% of the total gainful workers (7,604 out of 21,263) are skilled agricultural forestry and fishery workers. This is followed by elementary occupations (28% - 6,003) then service and sales workers (9.7%- 2,069). The primary livelihoods are crop farming, seaweed farming, and fishing. Peak seasons start from the month of March to June when the sea is calm.
One of the tourist destinations developed in Tinambac is the AGCA Marine Sanctuary. It was established in 2006 through a collaborative effort of people's organizations' SAMACA (Samahan ng Mangingisda ng Caloco) and KAAGAPAY, Network of Sustainable Livelihoods Catalyst, Inc. (a nongovernment organization), and Tinambac Local Government Unit (LGU). The sanctuary is for the purpose of marine biodiversity conservation and improvement in fish catchment of fishers. It does not only function to conserve a variety of animals and plants but also to attract tourists with natural resources such as coral reefs and mangroves. The name AGCA is coined from the first two letters of the Agay-Ayan and Caloco, because the sanctuary is located off the coast of Barangays Agay-ayan and Caloco in Tinambac. It is the first marine protected area in Lamit bay and Tinambac. This sanctuary has vast mangroves, seagrass beds, and coral reefs (AGCA MPA technical Working Group and AGCA MPA Management Committee, 2012). This study will only cover its mangrove as the basis for tourism assessment. The AGCA sanctuary is prohibited to tourists especially for snorkeling and diving. However, it allows boat tours to view an allowed area of the mangroves. Traditional fishing is also allowed only in buffer zones since the sanctuary is a marine protected area. Another tourist destination is the Tamban mangroves located a few kilometres from Agay-ayan and Caloco beaches. The Tamban mangrove is open for mangrove planting, boating, and research-related activities.
Adjacent to the AGCA sanctuary is two beaches–Agay-ayan and Caloco. Agay-ayan beach is under assessment by the local tourism management and is not yet listed among their tourist establishments. Caloco beach is a local government-owned beach resort that went viral on social media in the year 2017. It is one of the popular tourist beaches in Camarines Sur. The beach sites are open to various tourism activities like swimming, boating, sand playing, strolling, beach volleyball, and camping.
2.2. Tourism Suitability and Carrying Capacity
As of the moment, there are only a few kinds of research and limited data regarding the number of tourists' visits and potential tourist sites in Tinambac. In the emergence of sustainable tourism discourse, it is necessary that the concept of tourism suitability and carrying capacity is assessed. These two variables are possible indicators of the environmental condition of the tourist site. In one of the research findings conducted in selected tourist destinations in Indonesia, the increasing number of tourists has caused aquatic degradation, such as damages to coral reefs, a decrease in the number of species due to water pollution; discomfort among tourists/ visitors, and inadequacy of tourist facilities (Krhisnamurti et al. 2016, Supriharyono 2016). These conditions are making the areas not suitable for tourist destinations.
Suitability analysis determines the capability of an area for tourism development. It determines the suitability of a location for supporting and conducting various tourist activities (Lelloltery et al, 2018). The measurement of the Tourism Suitability Index (TSI) provides an assessment of the area conditions for tourism potential. Aside from determining the suitability of a particular tourism destination, another way to assess the area is by calculating its carrying capacity. The United World Tourism Organization (UNWTO) describes Carrying capacity as the maximum number of people that may visit a tourist site at the same time, without causing destruction of the physical, economic, socio-cultural environment and an unacceptable decrease in the quality of visitor's satisfaction (2012). There is not one simple measure of carrying capacity that can be applied to all destinations and attractions because they are not all homogeneous in their morphology and structure (Kennel, 2016).
Mismanagement of tourist sites brought by the breaching of the carrying capacity will lead to diversion of tourists to other destinations and decline of business opportunities. Tourism, in this condition, will cause negative impacts such as overcrowding and congestion, improper waste disposal, and inadequate supply of tourism facilities. On the other hand, tourist sites with managed carrying capacity will result in positive impacts such as conservation of important natural areas, improvement of environmental quality, and promotion of urban tourism enterprise (Prokopiou et al, 2013, Lickorich et al, 2000). Adopting the required carrying capacity of a certain tourist site will improve, if not maintain, its tourism suitability. Further, proper management of the utilization of tourism potential will result in ecosystem balance and sustainable tourism (Varelas and Belias, 2019).
3. Methodology
This study is focused on selected tourism sites in coastal areas of Tinambac. The area includes 4 tourism locations: Agay-ayan beach, Caloco beach, AGCA mangrove, and Tamban mangrove. The site locations were chosen purposively by considering its popularity and upon recommendation of the tourism office of Tinambac. Data collection was conducted between July to September of the year 2019. The data was collected in the form of primary and secondary data. Primary data was obtained directly from the location through observation, survey, and interview. Enumerators conducted the on-site observation and survey among 100 respondents (25 nearby residents/ visitors per tourist site). The secondary data was obtained from related studies and literature. These methods were conducted to investigate the perspectives of the relevant stakeholders and tourist site manager/in-charge on parameters needed for the assessment of tourism suitability and carrying
capacity of the area. Some data were verified and additional information was provided by the Tinambac Tourism officer.
Tourism Suitability Index (TSI) was determined using the table matrix below (Yulianda, 2006). It shall be noted that TSI for coastal beaches is assessed using 10 parameters while TSI for mangroves is assessed using 6 parameters. These are the parameters that support or contribute to the satisfaction of the tourist activities. The assessment was based on scoring and the value indicated by the score. Criteria under S4 are considered as most appropriate for tourism destination; S3 as appropriate, S2 as conditional and S1 as not appropriate for tourist destinations.
Under the area characteristic of tourism suitability for mangroves, four requirements are being assessed for tourism potential. These are (1) existence of an interesting natural object, (2) aesthetic and scenery emphasizing the visual beauty orientation of an area, (3) landscape such as mountain hill, bays, river, and ; (4) flora/fauna which are being protected. Four requirements are also assessed under accessibility. These are (1) safe road towards the location, (2) several alternative roads, (3) several transportation means, and (4) supporting facilities such as dock (Nelly et al. 2019). The presence of 4 requirements for each parameter corresponds to 'very feasible', 3 requirements is 'feasible', 2 requirements as 'conditional' and 1 requirement is 'not feasible'.
Tourism Suitability Index (TSI) is computed as follows (Yulianda, 2006; Simanjuntak and Supriharyono, 2018):
TSI (%)= \[\frac{\sum Ni}{\sum Nmax} \times 100\%\]
Where Ni = score for each affecting factor, ( a x ci) ;
Nmax = 84, maximum score for tourism activities/features
Table 1. Matrix of Site Tourism Suitability for Coastal Beaches
| Ref. | Parameters | • | • | Car | tegories and Scores | • | _ | ||||
|---|---|---|---|---|---|---|---|---|---|---|---|
| KCI. | 1 arameters | Ranges | S1 | Score | S2 | Score | S3 | Score | TS | Score | Nmax |
| a | c1 | c2 | c3 | c4 | |||||||
| 1. | Water depth (m) | 5 | 0-3 | 3 | >3-6 | 2 | >6-10 | 1 | >10 | 0 | 15 |
| 2. | Beach types | 5 | White sand | 3 | White sand w/ some reef | 2 | Black sand, some rocky reefs | 1 | Mud, rocks | 0 | 15 |
| 3. | Width of beach (m) | 5 | >15 | 3 | 10-15 | 2 | 3 - <10 | 1 | <3 | 0 | 15 |
| 4. | Water basic materials | 3 | Sand | 3 | Sandy reefs | 2 | Muddy sand | 1 | Mud | 0 | 9 |
| 5. | Waves (m/s) | 3 | 0 - 0.17 | 3 | 0.17 - 0.34 | 2 | 0.34 - 0.51 | 1 | >0.51 | 0 | 9 |
| 6. | Beach slope (o) | 3 | <10 | 3 | 10-25 | 2 | >25 – 45 | 1 | >45 | 0 | 9 |
| 7. | Water brightness (%) | 1 | 80-100 | 3 | 50 - <80 | 2 | 20 - <50 | 1 | <20 | 0 | 3 |
| 8. | Coastal areal coverage and shades | 1 | Coconut trees, open space | 3 | Bushes (low/tall), savanna | 2 | Tall bushes | 1 | Mangrove forest, residential area | 0 | 3 |
| 9. | Dangerous Biota | 1 | None | 3 | swine | 2 | Jellyfish or Jellyfish and swine | 1 | Jellyfish, stingrays, sharks, stonefish | 0 | 3 |
| 10. | Freshwater availability (km) | 1 | <0.5 | 3 | >0.5 - 1 | 2 | >1-2 | 1 | >2 | 0 | 3 |
| Beach | n slope: <10o flat beach, 10-25o | moderate, | 0.34-0.51o steep |
Table 2. Matrix of Site Tourism Suitability for Mangroves
| D . C | D | D | Categories and Scores | ||||||||
|---|---|---|---|---|---|---|---|---|---|---|---|
| Ref | Parameters | Ranges | S1 | Score | S2 | Score | S3 | Score | TS | Score | Nmax |
| a | c1 | c2 | c3 | c4 | |||||||
| 1. | Mangrove Density (100 m2) | 4 | >15 - 25 trees | 4 | >10 - 25 trees | 3 | 5-10 trees | 2 | >5 trees | 1 | 16 |
| 2. | Mangrove Species | 4 | >5 | 4 | 3 - 5 | 3 | 1 - 2 | 2 | 0 | 1 | 16 |
| 3. | Tidal (m) | 3 | 0 - 1 | 4 | >1 - 2 | 3 | >2-5 | 2 | >5 | 1 | 12 |
| 4. | Biota Object | 3 | Fish, shrimps, crabs, bird, mollusk, reptile | 4 | Fish, shrimps, crab, mollusk | 3 | Fish, mollusk | 2 | One of aquatic biota | 1 | 12 |
| 5. | Area Characteristics | 3 | 4 requirements | 4 | 3 requirements | 3 | 2 requirements | 2 | 1 requirement | 1 | 12 |
| 6. | Accessibility | 4 | 4 requirements | 4 | 3 requirements | 3 | 2 requirements | 2 | 1 requirement | 1 | 16 |
The Suitability Tourism Index (TSI) percentage can be interpreted and classified into 4 categories. This is shown in the following tables.
Table 3. Adjectival Interpretation of the TSI (%) for Coastal Beaches
| Categories | TSI Score (%) | |
|---|---|---|
| Very Appropriate (VA) | 83-100% | |
| Appropriate (A) | 50- < 83% | |
| Conditional Appropriate (CA) | 17 - <50% | |
| Not Appropriate (NA) | Less than 17% | |
Table 4. Adjectival Interpretation of the TSI (%) for Mangroves
| Categories | TSI Score (%) |
|---|---|
| Very Feasible (VF) | 80-100% |
| Feasible (F) | 60- < 80% |
| Conditional (C) | 35 - <60% |
| Not Feasible (NF) | Less than 35% |
If the tourist site is rated as appropriate, carrying capacity is calculated. The calculation is intended to reduce the impact of over-capacity in tourist sites (Simanjuntak and Supriharyono, 2018).
The calculation of carrying capacity is measured using the Boullon's Carrying Capacity Mathematical Model (BCCMM). The value of carrying capacity using this model is measured at three levels: basic carrying capacity (BCC), potential carrying capacity (PCC) and carrying capacity of the area (CCA).
Basic Carrying Capacity (BCC) is obtained by computing for the quotient of area open for visitor's use (LA) and average visitor's standard area used (LS). The area open for visitors use in square meters (LA) is the total area of the tourist site obtained using the Google earth. The average visitor's standard area occupied for beach is 2500 square meters (Yulianda, 2006) and 1,000 square meters for the mangroves based on interview with Tourism management.
Basic Carrying Capacity (BCC) = \[\frac{Area open for visitors' use in sqm (LA)}{Average Visitors' standard area used (LS)}\]
Potential Carrying Capacity (PCC) is obtained by getting the product of BCC and Rotation Coefficient. In RCC computation is done by dividing the total number of hours the site is open for use (TT) by the average number of hours an area is used by visitors (TV). The PCC determines the maximum permissible number of use of an area once the limiting factors have been applied. Only two limiting factors were considered in this study. These are average occurrence of typhoons in a year (Lf1) and average number of hours of intense sunlight in a day (Lf2). Based on the Philippine Tropical Cyclone Summary from 1998-2010, an average of 20 typhoons hit the country every year (Typhoon 2000.com). There is an average of 6 hours (10 am to 4pm) intense sunlight in a day. The limiting factors are factors which limits visits to the tourism site.
Rotation Coefficient (RC) = \[\frac{Total\ no.of\ hours\ a\ specific\ area\ is\ open\ for\ use\ (TT)}{Average\ no.of\ hours\ an\ area\ is\ used\ by\ visitors\ (TV)}\]
Potential Carrying Capacity (PCC) = BCC x RC
Limiting factors:
\[Lf1 = \frac{Typhoons\ in\ a\ year}{365} \ge 100\] \[Lf2 = \frac{Intense\ sunlight\ in\ a\ day}{Time\ (hours) beaches\ are\ open\ in\ a\ day}\]
Finally, the CCA is computed by using the formula below.
Carrying Capacity of the Area (CCA) = PCC x \[\frac{100-Lf1}{100}\] \(x \frac{100-Lf2}{100}\)
4. Results and Analysis
Based on the interviews with local tourism management, several tourists visit Caloco beach during summer while mangroves are usually chosen by some academic institutions for their community outreach for their mangrove planting activities. This is usually scheduled during the end of semester. So far, there is no evidence that the environmental quality and tourist comfort level (like nonavailability of facilities) has declined. Results of KSA (Knowledge Practices and Attitudes) survey conducted in 2012 confirmed high level of community participation with regards to protection of AGCA sanctuary and conservation of marine resources (AGCA MPA 2013-2015).
4.1 Weaknesses in leverage strategies
To assess the parameters for tourism potential of the tourist sites under study, tourism suitability was computed. The results of the tourism suitability index for the 4 selected tourist sites (2 beaches and 2 mangroves) are shown in the following table. The tourism suitability index is a criterion of resources and required environmental conditions for the development of tourism (Simanjuntak and Supriharyono, 2018; Akla 2019).
Table 5. Score of Tourism Suitability Index for Coastal Beaches
| Ref. | Parameters | Ranges | Agay-ayan Beach | Score | N1 | Caloco Beach | Score | N2 |
|---|---|---|---|---|---|---|---|---|
| a | b | c | a x c | b | c | a x c | ||
| 1. | Water depth (m) | 5 | 0 − 3 | 3 | 15 | 0 − 3 | 3 | 15 |
| 2. | Beach types | 5 | White sand with reef | 2 | 10 | White sand with reef | 2 | 10 |
| 3. | Width of Beach (m) | 5 | >15 | 3 | 15 | >15 | 3 | 15 |
| 4. | Waters basic materials | 3 | Sandy reefs | 2 | 6 | Sandy reefs | 2 | 6 |
| 5. | Waves (m/s) | 3 | 0.17-0.34 | 2 | 6 | 0.17-0.34 | 2 | 6 |
| 6. | Beach slope (o) | 3 | Less 10o | 3 | 9 | Less 10o | 3 | 9 |
| 7. | Water Brightness | 1 | 80-100% | 3 | 3 | 80-100% | 3 | 3 |
| 8. | Coastal areal coverage and shades | 1 | Mangrove forest, residential area | 0 | 0 | Coconut trees, open space | 3 | 3 |
| 9. | Dangerous Biota | 1 | Sharks, stingrays, jellyfish | 0 | 0 | jellyfish | 1 | 1 |
| 10 | Freshwater availability (km) | 1 | >2km | 0 | 0 | >2km | 0 | 0 |
| Total | 64 | 68 | ||||||
| Tourism Suitability Index (TSI, %) | 76.19% | 80.95% | ||||||
| Category | A | A |
Based on the table, the tourism suitability index (TSI) for the coastal beach category is 'appropriate (A)' for both Agay-ayan (76.19%) and Caloco beach (80.95%). Although for Agay- ayan beach, some parameters were rated not appropriate namely 'coastal areal coverage and shades', 'dangerous biota' and 'freshwater availability'.
Since Caloco beach is adjacent to Agay-ayan beach, both share almost the same features. Water depth is measured 3 meters or approximately 10 feet from the coastline to 200m distance towards the sea. Tourist activities usually are done not more than the 200 m distance (Simanjuntak and Supriharyono, 2018). The depth of the waters is an important aspect in determining coastal tourism areas specially for swimming activities. Most activities are done in shallow waters because of safety and security (Yulisa et al, 2016). The type of beach for both Caloco and Agay-ayan is white sand with reef. Tourists are generally more attracted to white sand compared with black sand, muddy, or rocky ones (Simanjuntak and Supriharyono, 2018).
The width for both beaches is more than 15 meters. Tourists enjoy a much wider area for more tourism activities such as beach volleyball, walking, sand castle building or camping. The wider the area of the beach, the higher is the tourist mobility (Tambunan et al. 2013). The basic material in the water is generally sand. This makes it more suitable for tourists compared with beaches with sandy reefs or mud. Condition in the water 200 meters from the coastline is weak with only 0.17-0.34 m/s of waves according to visitors interviewed. Currents in the water affect the tourism potential. Higher waves make it unsafe for children.
The beach slope is categorized as flat beach because of the angle of less than 10 degrees. The water brightness is 80-100% because of its clear reflection underwater. The brightness values can be influenced by its depth (Wijaya et al. 2018, Hasriyanti, 2018). Light penetrates through the bottom of shallow waters. Materials or substrates of water base may also determine water brightness (Yulisa et al, 2016). Mangroves, coconut trees and residential are sighted in the nearby surroundings of Agayayan beach. While presence of coconut trees and open space best describe areal coverage of Caloco.
The dangerous biota was one of the parameters in tourism suitability to anticipate possible dangers that tourist might encounter (Simanjuntak and Supriharyono, 2018). The dangerous biota commonly found in both beaches is the jellyfish. Although according to some visitors, net has been installed around Caloco beach to filter out possible surge of jellyfish. The tourism management have confirmed presence of other dangerous biota (such as sharks and stingrays) in Agay-ayan. Fresh water is not sufficient in both beaches with the distance of more than 2 kilometers from the tourist site. The availability of fresh water is very important in life, including tourism activities (Yulisa et al, 2016).
The two coastal beaches are both categorized as appropriate or suitable for tourism destination. Such condition opens business opportunities in the community. The potential for economic development of the tourism sector is determined by the nature of the environment and the structured management (Bunghez, 2016).
Based on the output on the Suitability Index for Mangroves as shown in the following table, the result of the Tourism Suitability Index (TSI) for the two mangroves is 'very feasible', 86.90% for AGCA mangrove and 91.67% for Tamban mangrove. The TSI is very good criteria to be used in assessing mangrove ecotourism (Prihadi et al, 2018).
AGCA Tamban Ref Parameters Ranges Score N<sub>1</sub> Score N2 Mangroves Mangrove b b C ахс C ахс 1. Mangrove >15-25 4 >15-25 4 16 16 Density (100m2) 2. Mangrove Species 4 4 16 4 16 >5 3 9 3 9 3. Tidal (m) 3 >1-2 >1-2 4 Biota Object 3 Fish, shrimps, 4 12 Fish, shrimps, 12 crabs, bird, crabs, bird, mollusk, reptile mollusk, reptile 5. 3 4 requirements 12 4 requirements 12 Area Characteristics 4 8 12 6. Accessibility 2 requirements 2 3 requirements 73 77 Tourism Suitability Index (TSI, %) 86.90% 91.67% VF VF Category
Table 6. Score of Tourism Suitability Index for Mangroves
Nmax = 84
The two mangroves – AGCA and Tamban is more than 200,000 square meters. Though no research yet is conducted in evaluating its biodiversity (Demesa, 2012), on-site inspection of the enumerators estimated that there are 2-3 mangrove trees/m2 or approximately 27,000 trees/ha or 270 trees/100 m2. Mangroves density can be classified as dense, moderate and sparse. The abundance of dense mangroves show a good health status manifested through tall stature, fine distributions, diversity extent, and excellent local habitat for the mangrove growth (Rosalina 2015).
According to the tourism management, their Mangrove Ecosystem Learning Site has identified 24 mangrove species in AGCA while a study conducted by Partido Development Administration (2017) has identified 8 mangrove species in Tamban mangrove. These are: Rhizophora stylosa, Rhizophora apiculata, Rhizophora mucronata, Xylocarpus granatum, Bruguiera cylindrical, Aegiceras corniculatum, Sonneratia alba and Ceriops decandra.
Species diversity can be used to determine environmental stability. The higher species diversity, the more stable the ecosystem (Nelly et al. 2019). Since AGCA is marine protected area, it has become a breeding ground of various biota such as crabs, fishes and shells of different types. Residents near the two sites have observed the presence of these animals. Some popular biota found in these mangroves are fishes (local names: balanak, ongok, tilapia, aliso, pugapo, tingarog, pahak, buroy, bakla, kikiro, turos, dumudurog, bakagan), crabs (an-it, kasag, ugama, kalampay, bungkangm kalasakas), shells (tahong, kapis,talaba, takal, bugitis, punaw, bukawil, bagongon, baloog, suso, tuhoy, ugpan), reptiles (kikig, tamilok, yamit-yamit, walo-walo, ogdok, kasili) tahong, oysters (talaba), ogdok, kasili, sugpo, punaw, bugitis, tabal-tabal,bangongon) and shrimps (sugpo, pasayan, usbon, balaw, ananakla, buyod, swahe and bilogon). The presence of mangrove biota objects provides satisfaction for visitors and more value to a mangrove ecotourism area (Nelly et.al, 2019).
High tide may appear at approximately 2 meters. Tidal is the periodic process of up and down of seawater affected by the attraction force between the moon and the sun (Dahuri, 1996). Based on the assessment, the characteristic area in the two mangroves studied meets the 4 requirements. AGCA mangrove has displayed amazing natural environment while Tamban mangrove prides itself with its pristine and abundant trees. The landscape of Lamitan bay makes it more attractive. On the other hand, only 3 requirements under accessibility were satisfied by Tamban mangroves. There is accessible road going to the area and it is accessible through various means of transportation such as motorcycle, boat, and both private and public vehicles. On the other hand, only two requirements are satisfied by AGCA Mangrove under accessibility. Although several alternative roads can be used to reach the area, vehicles cannot pass through because of rugged terrain. Visitors or tourists need to walk few meters going to the area or they can ride a boat (dock is available) to see the other side of the mangroves. More access to the location means more number of tourist visits (Nelly et al, 2019).
The total suitability scores obtained for AGCA mangrove is 86.90% and Tamban mangrove is 91.67% which are both interpreted as 'very feasible (VF)' or very suitable for tourist destination. One of the reasons for the remarkable rating is the strict implementation of conservation and preservation measures by the local government as part of their MPA (Marine Protected Area) Management Plan for AGCA Sanctuary. Moreover, the Knowledge, Attitude and Practices (KAP) survey last 2012 revealed high level of participation of the community towards the protection of AGCA marine sanctuary (Demesa, 2012, Verissimo et al, 2016). Based on the interviews, all barangays in Tinambac with mangrove plantation are under the program - 'Reforestation/Restoration of Coastal and Upland Habitats'. There is an assigned deputized fish warden ('Bantay Bakhawan' or "Bantay Dagat') for each barangay who is in charge in safeguarding the area. Mangrove replanting has been conducted and maintained in the area.
Based on the suitability analysis, the results indicate the capability of these 4 tourist sites to support various tourism activities. With this, the need for the tourism management to determine its carrying capacity is a must to sustain the suitability environment of the area.
4.2 Carrying Capacity of Selected Tourist Sites in Tinambac
The tourism suitability index of the 4 tourist sites evaluated obtained ratings of 'appropriate' to 'very appropriate' for tourism destination For sustainability, carrying capacity should be assessed to improve, if not maintain, the tourism suitability of the four tourist sites mentioned. The carrying capacity of an area is the maximum number of visitors who can physically be accommodated by the area at a certain time without causing environmental deterioration and human dissatisfaction (Hamzah 2012). This is related to the ability of the area to accommodate various tourism activities (Lelloltery, 2017).
The calculation of Carrying Capacity of the Area (CCA) of the selected tourist sites is presented in the following table.
| Ref. | Location | LA (m²) | LS (m²) | всс | TT (hours) | TA (hours) | RC | CCA (BCCxRCxLF) |
|---|---|---|---|---|---|---|---|---|
| 1 | Agay-Ayan beach | 44,716 | 2,500 | 18 | 24 | 6.9 | 3.4 | 43 persons per day |
| 2 | Caloco beach | 70,685 | 2,500 | 28 | 24 | 8.0 | 3.0 | 60 persons per day |
| 3 | ACGA Mangrove | 217,000 | 1,000 | 217 | 12 | 3.4 | 3.5 | 359 persons per day |
| 4 | Tamban | 215,787 | 1,000 | 216 | 12 | 2.0 | 6.0 | 612 persons per day |
| Mangrove |
Table 7. Carrying Capacity of Selected Tourist Sites in Tinambac
Limiting factors:
Lf1 = \[\frac{\text{Typhoons in a year}}{365} \times 100 = \frac{20}{365} \times 100 = 5.47\]
Lf2 of beaches:
\[Lf2a = \frac{Intense sunlight in a day}{Time (hours) beaches are open in a day} \times 100 = \frac{6}{24} \times 100 = 25\]
Lf2 of mangroves:
\[Lf2b = \frac{Intense sunlight in a day}{Time (hours) mangroves are open in a day} \times 100 = \frac{6}{12} \times 100 = 50.00\]
Limiting factors of Beach:
LFa = \[\frac{100 - Lf1}{100} x \frac{100 - Lf2a}{100} = \frac{100 - 5.47}{100} x \frac{100 - 25}{100} = 0.9453 \times 0.75 = 0.709\]
Limiting factors of Mangrove
LFb = \[\frac{100 - Lf1}{100} x \frac{100 - Lf2b}{100} = \frac{100 - 5.47}{100} x \frac{100 - 50.00}{100} = 0.9453 x 0.5000 = 0.4723\]
The computed Carrying Capacity of an Area (CCA) for the 4 tourist sites were different even if situated in only one location. To maintain the environmental quality and tourists' level of comfort, the required carrying capacity for Agay-ayan beach is 43 persons per day, 60 persons per day for Caloco beach, 359 persons per day for AGCA mangrove and 612 persons per day for Tamban mangroves.
Both Agay-ayan and Caloco beach are open 24 hours while AGCA mangrove and Tamban mangroves are open for day tour only. Agay –ayan beach is under assessment by the local tourism management. Though this is not yet fully developed, tourists visit the site already during summer. On typical days (weekdays or non-holiday or working days), the number of tourists visits on these sites are very low as observed by residents nearby.
The summary report of visitor's tourist arrival in Caloco beach provided by the tourism management is shown below. Since the data available is only the yearly number of tourist visits, numbers of monthly and daily visits were estimated. The estimation was computed in a 4-month period considering that peak season is from March to June.
As shown in the following table, it has a total of 14,243 tourist visits in 2016 which gives an estimate of 3,561 visits per month or approximately 119 visits per day which is above the carrying capacity. An increase in 2017 was noted with a record of 20, 495 tourist visits or 5,124 in a month or approximately 171 tourist visits per day. While in 2018, it decreases to 17, 229 tourist visits or an estimated 4,307 visits per month or approximately 144 visits per day. It shall be noted that from year 2016 to 2017 the number of tourist visits exceeded the carrying capacity of the site. The figure shows it exceeded the highest in 2017 which is about 118 tourists/visitors. The lowest number of tourist visits was recorded in 2019 with 6,043 or approximately 1,511 per month or 50 per day, a favorable record which is below the carrying capacity. According to the tourism management, less promotion was conducted on the said tourist site because of the very low water level brought by persistent drought.
Table 8. Visitor's Tourist Arrival Summary Report for Caloco Beach
| 2016 | 2017 | 2018 | 2019 | ||
|---|---|---|---|---|---|
| No. of Tourist Visits per Year | 14,243 | 20,495 | 17,229 | 6,043 | |
| Estimated No. of Tourist per month | 3,561 | 5,124 | 4,307 | 1,511 | |
| Estimated No. of Tourist per day | 119 | 171 | 144 | 50 |
Source: Municipal Tourism Office, 2020
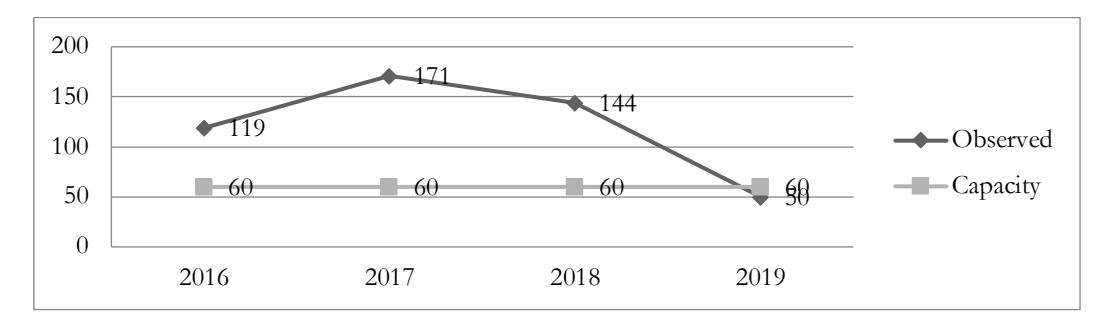
Figure 1. Visitor's Tourist Arrival per Day in Caloco Beach from 2016 to 2019
Activities conducted by visitors in AGCA mangrove are mostly sight-seeing or boat tours. They are not allowed to get inside since it is a marine protected area. Fishing is also allowed only in buffer zones. For Tamban mangrove, the tourism activity is usually mangrove planting and boat tour which is participated mostly by students. Since no records of the daily number of visitors were available for these two mangroves, it was estimated by the tourism management that the number of tourist visits is way below the computed carrying capacity.
Based on the results of the survey conducted, the majority of the respondents (n=100) who visit the selected tourist sites of Tinambac are mostly female (63%) and married (65%). The demography of the respondents is in general adult visitors (84%) ranging from 25 to 64 years old. Less than half of them are high school graduates (41%), 29% are elementary graduates and only 27% are college graduates. Twenty-six percent of the respondents are fishermen and farmers.
On average, they earn monthly income amounting to approximately Php11, 876. Twelve percent of it they allot for recreational expenses. Most of it is allotted for food which is approximately 53% of their monthly income. In general, these visitors come alone (55%) or with groups of friends (67%). If with friends, they usually come in a group of 7 persons. On average, they would visit in a group of 7 people. The top 3 reasons for them in visiting the sites are: (1) relax and escape city life (swim, kayak, hike, etc.), (2) enjoy nature (watch wildlife, recreational hunting/fishing, etc.); and (3) see unique features of the site(s).
The equipment or gears that they usually bring our swimming gears, camping tools, and diving gears. The top 3 recreational activities when visiting a tourist site are swimming, boating and sightseeing. The facilities that they deem important and should be available in these tourist sites are maps, directions, precaution signs, and a tourist information center. On take-off points, safety reminders and warning signs should be available. Availability of waste disposal is also surveyed as one of the top necessities. To promote sustainability in these tourist sites, the management should be able to determine the profile of its visitors/tourists (Zelenka et al. 2014).
5. Conclusion and Recommendation
The tourism suitability index for Agay-ayan beach, Caloco beach, AGCA mangrove, and Tamban rove are 76.19%, 80.95%, 86.90%, and 91.67% respectively. The carrying capacity calculated 3 persons per day for Agay-ayan beach, 60 persons per day for Caloco beach, 359 persons per day tor AGCA mangrove, and 612 persons per day for Tamban mangrove.
The 4 tourist sites of Tinambac are assessed to be suitable for tourist destinations. Although there are different carrying capacities for each site, it has not exceeded the required capacity.
The result of suitability analysis implies the situation in these 4 tourist sites is well managed as it did not cause any environmental damage or decline in environmental quality as evidenced by the high rating of tourism suitability. In general, these 4 tourist sites seem unspoiled for mass tourism.
The general recommendation is for the Tourism Management of Tinambac to prevent the onslaught of mass tourism in these coastal tourism sites by implementing sustainable tourism in these aspects:
- a. Implementing a quota system on entry and length of stay during peak season, with early public dissemination of the quota system and setting-up of an online reservation and booking system;
- b. Strict enforcement of solid waste management strategies such as zero-residual waste policy, waste segregation to support local recycling and waste conversion (e.g., composting) activities if existing;
- c. Improvement of visitor safety management such as providing or improving location signage, setting up signage in no-entry areas, and disseminating safety tips and reminders before and after visits;
- d. Institutionalizing sustainable tourism that recognizes the balance between tourist suitability and carrying capacity through policy or local ordinances. The policy would be aimed at managing tourist visits and activities in ways that would limit the increase at levels negatively impacting the environment (Pickering and Hill, 2007);
- e. The institutionalization of these measures through policy: (i) limits to congestion during peak season, and setting the regeneration period for beaches and mangroves during off-peak season; (ii) tapping existing organizations and communities in community-based or partnership monitoring (Rhormens et al., 2017) with adequate provisions for funding and technical assistance; and, (iii) knowledge transfer and exchange on tourism sustainability and carrying capacity with the academe, government agencies, non-government organizations, and research firms, particularly through the use of science, technology, and communications to facilitate learning more effectively.