
1. Introduction
The tourism industry has grown significantly in the present day, and several sectors are involved in the tourism industry including hotels, restaurants, airlines, theme parks, cruise liners and other attractions and other means of entertainment that support tourists' satisfaction. With these massive opportunities, it increases and creates the number of intermediaries, generally known as the travel agencies. Travel agencies are referred to the private retailers' company that sell ready-made holiday packages to the customers on behalf of tourism industry suppliers, and the travel agencies' profits are from the commission fees given from suppliers (Kozlova, 2014).
However, the advances of the technologies are challenging the intermediaries, where the tourism and travel industries suppliers such as airlines and hotels started decreasing the number of intermediaries by cutting the commission of each product and services sold by travel agencies. This is because the suppliers can meet the customers directly "anytime and everywhere" through their internet websites. Thus, this issue has adversely affected the travel agencies, as their markets are declining, because people tend to go directly to the suppliers. On the other hand, this research analyses the factors that make traditional travel agencies retain their market and identifies why customers still prefer to visit traditional travel agencies, especially in the present era where the internet has taken over.
The current study was conducted with an aim to identify and analyse the factors that influence the local people preferences to visit traditional travel agencies in Banjarmasin, Indonesia. Current research focuses on "Banjarmasin", the capital city of South Kalimantan, Indonesia. Therefore, the data was collected in Banjarmasin. Several traditional travel agencies mostly SMEs (Small and Medium Enterprises) are available, and they still have their market. There are several reasons why people in Banjarmasin still prefer to visit traditional travel agencies. It was found out that people in Banjarmasin still trust traditional travel agencies to assist their travel plans. To accomplish the aim of the study five objectives were formulated: to identify the factors that have strong influences on people to visit traditional travel agencies in Banjarmasin, Indonesia; to find the impacts of online bookings on traditional travel agents in Banjarmasin, Indonesia; to analyse the market opportunity of traditional travel agencies in Banjarmasin, Indonesia; to analyse the behaviour of customers' decision making in purchasing travel service from a traditional travel agency in Banjarmasin, Indonesia and to provide suggestions to traditional travel agents to improve their service to cope with rapid advances of technology.
2. Literature Review
2.1. The expertise of travel agent
After the price component, reputation and trustworthiness are the factors that attract customers to choose any distribution channel (Chiam et al., 2009). Numerous authors have confirmed that travel agents are the experts for advising tourists regarding visa, ticketing, insurance, and other travel itinerary bookings. The knowledge and experience of the travel agents is the main factor influencing consumers to choose them, followed by the helpfulness of travel agents (Ng et al., 2006). Travel agents are the proficient personnel to know about low and peak season of the tourism products (Stewart, 2005). Besides planning and bookings for the tourists, travel agents also counsel the tourists with their strong network (Anckar & Walden, 2008) and can be professional infomediaries providing expert first-hand knowledge of destinations and exclusive access to its products. This way, they can offer a more customized and authentic experience (Abrate et al., 2020; McKercher et al., 2003). In the current time, though there is several online tourism portals, tourists visit to traditional travel agents to get a clear picture of the destination, get a human touch and several travel itinerary tips (Bogdanovych et al.,2006). It is also observed that Traditional travel agencies continue their position due to their capability of advising and counselling traveller, which are hard to find in the online
options (Turgay, 2013). Salomon (2013) also revealed four significant reasons for tourist visits to travel agents which include customer advocacy, expert guidance, first-hand experience and personal advice and service.
2.2. Social interaction service
Social interaction is one of the advantages while booking with travel agencies, that establishes long term relationship (Tugulea et al., 2014). Prasarnphanich & Gillenson (2003) state that 'social interaction is the key to good customer's experience'. Several authors, including Bennett & Buhalis (2003), Bogdanovych et al. (2006) confirmed that face-to-face interaction builds trust and make a customer loyal to the travel agents. Through face-to-face contact, tourists get a better understanding of the travel itinerary and can negotiate with the travel agents, which is not possible through an online portal. Personal service and friendly nature of travel agents are significant factors that make customers choose them over online portals (Wolfe et al., 2004). Only through direct contact, customer service staff can easily understand tourist's nonverbal behaviour and tourist's feelings (Lewis, 2015; Varadarajan & Rajaratnam, 1986). Besides, face-to-face interaction might also increase the level of service empathy, which leads to customers' satisfaction as the customers feel convenient for the service given by traditional travel agents (Castleberry & Shepherd, 1993).
2.3. Secure transaction
Obviously, in the current time people feel comfortable with booking online, as they have several options to perform payment transactions. However, on other hand, literature also supports that tourists still hesitate and do not trust the online payment system (Kim, Kim & Leong, 2005). Tourists do not feel secure and have a financial risk feeling while paying online. Travel agents, with a strong network with tourism product suppliers can do the transaction on behalf of tourists that reduces the tourist's risk and make them feel comfortable (Trivedi, Morgan & Desai, 2008, Turgay, 2013). Convenience, security, peace of mind, freedom from worry and trust are the main reasons to prefer travel agents (Quintana et al., 2016).
Stewart (2005) also supports the literature that tourists feel more secure and have higher trust when they are interacting with travel agents rather than websites, which means the security with a human is still higher. The traditional travel agents can reduce the financial risk combined with professional counselling (Chiappa, 2013). Jiménez-Zarco et al. (2011) confirmed two major reasons regarding the lack of trust of tourists in online suppliers: (1) The relationship is taking place in a new area (online website), where it creates uncertainty and probably insecure regarding; destinations or suppliers which are unknown to travellers. (2) Incomplete, partial or biased information that is available to the customers makes them revert to more secure options, which probably a traditional travel agent offers.
2.4. Handling capacity
Handling capacity refers to the 'ability to handle several individual tourists or group booking'. Handling complexity is one of the significant priorities while planning a trip (Cheyne et al., 2006). Usually, Travel agents give services to corporate clients and handle big travels groups (Werdiningsih, 2015). Traditional travel agents are the most preferred ones for, complicated trips and by a section of business travellers (Chiappa, 2013). Several travel activities regarding MICE are widespread in current time, including, conferences, exhibitions, meetings, and incentives groups. Travel agents offer service in assisting the complex booking process, generating PNR for several tourists together along with multi-destination flights (Buhalis & Law, 2008). Moreover, a traditional travel agent can do bulk reservation for the group by using GDS (Sabre, 2015).
2.5. Technological adoption
The internet is one of the leading technological advancements of this era, which created opportunities for the supplier to meet customer online – face to face. It is also essential for the tourists to have a good knowledge and ability to perform booking online; otherwise, technology adoption can be a barrier for the tourists (Anckar & Walden, 2001). Not only the tourists, but it is also essential for the travel agents to adopt the technology and integrate digital channels to maintain their position in the market (Capriello & Riboldazzi, 2020; Chiappa, 2013). Advantage and complexity are the two major perceiving factors for the tourists while adopting technology (Moital, Vaughan, Edwards & Peres, 2009). Younger tourists often tend to find information and tour dals online but prefer travel agencies for safety reasons (Seočanac et al., 2019). In the year 2014, there were only 17.1% of the total population of Indonesia who used the internet frequently (Ivanic and Martin, 2014).
By 2018, though the number of internet users saw a substantial increase to 47.6% and bagged 4th place among the countries with highest number of internet users, the online shoppers and speeds of available internet are relatively low. Majority of the internet users fall in the age group of 12-34 years and used internet for 5 hours a day on average (The Jakarta Post, 2012). Only five major cities of Indonesia have a good internet speed and Banjarmasin is not among those (Reza, 2015). Unavailability of internet facilities and computer illiteracy will foster the demand for traditional travel agents (Mayr & Zins, 2009). Thus, people in Banjarmasin still rely on traditional travel agents for their travel bookings.
2.6. Habitual selection behaviour
Hawkins, Best, & Coney (1995, p. 425) explained that involvement and level of decision-making are the two significant variables while discussing consumers' decision processes. If involvement refers to the face-to-face interaction of individuals, High involvement purchase refers to general problem solving, whereas habitual selection behaviour is associated with low involvement purchase (Hawkins et al., 1995). The tourism products are associated with high and low involvement as the products differ in nature (Sirakaya & Woodside, 2005). A leisure trip to other country contains high-perceived risk and therefore high involvement is required but, on another hand, low involvement is likely to be accepted when decision makers have relative experience (habitual section behaviour) of organizing these types of the trip (Woodside, MacDonald, & Trappey, 1997). Though tourists prefer comparing products online, they only opt online services for familiar destinations and select the travel agents for the complex ones (Cheyne et al., 2006). Selection of travel agents is often based on experience and reputation (Wolfe et al., 2004). It is said that frequent buyers often opt for online travel agents (Chiappa, 2013), while people who travel less often prefer traditional travel agents (Wolfe et al., 2004). But ultimately, the tourist's loyalty depends on the service quality and perceived value of the package (Quintana et al., 2016).
Hypotheses of the study
- H1. The expertise of travel agent is significantly predicted by visiting traditional travel agency.
- H2. Social interaction service is significantly predicting by visiting traditional travel agency.
- H3. Secure transaction is significantly predicted by visiting traditional travel agency.
- H4. Handling capacity is significantly predicted by visiting traditional travel agency.
- H5. Technological adoption is significantly predicted by visiting traditional travel agency.
- H6. Visiting traditional travel agency significantly influences habitual selection behaviour.
- H7. Social interaction has significant effect on the habitual selection behaviour.
- H8. The secure transaction has significant effect on the habitual selection behaviour.
3. Methodology
3.1. Research instrument
The survey questionnaire consists of three sections; Section A was framed to collect demographic data including gender, age, occupation, and monthly income. In Section B, three general questions were asked regarding the frequency of visiting traditional travel agents; the service tourists expect while visiting traditional travel agents and which traditional travel agents they visit often. Section C contains 27 items for seven variables in the five-point Likert scale starting from 1 (strongly disagree) to 5 (strongly agree).
3.2. Sample design and data collection
The target population for this study was limited to those local people of Banjarmasin, Indonesia, who had visited traditional travel agencies at least once. The survey was conducted through an online portal (Google forms) and face-to-face interaction with the people at various traditional travel agencies in Banjarmasin. A self-administered survey was used to collect the data. A Non-probability convenience random sampling technique was employed in this study. Data was collected at different times of the day, over four weeks' time. 300 questionnaires were distributed to a targeted sample, and 277 were returned (92% response rate). 61.2 % of the respondents were male, and 38.8% respondents represented female. Almost 4.4% were younger than 19 years of age, 37% were between the ages of 20 and 29 years, 19.1% were between the ages of 30 - 39 years and 39.5% were older than 40 years. 38.7% of the total respondents were business people, 12.6% were students, and 48.7% were professional or self-employed. Among the 156 respondents, 56.3% were having a monthly income of Rp. 10,000,000 or above, 32.9% respondents had monthly income in the range of Rp. 5,500,000 – Rp. 7,000,000.
4. Analyses
A structural equation modelling-part least square (SEM-PLS) method was used to validate the model that contains reflective variables with multiple and single construct items and breach the multivariate normality assumptions (Gefen & Straub, 2005). In most of the current studies, SEM-PLS has been widely used mainly in exploratory studies and proven one of the rigid ways of analysing data (Herath & Rao, 2009; Ng & Konar, 2015). To analyse a data in SEM-PLS, it requires at least 10 times larger than several indicators of the individual construct in the model (Peng & Lai, 2012). In the current study, 277 samples were analysed, which exceeded the minimum requirements of 260. Further, the samples were analysed through two different models; specifically, a measurement model and structural model in SEM-PLS (Ringle, Wende & Will, 2005) Smart PLS M3 version 2.0 software using PLS algorithm and bootstrapping technique to assess the reliability and validity and factor's path coefficients. As suggested by Anderson and Gerbing (1988), the study executed the analyses in two steps.
4.1.Measurement model
First, the measurement model was tested using PLS algorithm procedure through validity and reliability analyses for each of the measures. The measurement model was tested through internal consistency reliability (overall reliability), indicator reliability (factor loadings), convergent validity (AVE-Average Variance Extracted) and lastly discriminant validity (Hair, Hult, Ringle & Sarstedt, 2014). Table 1 & 2 below shows the loadings of the items have exceeded the minimum criteria of 0.60 (Chin, 1988).
Table 1. Validity and Reliability for Constructs
| Items | Loadings | ||||
|---|---|---|---|---|---|
| Expertise of Travel Agents (AVEb = 0.595; Composite Reliabilitya = 0.880) | |||||
| ETA1 | Travel agents offer personal advice and consultation regarding travelling information. (Flights, Visa, Insurance, Dangers Issues, etc). | ||||
| ETA2 | I prefer booking with a Travel agent - if something goes wrong, there is backup assistance from Travel agent | 0.746 | |||
| ETA3 | I prefer go to travel agent for my pilgrimage trip (Umrah or others) because I need their direct assistance and guidance. | ||||
| ETA4 | Visiting travel agents make me get the clearer picture of the destination. | 0.784 | |||
| ETA5 | I visit travel agent because they gave me valuable suggestion based on my personal budget. | 0.726 | |||
| Social Interaction (AVEb = 0.679; Composite Reliabilitya = 0.913) | |||||
| SI1 | I enjoy personal contact with a travel agent - sharing ideas and suggestions. | 0.805 | |||
| SI2 | Through direct interaction, the travel agent will understand what I want. | 0.909 | |||
| SI3 | Face-to-face with travel agent's staff, I am able to negotiate for the best deal. | 0.773 | |||
| SI4 | Travel agents' staffs are helpful and friendly. | 0.708 | |||
| SI5 | I like the way the staff explain to me during service rather than reading information in the internet. | 0.909 | |||
| Secure Transaction (AVEb = 0.605; Composite Reliabilitya = 0.884) | |||||
| ST1 | Risk of fraud is lower with travel agents | 0.729 | |||
| ST2 | Traditional travel agencies encourage payments in instalments | 0.853 | |||
| ST3 | With travel agents, there are no hurdles in transaction | 0.721 | |||
| ST4 | Travel agents give more confidence about security of transaction | 0.716 | |||
| ST5 | Trusting Known and visible travel agent with money is better than unknown online sources | 0.855 | |||
| Handling Capacity (AVEb = 0.667; Composite Reliabilitya = 0.857) | |||||
| HC1 | Travel agents are able to handle group booking and group reservation. | 0.728 | |||
| HC2 | Travel agent able to do check-seat availabilities for airlines, and room blocking for hotel reservation. | 0.827 | |||
| HC3 | For the complex trip with multiple transit flights, I will prefer to book my flight tickets in travel agent. | 0.888 | |||
continued….
Table 2. Validity and Reliability for Constructs (continued)
| Items | Loadings | |||||
|---|---|---|---|---|---|---|
| Technological Adoption (AVEb = 0.606; Composite Reliabilitya = 0.821) | ||||||
| TA1 | Online booking website is complicated and user-unfriendly | 0.861 | ||||
| TA2 | I have less experience to book flight tickets through mobile apps or website. | 0.770 | ||||
| TA3 | I prefer to go to traditional travel agents because, I do not have internet access. | (deleted) | ||||
| TA4 | When I use online booking, suddenly the internet speed connection is too slow, so I prefer to go to travel agents. | |||||
| Visiting Traditional Travel Agencies (AVEb = 0.625; Composite Reliabilitya = 0.868) | ||||||
| VTTA1 | I still trust traditional travel agents to organize my trip. | 0.626 | ||||
| VTTA2 | I feel convenience when I meet directly traditional travel agents to arrange my trip. | 0.870 | ||||
| VTTA3 | I still need traditional travel agencies for my trip solution. | 0.867 | ||||
| VTTA4 | I will visit traditional travel agents to arrange my next holiday. | 0.776 | ||||
| Habitual Selection Behavior (AVEb = 1.000; Composite Reliabilitya = 1.000) | ||||||
| HSB1 | This is my habitual behavior to prefer traditional travel agents over online travel agents | 1.000 | ||||
| a Composite reliability = (square of the summation of the factor loadings) / [(square of the summation of the factor loadings) + (square of the summation of the error variances)] | ||||||
| b AVE = (summation of squared factor loadings)/(summation of squared factor loadings) (summation of error variances) | ||||||
Recommended value except for one item from the 'technological adoption' coded as (TA3; I prefer to go to traditional travel agents because I do not have internet access) found to be below the recommended level of loading criteria; hence, the item's loading is deleted from its construction to avoid any further biases in the current study. The composite reliability values, which refers to internal consistency reliability with an exceeding recommended value of 0.708 (Hair et al., 2014); similarly, average variance extracted reveals indicators' predictability by its latent constructs, which have exceeded the recommended value of 0.5 (Hair, Ringle & Sarstedt, 2013).
More importantly, the step was to assess the discriminant validity, which refers to 'the extent to which the measures are not a reflection of some other variables' (Ramayah et al., 2013; p. 142) similarly Hair et al. (2014) suggested, outer indicator loadings should be higher than all its cross-loadings of its other construct. Consequently, the square root of the AVE of each construct should be higher than its higher correlation with any other constructs (Fornell & Larcker, 1981); in general, the square root values of each construct's AVE are presented diagonally. Hence, the discriminant validity table 3 below shows adequate values above the recommended level, whereas for the overall measurement model met the satisfactory level of reliability and validity analyses.
ETA HC HSB SI ST TA VTTA ETA 0.771 HC 0.586 0.817 HSB 0.547 0.712 1.000** SI 0.672 0.727 0.533 0.824 ST 0.670 0.745 0.855 0.733 0.778 TA 0.645 0.755 0.600 0.818 0.760 0.779 VTTA 0.661 0.801 0.870 0.657 0.765 0.733 0.791
Table 3. Discriminant Validity
Note. Square root (AVE) on the diagonal in boldface and construct correlations below the diagonal.
ETA = Expertise of Travel Agents; HC = Handling Capacity; HSB = Habitual Selection Behavior; SI = Social Interaction; ST = Secure Transaction; TA = Technological Adoption; VTTA = Visiting Traditional Travel Agents
4.2.Structural model
To assess the structural model and hypotheses testing, SmartPLS 2.0 was used (Ringle et al., 2005). A bootstrapping procedure with 5000 iterations and with 277 cases was used to assess the significance of path coefficients (Chin et al., 2008; Hair et al., 2014). Further, the path coefficients critical values were measured according to the recommended level for the t-statistics; according to Hair et al. (2014) an application for research studies a path coefficient value 1.96 (significance level 5%) and 2.57 (significance level 1%) are preferably considered. Subsequently, as PLS do not generate overall goodness of fit indices, the value of R2 is primarily a path to evaluate the explanatory power of the model (Ali, Hussain, Konar, & Jeon, 2017). The study by Tenehaus et al. (2005) identified a tool to assess the model-fit, known as GoF index, which uses the average mean of AVE values of indicators and R2 values of endogenous variables. Later, Hoffman and Brinbrich (2012) introduced the cut-off values to assess the results of the GoF analysis: GoFsmall = 0.1; GoFmedium = 0.25; GoFlarge = 0.36. Hence, the results of this current model's GoF value (0.758) has indicated a very good model fit, as shown in table 4.
Table 4. Goodness of Fit Index
| AVE | R2 | |
|---|---|---|
| ETA | 0.595 | |
| HC | 0.667 | |
| HSB | 1.000 | 0.822 |
| SI | 0.679 | |
| ST | 0.605 | |
| TA | 0.606 | |
| VTTA | 0.625 | 0.860 |
| Average Scores | 0.683 | 0.841 |
| AVE*R2 | 0.574 | |
| (GOF = √(AVE x R2)) | 0.758 |
** single item construct
Additionally, in further assessment of the structural model, the hypotheses were tested with their corrected R2 values and path coefficients values to explain the predictor variables. Figure 1 shows the results of the analysis. The corrected values R2 refers to path variance explanation power of the exogenous variables toward the endogenous variables. At the initial stage of the model, all five dimensions of consumers' intention to use traditional travel agents have explained 86% percent of their visitation (R2=0.860), further visitation traditional travel factor towards traditional travel agents explains 82.2% of habitual selection behaviour of consumers choosing traditional travel agents.
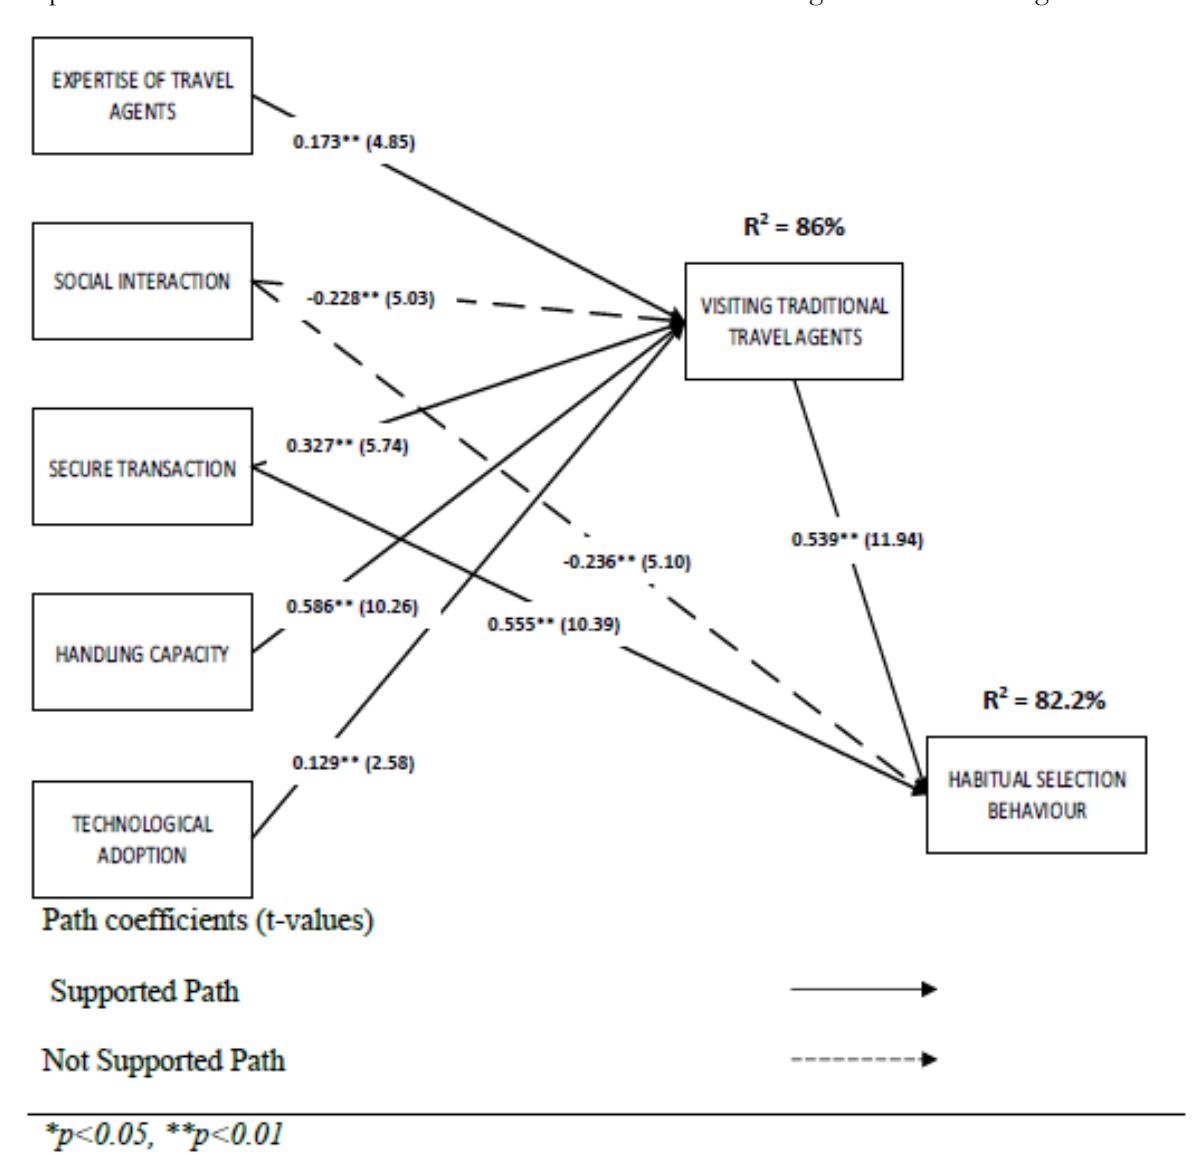
Figure 1. Results of the Structural Model
4.3. Mediator analysis
In the current study, we have measured the more complex cause-effect relationship between VTTA, ST and HSB to identify the cause-effect mediation of ST as a mediator between the relationship of VTTA and HSB. The hypotheses have been tested in Figure 2 for three major stances: specifically, as direct, indirect and total effects. Testing mediation in SmartPLS has been suggested to follow Preacher and Hayes (2008) with bootstrapping the sampling distribution of the indirect effect (Hair et al., 2014). To proceed with mediation analysis Zhao, Lynch and Chen (2010) suggested that the path A (direct path) and path B and C (indirect path) should be significant for carrying out bootstrapping analysis. Similarly, in the current model, direct and indirect paths are found to be significant (p<0.01) between VTTA, ST and HSB. To understand how much ST a mediator absorbs, the value of variance accounted for (VAF) determines the size of the indirect effect in relation to the total effect (Hair et al., 2014). Figure 2 below determines the values of the direct, indirect, and total effects paths. The VAF value has been determined through the following formula VAF = (indirect effect path/total effect path) specific paths as [B x C / (B x C) + A] = VAF; likewise, [0.327 x 0.555 / (0.327 x 0.555) + 0.539] = 0.251. Consequently, 25.1% of VTTA's effect on HSB is explained via the ST mediator. According to Hair et al. (2014), the cutoff values for VAF above 80% is considered as full mediation, VAF value larger than 20% and less than 80% can be considered as partial mediation and VAF value below 20% is characterized as no mediation. Since the VAF value is larger than 20% in the current analysis, this can be characterized as partial mediation.
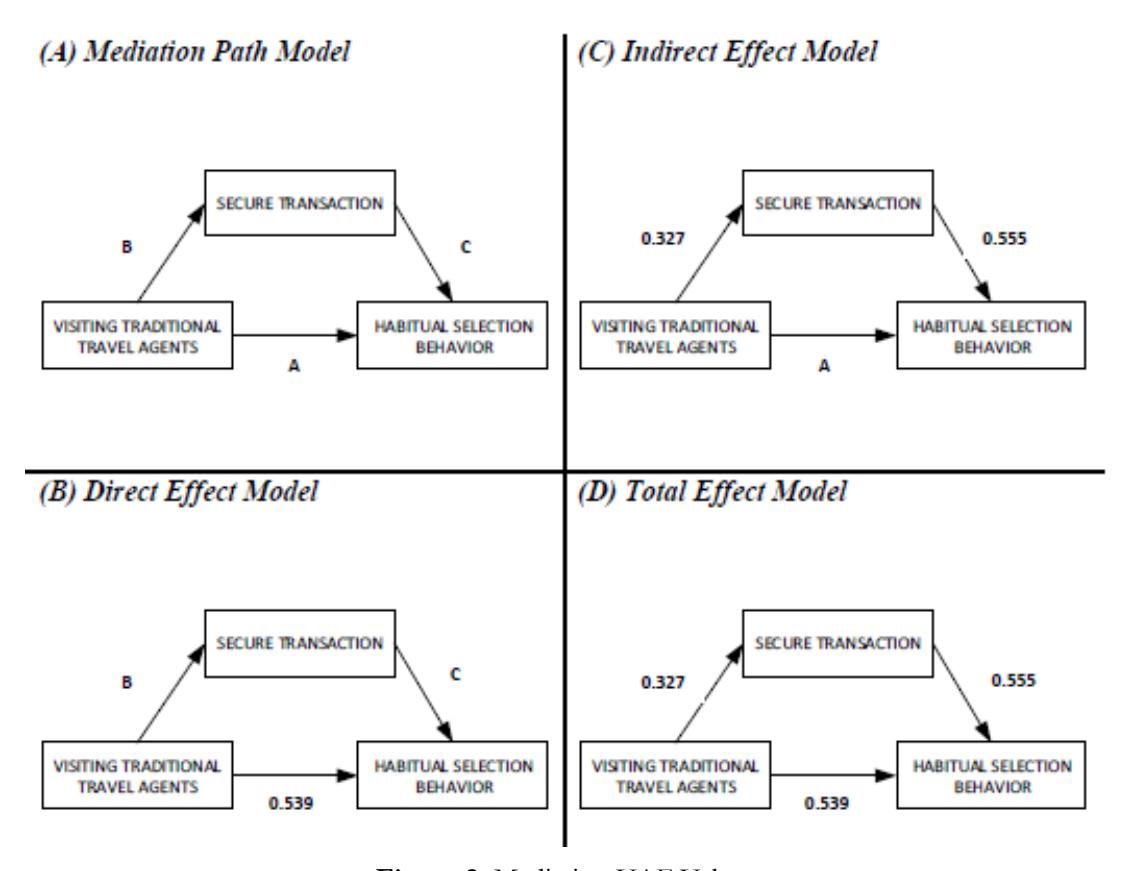
Figure 2. Mediation VAF Values
4.4. Hypotheses testing
Regarding the model validity, according to Chin et al. (2008) and Hair et al. (2013), the endogenous variables are expected to have higher values of 0.75 and above, this criterion has also been indicated in the study of Henseler et al. (2009). In most of the scholarly research, which focuses on explanatory social sciences, R2 values of 0.75, 0.50 and 0.25 for the endogenous variables can roughly be considered as high, medium and weak. These values can also be considered as an approx. rule of thumb (Sarstedt et al., 2014) to describe the comprehensive results of the structural model and hypotheses testing are presented in table 4 and Figure 1, respectively. The results of the structural model (Fig. 1) show how strong the endogenous variables are predicted by the exogenous latent variables. Further, in the hypotheses testing in the structural estimate Table 4, indicates that out of eight hypotheses of this study, six hypotheses are directly supported (H1, H3, H4, H5, H6 and H8) whereas H2, H7 have a negative influence on the dependent variable. All the hypotheses' effects are explained in the later section of this study.
| Hypotheses | Std. Beta | Std. Error | T-Value | Decision | |
|---|---|---|---|---|---|
| H1 | ETA → VTTA | 0.173 | 0.035 | 4.85** | SUPPORTED |
| H2 | SI → VTTA | (-)0.228 | 0.044 | 5.03** | NOT SUPPORTED |
| H3 | ST → VTTA | 0.327 | 0.057 | 5.74** | SUPPORTED |
| H4 | HC → VTTA | 0.586 | 0.057 | 10.26** | SUPPORTED |
| H5 | TA → VTTA | 0.129 | 0.050 | 2.58** | SUPPORTED |
| H6 | VTTA → HSB | 0.539 | 0.045 | 11.94** | SUPPORTED |
| H7 | SI → HSB | (-)0.236 | 0.044 | 5.03** | NOT SUPPORTED |
| H8 | ST → HSB | 0.555 | 0.053 | 10.39** | SUPPORTED |
| *p<0.05, **p<0.01 | |||||
Table 4. Structural Estimates (Hypotheses Testing)
However, we have tested the mediating effect of 'secure transaction' (ST) between 'intention to use traditional travel agents' (VTTA) and 'habitual selection behaviour' (HSB) to understand travel consumers' selection patterns. Through the mediator analysis, we found out ST as a mediator partially influences (25.1%) the consumers' habitual selection behaviour towards traditional travel agents. The structural estimate Table 4 shows how strongly all the eight hypotheses affect and support the endogenous variables. The H1 showed a strong positive and significant support between 'expertise of travel agents' and 'intention to use traditional travel agents' (H1: b = 0.173, t = 4.85, sig. < 0.01); oppositely for H2 showed a strong negative and significant influence of 'social interaction' towards 'intention to use traditional travel agents' (H2: b = -0.228, t = 5.03, sig. < 0.01) which failed to support our prediction. Further, H3 was mainly focused towards identifying the mediating effect of 'secure transaction' between 'intention to use traditional travel agents' and 'habitual selection behaviour' whereas 'secure transaction' has shown a strong positive and significant support towards 'intention to use traditional travel agents' (H3: b = 0.327, t = 5.74, sig. < 0.01). Similarly, H4 shows a very strong positive and significant support of 'handling capacity' towards 'intention to use traditional travel agents' (H4: b = 0.586, t = 10.26, sig. < 0.01); the H5 has also identified a significant and positive relationship between 'technological adoption' and 'intention to use traditional travel agents' (H5: b = 0.129, t = 2.85, sig. < 0.01). Consequently, H6 ('intention to use traditional travel agents' towards 'habitual selection behaviour') and H8 ('secure transaction' towards 'habitual selection behaviour') are also supported in a strong positive significant way and have been explained (H6: b = 0.539, t = 11.94, sig. < 0.01; H8: b = 0.555, t = 10.39, sig. < 0.01) respectively. However, in H7 'social interaction' have influenced 'habitual selection behaviour' of travel consumers' in a negative significant manner (H7: b = -0.236, t = 5.03, sig. < 0.01) which reveals that social interaction does not affect the decision in the selection behaviour of Indonesian travellers; thus, proving the predicted hypothesis is not supported.
5. Discussion
The findings of the current study were consistent with previous studies identifying the influencing factors; expertise of travel agents on visiting traditional travel agents (Stewer, 2005; Bogdanovych, 2006; Salomon, 2013) and secure transaction on visiting traditional travel agents and habitual selection behaviour of the tourist (Kim, Kim & Leong, 2005; Trivedi, Morgan & Desai, 2008; Jiménez-Zarco
et al. (2011); Sirakaya & Woodside, 2005; Woodside, MacDonald, & Trappey, 1997). The findings also show that there is a strong negative and significant influence of social interaction towards an intention to use traditional travel agents and habitual selection behaviour of the tourists, these findings also in line with prior literature (Prasarnphanich & Gillenson, 2003; Peng, Xu & Chen, 2013).
The study results further indicate that there are several prominent influencing factors for tourists' preferences to visit traditional travel agents in Banjarmasin, Indonesia. One factor 'social interaction service' is not significant with 'visiting traditional travel agents' and 'habitual selection behaviour' but the literature supports that social interaction service is the key of customer's experience and experience which leads to satisfaction and habitual section behaviour (Prasarnphanich & Gillenson, 2003; Bogdanovych et al., 2006). Therefore, to attract several tourists from various backgrounds, traditional travel agents in Banjarmasin, Indonesia should adopt the strategy to have direct contact with tourists for a better understanding of tourist's nonverbal behaviour, tourist's feelings and for more satisfaction of tourists with travel services. Also, it is evident from the findings that the customers feel more secure with traditional travel agents in monitory terms. More confidence and trust is bestowed on travel agents as they are physically present for any further queries.
Furthermore, respondents seem to be risk avoiders as they prefer instalment-based payments rather than paying first in online sources. The current study is an extension of the M-R environmental stimuli-emotional state-behaviour paradigm by including the factor of satisfaction in the current model, confirming that physical environment within any service setting not only influences customer emotions and behaviours but also their perceptions such as satisfaction. It is very evident from the results that the people of Banjarmasin feel traditional travel agencies can handle the trips with expertise and are a secure option. Social interaction factor did not turn out to be important in this case, as most the people did not intend to choose a travel agent based on their interactive behaviour. Travel agents should develop better social interaction to make it an added factor in determining them over online services as it was proved to be an essential factor in previous studies. However, online purchase of travel products is not much preferred in Banjarmasin. This may be due to unavailability of high-speed internet or habitual preference of travel agents. Though the purchase dynamics are swiftly changing, and online purchases are on rise in Indonesia, it can be seen from results that people are not ready to switch to online travel services as they still don't feel it safe. Henceforth, online travel products have little influence on traditional travel agents. So, these will still be most preferred for some more time if more emphasis is laid on operational capabilities.
In particular, we present the implications for traditional travel agents. Over time, the role of travel agents will be minimized. Constant updating of skills and knowledge is required on the part of travel agents to deal with future tourism trends. Therefore, travel agents need to target their strengths and build a stronger network with a loyal client base. Personalized service is a competitive advantage for travel agents. Furthermore travel agents should strive to provide more customized services and addons where available to increase customer loyalty. Traditional travel agents can use their destinationspecific knowledge to provide travelers with an authentic experience. Travelers often feel that the experience of travel agents helps in better planning trips, minimizes accidents, helps consumers in tailor-made packages that lead to repeat purchases. Technology has taken over in many parts of the world, and Banjarmasin is no exception. Therefore, travel agents need to transform their activities in order to survive in a dynamic competitive market. Traditional travel agencies have had to modify their products with the inclusion of technology without compromising the human touch (Cheyne et al., 2006; Pencarelli et al., 2020; Turgay, 2013). Although the people of Banjarmasin are not fully aware of online travel options, travel agents should focus on adopting technology in physical offices filled with traditional catalogs and brochures (Pencarelli et al., 2020). Successful promotional activities (Abrate et al., 2020) and internet-based marketing tools (Wolfe et al., 2004) should be adopted to target the younger tourist market. In the current scenario, Travel agencies need a Web presence (Wolfe et al., 2004) and network support (Abrate et al., 2020) to seize new market opportunities. Also, travel agents need to focus on specific market segments where the need for personal assistance is required. Persons with disabilities (McKercher et al., 2003), Corporate clients (Quintana et al., 2016), people with complex itinerary (Cheyne et al., 2006), older generation travelers, medical travelers, honeymoon travelers, group tourists are several types of tourists who often depend on the social interaction factors of travel agents. Henceforth, a special special focus should be given to providing the best service on par with online travel agents. The office atmosphere needs to be updated and made more attractive for tourists to visit and develop personal relationships, which in turn contributes to tourist satisfaction. Travel agencies also need to focus more on serving client needs than on commission suppliers (McKercher et al., 2003; Quintana et al., 2016). Service fees may be charged for offering exceptional service based on the complexity of the service. Specialization in a particular product or market also creates specific unique needs for the organization (Quintana et al., 2016). Also, since tourists trust Banjarmasin travel agents for secure transactions, it is more important for them to maintain price transparency to maintain trust.
6. Conclusion
The tourism industry has become one of the leading service industries in terms of contribution to world GDP. This industry involves several suppliers, including hotels, restaurants, airlines, theme parks, cruise liners and other means of entertainment in terms of satisfying tourists. At present, where everyone is employing leading technology, intermediaries are facing a tough time to survive in the tourism industry, because most of the suppliers have cut down the commission for intermediaries (travel agents) or dealing directly with the tourists. The current study fills the gap while identifying the influencing factors for the preferences of the local people to visit traditional travel agencies in Banjarmasin, Indonesia.
Although the results of the current study have shed light on several important issues, some limitations need to be considered in future research. Though efforts were taken to cover all groups, the size of the sample is one limitation of the study. Future studies can conduct a study with larger samples to cover all categories. Moreover, the results of this study are destination specific. So further studies can take up similar research on Indonesia as a whole or a cross country comparison for better generalising of results. Respondents' satisfaction and preference between online and traditional travel agencies can also be studied. The current study focused on the factors from tourist's point of view where future research can examine the travel agents' perspective by using quantitative research methods.
References
- Abrate, G., Bruno, C., Erbetta, F., & Fraquelli, G. (2020). Which Future for Traditional Travel Agencies? A Dynamic Capabilities Approach. Journal of Travel Research, 59(5), 777–791. DOI: 10.1177/0047287519870250.
- Anckar, B., & Walden, P. (2001). Self-booking of high-and low-complexity travel products: exploratory findings. Information Technology & Tourism, 4(3-1), 151-165.
- Anderson, J. C., & Gerbing, D. W. (1988). Structural equation modeling in practice: A review and recommended two-step approach. Psychological Bulletin, 103, 411–423.
- Bennett, M. M., & Buhalis, D. (2003). Tourism and travel distribution: The travel agent's perspective', Insights, D25–30, January. English Tourism Council.
- Bogdanovych, A., Berger, H., Simoff, S., & Sierra, C. (2006). Travel agents vs. online booking: Tackling the shortcomings of nowadays online tourism portals. Information and communication technologies in tourism 2006, 418-428.
- Buhalis, D., & Law, R. (2008). Progress in information technology and tourism management: 20 years on and 10 years after the Internet - The state of eTourism research. Tourism management, 29(4), 609-623.
- Capriello, A., & Riboldazzi, S. (2020). How can a travel agency network survive in the wake of digitalization? Evidence from the Robintur case study. Current Issues in Tourism, 23(9), 1049– 1052. DOI: 10.1080/13683500.2019.1590321.
- Castleberry, S. B., & Shepherd, C. D. (1993). Effective interpersonal listening and personal selling. Journal of Personal Selling & Sales Management, 13(1), 35-49.
- Cheyne, J., Downes, M., & Legg, S. (2006). Travel agent vs internet: What influences travel consumer choices? Journal of Vacation Marketing, 12(1), 41–57. DOI: 10.1177/1356766706059307.
- Chiam, M., Soutar, G., & Yeo, A. (2009). Online and off-line travel packages preferences: A conjoint analysis: Online and Off-line Travel Packages Preferences. International Journal of Tourism Research, 11(1), 31–40. DOI: 10.1002/jtr.679.
- Chiappa, G. D. (2013). Internet versus travel agencies: The perception of different groups of Italian online buyers. Journal of Vacation Marketing, 19(1), 55–66. DOI: 10.1177/1356766712466613.
- Chin, W. W. (1998). The partial least squares approach to structural equation modeling. In G. A. Marcoulides (Ed.), Modern methods for business research (295–336). Mahwah, New Jersey: Lawrence Erlbaum Associates.
- Chin,W.W., Peterson,R.A., & Brown, P.S.(2008). Structuralequationmodelingin marketing: Some practical reminders. The Journal of Marketing Theory and Practice, 16(4), 287–298. DOI: 10.2753/MTP1069-6679160402.
- Fornell, C., & Larcker, D. F. (1981). Evaluating structural equation models with unobservable variables and measurement error. Journal of Marketing Research, 18(1), 39–50. DOI: 10.2307/ 3151312.
- Gefen, D., & Straub, D. (2005). A practical guide to factorial validity using PLS-Graph: Tutorial and annotated example. Communications of the Association for Information systems, 16(1), 5.
- Hair, J. F., Hult, G. T. M., Ringle, C. M., & Sarstedt, M. (2014). A Primer on Partial Least Squares Structural Equation Modelling (PLS-SEM). Thousand Oaks, CA: Sage.
- Hair, J. F., Ringle, C. M., & Sarstedt, M. (2013). Partial least squares structural equation modeling: Rigorous applications, better results and higher acceptance. Long Range Planning, 46(1–2), 1– 12. DOI: 10.1016/j.lrp.2013.01.001.
- Hawkins, D. I., Best, R. J., & Coney, K. A. (1995). Consumer behavior. Implications for Marketing Strategy, Texas, Business.
- Henseler, J., Ringle, C., & Sinkovics, R. (2009). The use of partial least squares path modeling in international marketing. Advances in International Marketing, 20(2009), 277–320.
- Herath, T., & Rao, H. R. (2009). Protection motivation and deterrence: a framework for security policy compliance in organisations. European Journal of Information Systems, 18(2), 106-125.
- Hoffmann, A., & Birnbrich, C. (2012). The impact of fraud prevention on bank-customer relationships: An empirical investigation in retail banking. International Journal of Bank Marketing, 30(5), 390–407. DOI: 10.1108/02652321211247435.
- Ivanic, M., & Martin, W. (2014). Short-and long-run impacts of food price changes on poverty. The World Bank.
Jiménez-Zarco, A. I., Pilar Martínez-Ruiz, M., & Izquierdo-Yusta, A. (2011). The impact of market orientation dimensions on client cooperation in the development of new service innovations. European Journal of Marketing, 45(1/2), 43-67.
- Kim, L. H., Kim, D. J., & Leong, J. K. (2005). The effect of perceived risk on purchase intention in purchasing airline tickets online. Journal of Hospitality & Leisure Marketing, 13(2), 33-53.
- Kozlova, J. (2014). Young People as a Customer Segment for Travel Agency Services. Degree programme in Tourism. Vaasan Ammattikorkeakoulu University of Applied Sciences.
- Lewis, D. (2015). The importance of empathy in customer service interactions. Eptica customer experiences. Available at www.eptica.com.
- Mayr, T., & Zins, A. H. (2009). Acceptance of Online vs. Traditional Travel Agencies. Anatolia, 20(1), 164–177. DOI: 10.1080/13032917.2009.10518902.
- McKercher, B., Packer, T., Yau, M. K., & Lam, P. (2003). Travel agents as facilitators or inhibitors of travel: Perceptions of people with disabilities. Tourism Management, 24(4), 465–474. DOI: 10.1016/S0261-5177(02)00107-3.
- Moital, M., Vaughan, R., Edwards, J., & Peres, R. (2009). Determinants of intention to purchase over the Internet. Anatolia, 20(2), 345-358.
- Ng, D., & Konar, R. (2015). Determinants of travel motivation: a PLS-SEM approach towards Maldivians traveling overseas. In 21st Asia Pacific Tourism Association Annual Conference (pp. 426–437). Kuala Lumpur.
- Ng, E., Cassidy, F., & Brown, L. (2006). Exploring the Major Factors Influencing Consumer Selection of Travel Agencies in a Regional Setting. Journal of Hospitality and Tourism Management, 13(1), 75–84. DOI: 10.1375/jhtm.13.1.75.
- Pencarelli, T., Bravi, L., Dini, M., & Splendiani, S. (2020). Enhancing customer experience through technological innovation in traditional travel agencies: Evidences from Italy. Current Issues in Tourism, 1–7. DOI: 10.1080/13683500.2020.1734548.
- Peng, D. X., & Lai, F. (2012). Using Partial Least Squares in Operations Management Research: A Practical Guideline and Summary of Past Research. Journal of Operations Management, 30(6), 467–480.
- Peng, H., Xu, X., & Chen, W. (2013). Tourist behaviors in online booking: A new research agenda. Communications in Information Science and Management Engineering, 3(6), 280.
- Prasarnphanich, P., & Gillenson, M. L. (2003). The hybrid clicks and bricks business model. Communications of the ACM, 46(12), 178-185.
- Preacher, K. J., & Hayes, A. F. (2008). Asymptotic and resampling strategies for assessing and comparing indirect effects in simple and multiple mediator models. Behavior Research Methods, 40, 879-891.
- Quintana, T. A., Gil, S. M., & Peral, P. P. (2016). How could traditional travel agencies improve their competitiveness and survive? A qualitative study in Spain. Tourism Management Perspectives, 20, 98–108. DOI: 10.1016/j.tmp.2016.07.011.
- Ramayah, T., Yeap, J. A. L., & Igatius, J. (2013). An empirical inquiry on knowledge sharing among academicians in higher learning institutions. Minerva, 51(2), 131–154. DOI:10.1007/ s11024- 013-9229-7.
- Reza, K. (2015). 5 Kota di Indonesia Dengan Koneksi Internet Tercept. Liputan 6. Available at http://tekno.liputan6.com/.
- Ringle, C., Wende, S., & Will, A. (2005). SmartPLS 2.0 (Beta). Hamburg, (www.smartpls.de).
- Sabre. (2015). Online commerce. Sabre. Available at www.sabre.com.
- Sarstedt, M., Ringle, C. M., Smith, D., Reams, R., & Hair, J. F. (2014). Partial least squares structural equation modeling (PLS-SEM): A useful tool for family business researchers. Journal of Family Business Strategy, 5(1), 105-115.
- Seočanac, M., Kraguljac, V., & Milašinović, D. (2019). Online booking versus travel agents: Perspective of young tourists in Serbia. Menadzment u Hotelijerstvu i Turizmu, 7(2), 105–114. DOI: 10.5937/menhottur1902105S.
- Sirakaya, E., & Woodside, A. G. (2005). Building and testing theories of decision making by travellers. Tourism management, 26(6), 815-832.
- Solomon, M. (2013). Why I happily waste my money on travel agnets (maybe you should too). Available at www.forbes.com/.
- Stewart, J. (2005). Travel agencies say they are a better choice than internet, the Frederick news post, Frederick. Available at www. Fredericknewspost.com/.
- The Jakarta Post. (2012). Online booking become more popular among Indonesian travelers. Available at http://www. thejakartapost.com/.
- Trivedi, M., Morgan, M. S., & Kaushik Desai, K. (2008). Consumer's value for informational role of agent in service industry. Journal of Services Marketing, 22(2), 149-159.
- Tugulea, O., Bobalca, C., Maha, A., & Maha, L. G. (2014). Using Internet and travel agencies in planning a trip. A qualitative approach. CES Working Papers, 6(1), 181-200.
- Turgay, T., & Al-Zyoud, M. (2013). Examining the travel consumer's perception of the effect of the internet on travel agencies: Evidence from northern Cyprus. International Journal of Business and Social Science, 4(1).6.
- Varadarajan, P. R., & Rajaratnam, D. (1986). Symbiotic marketing revisited. The journal of marketing, 50(1), 7-17.
- Werdiningsih, P. (2015). Ticket Garuda donkrak transaksi virtual Indomaret. Kontan.id. available at www.Industry.kontan.co.id/.
- Wolfe, K., Hsu, C. H. C., & Kang, S. K. (2004). Buyer Characteristics Among Users of Various Travel Intermediaries. Journal of Travel & Tourism Marketing, 17(2–3), 51–62. DOI: 10.1300/J073v17n02_05.
- Woodside, A. G., MacDonald, R. M., & Trappey, R. J. (1997). Measuring Linkage-Advertising Effects on. Canadian Journal of Administrative Sciences, 14(2), 214-228.
- Zhao, X., Lynch, J. G., & Chen, Q. (2010). Reconsidering Baron and Kenny: Myths and truths about mediation analysis. Journal of Consumer Research, 37(2), 197-206.
.