
1. Introduction
As soon as The President of The Republic of Indonesia announced the first case of Corona Virus infection in Indonesia, somewhere around March of 2020, Bali as one of the most important tourist destinations in Indonesia has also started to experiencing the effect of the virus. Soon, the "pandemic became" Corona Virus infection has led to counter measure from the government of Indonesia in the form of large-scale social activity limitation policy to prevent the spread of the dangerous virus. At the same time, government of other countries were also implemented strict border policy to prevent inbound as well as outbound movement of people to and from their countries so that they can protect their citizen from the pandemic. As soon as the movement was stricken, tourism was started to experience the impact. A lot of hotel, restaurant, tourist attraction and other tourism related industries were found hardship due to lack of tourist. This was even harder for a tourist destination area like Bali Island. When all the economic sector is related to tourism, the pandemic COVID-19 has weakened the economy of the people of Bali. A lot of worker who were forced to accept that their company will find it hard to keep paying them, or that their own business will face difficulties when there is no visitor come to Bali.
At first, they understand that the virus is dangerous and can cause them harm. But after a few months, when things were started to get worse, a lot of people were start to take risk in order to feed their family. Government of Indonesia were also started to think that Indonesian has to start to live hand in hand with the SARS CoV-2 Virus. This was also the case in Bali, where the provincial government of Bali issued a new-normal protocol called 'Protocol of New Era Order", which was designed for 14 sectors, with tourism being one of those sectors. The protocol was started to implement on 9th July 2020. Based on the protocol, it was hoped that Bali will start to open for domestic tourism on the 31th of July 2020, while the border will be started to open for foreign tourist on the 11th of September 2020.
The plan to open for domestic and foreign tourism raised many concerns. Little was known about the Virus, and the antivirus were on process of being invented when the research conducted. From the tourism perspective, opening the border for international tourism, and the loosen up of the domestic movement are thought to be risky. As Leiper (1979) said, tourism is a fragile industry that natural factors, health issues and safety can have a big impact to it. Opening the border for tourism movement when there is no sufficient understanding about the pandemic was considered to be dangerous and can trigger a massive wave of pandemic COVID-19 in Bali. Not to mention the negative effect it can leave on the image of Bali tourism should there be visitor who were infected during his/her visit in Bali. Their disappointment of being infected may causes massive loss for tourism destination (Guridno & Guridno, 2020).
Therefore, arise the needs for research of which result can help the government to carefully deal with the situation. The research should examine the attitude, behaviour and change potentials of the tourism stakeholder (Sigala, 2020), since they are the industry player. Mahfud (2020) said that education institution should be of participation in giving opinion or suggestion to government concerning the mitigation of the pandemic COVID-19. The academia as part of the stakeholder (Calzada & Cowie, 2017) should play an important role in producing good research, based on which a good decision can be made. It is the obligation of the educated to speak the truth to the government. The pandemic of COVID-19 should be seen as brought a transformative opportunity for future tourism that may be different to today tourism which focus on its economic significance (Sigala, 2020; Brouder, et al., 2020). If for example the research indicated that the border should not be opened yet for visitors, then it will be an important insight for the government to think about, even though it means that the economy will be affected more severely. The research of which this article is based on is a quantitative one. The research was conducted to provide hindsight about factors that influence the acceptance of tourism academia toward the implementation of new-normal policy for tourism industry in Bali.
2. Conceptual Review
A set of variables and indicator were derived from the news and information on official websites concerning the Corona Virus causing the Pandemic of COVID-19. Since the news and information dissemination concerning the virus were quite massive during the preparation of the research, it was thought that the content of the news would have shaped the knowledge and understanding of the respondent about the virus. From the news and information available, it is known that Corona Virus is a newly discovered virus that responsible for the pandemic of COVID-19 (www.who.int). It was first reported to be spread at Wuhan of The Peoples Republic of China (She et al., 2020). The early identification for the virus was Novel Coronavirus 2019 or nCov-2019 (Kemkes, 2020), but letter changed to Severe Acute Respiratory Syndrome Coronavirus 2 (SARS Cov-2). Those who are infected are called to be having COVID-19 (Corona Virus Disease), a name used to identify those who are ill from the SARS CoV-2 Virus (WHO, 2020).
Symptoms of the virus are fever, cough, flu, respiratory problems, sore throat and fatigue (Kemenkes, 2020). WHO on the other hand gave a more detailed symptoms of COVID-19, by mentioning that there are three (3) type of COVID-19 symptoms. The first is the general symptom such as fever, cough and fatigue. The second is the less reported symptom, such as pain, sore throat, diarrhea, conjunctivitis, headache, inability to smell and skin disease. The third is the severe symptom, such as difficulties in breathing, short breath, chest pain, inability to speak and difficulty to move (WHO, 2020).
There are ways to prevent from being infected by the virus. Maintains physical distance of 1 to 2 meters from others, avoid crowds, wearing face mask, wash hand with soap regularly can help minimizing the possibility of being infected, since the virus are easily spread through droplets, the tiny particles that we produce when we speak or breath. Other ways including maintaining nutrition, refrain from smoking, not touching the mouth and nose and doing physical exercise. If there is contact with the infected, one should inform medical staff immediately or doing self-isolation for two weeks (WHO, 2020; United Nation, 2020; Kemenkes, 2020).
Even though those who are infected by the SARS CoV-2 Virus will have a light to medium breathing problems and can fully cures without special treatment, the risk will be higher for the senior citizen as well as for those with respiratory disease, heart disease, diabetic and cancer. It is also claimed that those who suffer a severe infection can have a permanent lung problem (www.klikpdpi.com) and can cause death.
The pandemic of COVID-19 has had enormous effect. In Bali, the pandemic also affected almost every aspect of its people's life. Tourism as the primary economy sector has hit hard by the virus (https://disparda.baliprov.go.id). Since April 2020, there were reports about hotels in Bali that were have to closed their operation (https://travel.kompas.com). It was understood that when tourism in Bali started to slowing down, then the tax for the government, salary for the werkers, income for other related industry were also started to decreased. To minimize the impact of the pandemic COVID-19, and to restart the economy, The Indonesin Government has issued a policy to live side by side with the virus. The policy called new-normal policy and letter on was called "adaptation of new habits". The stressing is that the situation is not yet normal, so the new habits have to be adopted to cope with the pandemic. In Bali Province, the new-normal protocol is called "the protocol of new era order".
Reviews from the news and other information concerning Corona Virus axplained above were then grouped into 3 variables. The first is about the virus itself, the second is about the impact of the virus, and the last is about the new-normal protocol. It was from those variables where the indicators and statement for the questionnaire were then constructed. In doing so, it was hoped that the respondent will find it easy to understand and respond the statements in the questionnaire.
3. Research Methods
In trying to answer the research questions, quantitative method was implemented. The primary data were in the form of perception, collected from the lecturer of Bali Tourism Polytechnic as the research sample. The questionnaire was a five (5) point Likert scale questionnaire based on Likert (1932). The questionnaire developed in google form and then submitted to the targeted respondent. It consists of three sections, with each representing 3 variables of the research. The first and the second variables ware independent variables. "Corona Virus" and "Impact of Corona Virus to Tourism Industry in Bali" were given as the name of those independent variables respectively. The third variable namely "Implementation of New-Normal Policy for Tourism Industry" is a dependent variable. The first section of the questionnaire consists of 18 statements. The second section consists of 6 statements, and the third section consists of 8 statements. The questionnaire was tested for validity and reliability before being submitted to respondents. Item analysis (based on Lester et al, 2014), was also used to determine whether a less valid statement in the questionnaire should or should not be included.
Out of 151 lecturers of Bali Tourism Polytechnic (Poltekpar Bali, 2020 October 21) there were 88 of those who are willing to complete the questionnaire. Since the research using Multiple Linear Regression Analysis to answer the question of the research, power analysis was then performed to calculate the power of the sample to minimize the possibility of violating the type I error as well as the type I error in the hypothesis testing (Lester et al, 2014; Hair et al, 2014; Pituch & Stevens, 2016; Field, 2017). Based on the power analysis, it was found that 88 respondents represent 0,90 power, with 0,05 error, and 0,15 effect size. Power Analysis maintains 0,80 as the minimum power for a statistical analysis (Cohen, 1988). For this research, with the power of 0,90, it was assumed that the sample is enough to be analysed using Multiple Linear Regression Analysis.
Since the data collected for the research was of ordinal type, in the conformation to the multivariate technique, the data were transformed into interval type of data, which is the minimum requirement for the data to be analysed using Multiple Linear Regression Analysis (Hair et al, 2014; Field, 2017). Other than Multiple Linear Regression Analysis, the research was also implemented descriptive statistical analysis in calculating frequency of the data collected, in order to have a clearer picture about the perception or knowledge or understanding of the respondents concerning the virus and also the impact it brought to the tourism industry. Both Descriptive Statistical Analysis and Multiple Linear Regression Analysis for the research was done using SPSS.26 software.
4. Results and Discussion
As has been mentioned, the respondent for this research are 88 lecturers of Bali Tourism Polytechnic. Six (6) of those are Doctor or Ph.D., 76 are master, and the rest are graduate alumni. Most of the respondent were female, while the male was counted for 37 out of 88 respondents.
In understanding the perception of the respondents toward Corona Virus, its impact and the nownormal policy, a 5 scale Likert type questionnaire was used to collect data. Descriptive Statistical Analysis were performed to calculate the frequency of the response for the statements in the questionnaire. There are 18 statements for the first variable, 6 for the second variable and 8 for the third variable. The responses are Strongly Disagree (1), Disagree (2), Neutral (3), Agree (4) and Strongly Agree (5). Based on the frequency of the response for the first variable, most of the statement were responded with Strongly Agree and Agree, while only a few that received Strongly Disagree and Disagree. Since most statements are written in a positive sentence, then it can be assumed that the positive answer (Strongly Agree and Agree) means that the respondents possess good understanding about the Corona Virus. However, one interesting thing about the perception of the lecturer is that there were 23 respondents who did not know that the official name of the virus
causing the pandemic is SARS CoV-2, even though those who knew were more than those who were not.
Regarding impacts of the virus, the respondents also seems to possess good knowledge or understanding about the impact of Corona Virus to tourism industry. There were 6 statement that constructed the second part of the questionnaire. The frequency of the response shows that most of the respondent tend to Strongly Agree and Agree toward the positive statement of the second variables. The proportion of Strongly Agree and Agree response towards eight statements of the newnormal variables are more in comparison with the Normal, Disagree and Strongly Disagree responses. This also shows that the respondents have a good understanding about the new-normal policy. The tables of the frequency are attached as part of this article.
Once the perception or the knowledge of the respondents about the Corona Virus and its impact toward tourism industry has been understood, Multiple Linear Regression Analysis were then performed. Before proceeded with the analysis, multicollinearity, homoscedasticity, independence of error term and normality were tested to meet the requirement of the analysis.
Table 1. Correlation
| Y | X1 | X2 | ||
|---|---|---|---|---|
| Pearson Correlation | Y | 1.000 | .607 | .650 |
| X1 | .607 | 1.000 | .773 | |
| X2 | .650 | .773 | 1.000 | |
| Sig. (1-tailed) | Y | .000 | .000 | |
| X1 | .000 | .000 | ||
| X2 | .000 | .000 | ||
| N | Y | 88 | 88 | 88 |
| X1 | 88 | 88 | 88 | |
| X2 | 88 | 88 | 88 |
Correlation Table above shows that there is no multicollinearity in the data collected. Observing the above table, it shows that correlation coefficient between variables (X1, X2 and Y) are well below 0,9 as the maximum value for indications of existence of multicollinearity (Field, 2017).
Other sign of multicollinearity can also be found by observing the value of tolerance from the Coefficient Table, as well as the VIF column (Harrel, 2015). If the value of tolerance that are going to be used, then we are expecting for a value of more than 0,1. If the value of VIF that will be used to determine whether multicollinearity exist, then we are looking for value of less than 10 (Field, 2017).
Table 2. Coefficients
| Model | Un standardized Coeff. | Standar dized Coeff. | t | Sig. | 95.0% Confidence Interval for B | Correlations | Collinearity Statistics | |||||
|---|---|---|---|---|---|---|---|---|---|---|---|---|
| B | Std. Error | Beta | Lower Bound | Upper Bound | Parti al | Part | Toler ance | VIF | ||||
| 1 | Const. | 9.423 | 2.649 | 3.557 | .001 | 4.157 | 14.689 | |||||
| X1 | .324 | .046 | .607 | 7.089 | .000 | .233 | .415 | .607 | .607 | 1.000 | 1.000 | |
| 2 | Const. | 8.389 | 2.506 | 3.348 | .001 | 3.407 | 13.370 | |||||
| X1 | .139 | .068 | .261 | 2.062 | .042 | .005 | .274 | .218 | .166 | .403 | 2.483 | |
| X2 | .574 | .163 | .447 | 3.528 | .001 | .251 | .897 | .357 | .284 | .403 | 2.483 | |
a. Dependent Variable: Y
Both the value of tolerance or VIF from the table 2 above are showing sign that multicollinearity did not exist. The second assumption of Multiple Linear Regression Analysis is homoscedasticity. To determine whether it existed can be done by observing the scatterplot output of the SPSS. If the scatterplot showed specific pattern of triangle or diamond, then we can assume that homoscedasticity existed. The scatterplot for this research as shown below does not show any sign of homoscedasticity. The dot pattern also shows that the independence of error term did not happen to the variables of the research.
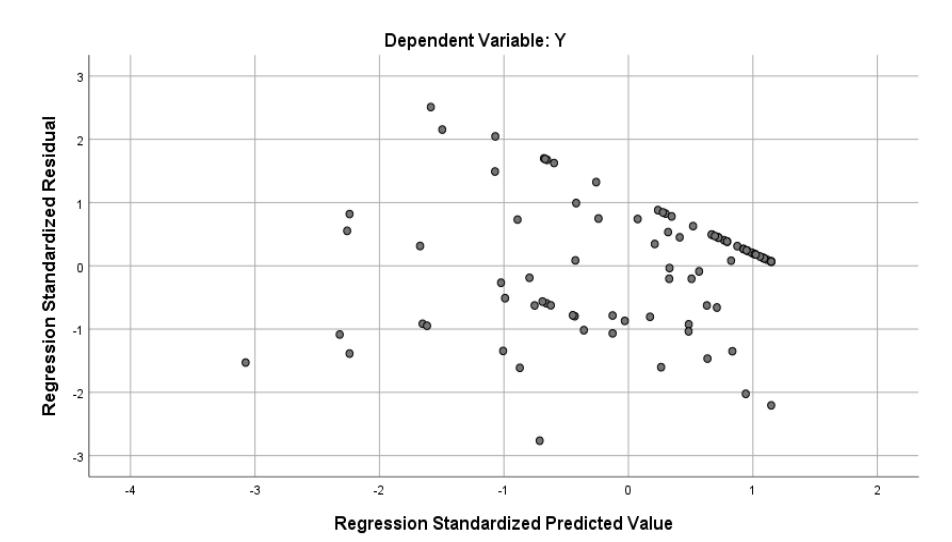
Picture 1. Scatterplot Multiple Linear Regression Analysis of Value between Variables X1, X2 and Y
The last assumption for the Multiple Linear Regression Analysis is normality. This assumption requires that the data to be analyze should be normally distributed. Observing Histogram of the standardized residual and the normal P-P Plot outputs of SPSS can give a good indication about the assumption.
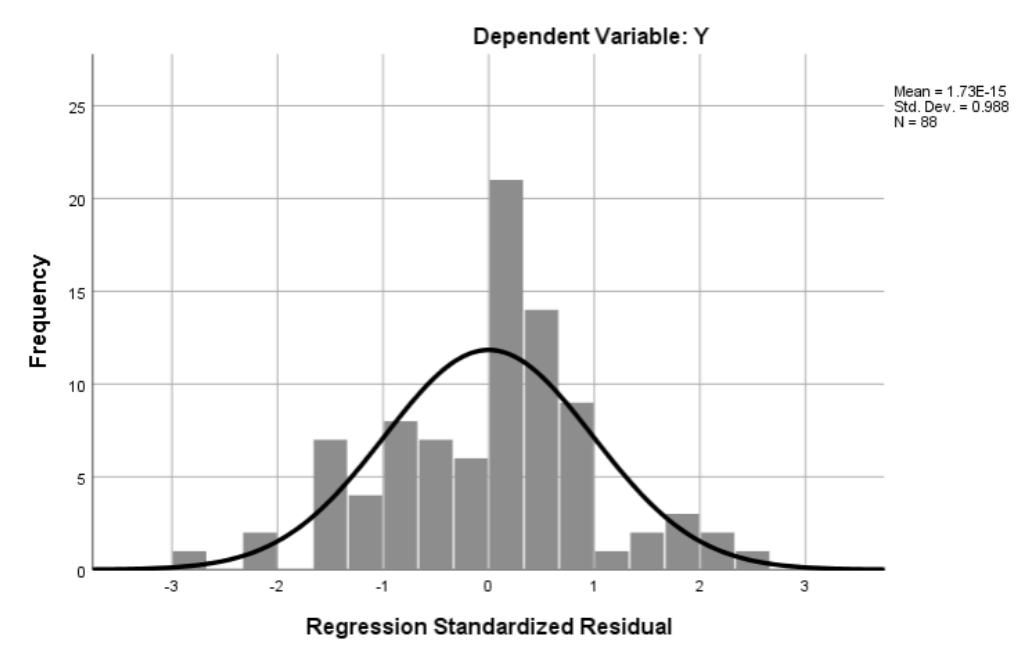
Picture 2. Histogram Regression Analysis of Frequency between Variables X1, X2 and Y
The curve of the histogram above forms a perfect wave form. This is a sign the data are normally distributed.
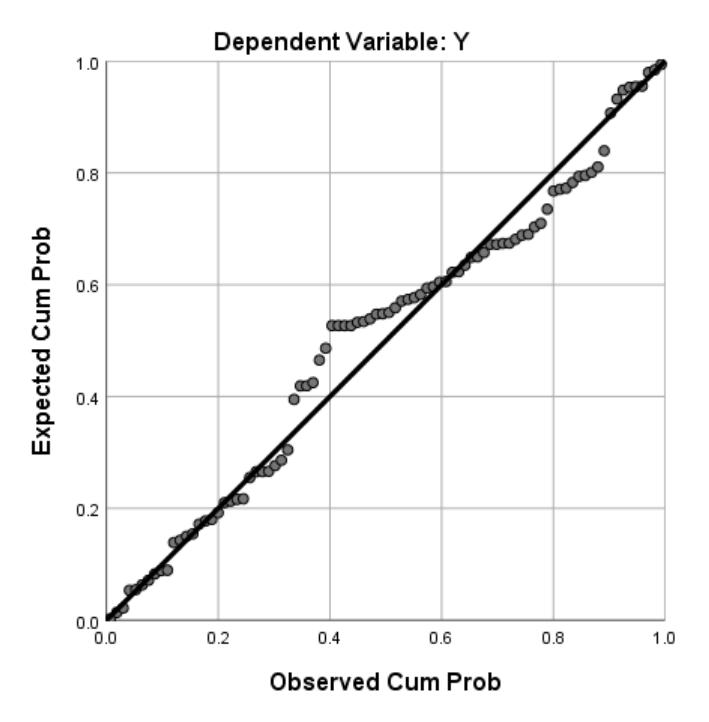
Picture 3. Normal P-P Plot between Variables X1, X2 and Y
The Normal P-P Plot above also shows that the dots are spread near and along the diagonal line. That is also a good sign that that the data are normally distributed. Since all assumption are met, then the next step is to check the overall fit of the model and the model's parameter. The fit of the model can be judge based on the Model Summary and ANOVA output. Observing the second block of the Model Summary output below, where both the predictor (X1 and X2) entered into the model, the R² shows that both of the predictor contributed to 44,9% variation in the Dependent Variable (Y).
Table 3. Model Summary between Variables X1, X2 and Y
| Model | R | R Square | Adjusted | Std. Error | Change Statistics | ||||
|---|---|---|---|---|---|---|---|---|---|
| R Square | Estimate | R Square Change | F Change | df1 | df2 | Sig. F Change | |||
| 1 | .607a | .369 | .361 | 4.936 | .369 | 50.249 | 1 | 86 | .000 |
| 2 | .670b | .449 | .436 | 4.637 | .081 | 12.450 | 1 | 85 | .001 |
a. Predictors: (Constant), X1
b. Predictors: (Constant), X1, X2
c. Dependent Variable: Y
The model also shows that if it applied to the population, then there will only be 0,013 (1,3%) different in the result (0,449 – 0,436 = 0,013). This is a good sign that the model can significantly generalized the phenomena existed in the population.
The first block of F statistic on the ANOVA output below shows that the first predictor (X1) accounted for 50,249% variation on the acceptance of the respondents toward implementation of new-normal policy. The second block indicating that both the predictor (X1 and X2) simultaneously influenced the Dependent Variable (Y). The influence however is less compared with the first block and accounted for 34,694% variation on the dependent variable. Both F statistics are significant with p < 0,001.
Table 4. ANOVA between Variables X1, X2 and Y
| Model | Sum of Squares | df | Mean Square | F | Sig. | |
|---|---|---|---|---|---|---|
| 1 | Regression | 1224.222 | 1 | 1224.222 | 50.249 | .000b |
| Residual | 2095.245 | 86 | 24.363 | |||
| Total | 3319.467 | 87 | ||||
| 2 | Regression | 1491.900 | 2 | 745.950 | 34.694 | .000c |
| Residual | 1827.567 | 85 | 21.501 | |||
| Total | 3319.467 | 87 |
a. Dependent Variabel: Y
The t statistic shows on the coefficient table below indicating that the second predictor (Impact of the virus) is the better predictor (t = 3,528) compared to the first predictor (t = 2,062). Both are significant with p < 0,05.
Table 5. Coefficients between Variables X1, X2 and Y
| Model | Un standardized Coefficients | Standardized Coefficients | t Sig. | 95.0% Confidence Interval for B | Correlations | Collinearity Statistics | ||||||
|---|---|---|---|---|---|---|---|---|---|---|---|---|
| B | Std. Error | Beta | Lower Bound | Upper Bound | Partial | Part | Tolerance | VIF | ||||
| 1 | Const. | 9.423 | 2.649 | 3.557 | .001 | 4.157 | 14.689 | |||||
| X1 | .324 | .046 | .607 | 7.089 | .000 | .233 | .415 | .607 | .607 | 1.000 | 1.000 | |
| 2 | Const. | 8.389 | 2.506 | 3.348 | .001 | 3.407 | 13.370 | |||||
| X1 | .139 | .068 | .261 | 2.062 | .042 | .005 | .274 | .218 | .166 | .403 | 2.483 | |
| X2 | .574 | .163 | .447 | 3.528 | .001 | .251 | .897 | .357 | .284 | .403 | 2.483 | |
a. Dependent Variable: Y
The unstandardized coefficient (B) showed on the table above are also the parameters for the model. Both those B coefficients for X1 and X2 shows positive value. Using the coefficients as the parameter, then a specific model for the research as can be defined as below:
\[Y = 8,389 + 0,139 + 0,574\] or
Acceptance toward new-normal = 8,389 +
(0,139 Perception towards the virus) +
(0,574 Perception towards the impact of the virus)
The research shows that respondents understand the SARS CoV-2 Virus well. Their perception towards the virus shows that they knew about the relation between the current virus with those causing past pandemic of SARS and MERS, the origin of the virus, the official name of the virus and the disease caused by it, its symptoms, and also the ongoing process to make the vaccine available
b. Predictors: (Constant), X1
c. Predictors: (Constant), X1, X2 for use. Their perceptions also show that they understood the impact caused by the pandemic toward the tourism industry, and how to prevent the spread of the infection by adopting new habits of cleanliness, physical distancing, avoiding the crowds, using face mask and the needs for protocols and facility for cleanliness. All of which corresponds to new-normal policy in tourism.
The perception of the respondent toward the Corona Virus (X1) and its impact (X2) were then used to predict their acceptance toward implementation of new-normal policy for tourism industry in Bali (Y). The model shows that it can be generalized to the point where there will only be 1,3% difference in the result if the model applied to the population. The F test shows that both predictors (X1 and X2) were simultaneously influenced the acceptancy of the new-normal policy significantly.
The t test shows that each predictor (X1 and X2) were partially significant predictors for their acceptance toward implementation of new-normal policy tor tourism industry in Bali (Y), even though X2 is the better predictor that influenced Y stronger, compared to that of X1. The danger of the virus and its ability to triggered pandemic did not influence their acceptance toward implementation of new-normal for the tourism industry in Bali as strong as the influence of the perceptions of the respondent toward the impact of the pandemic to the tourism industry. Given that the indicator used to measure their perception toward impact of the pandemic are mostly economic, then it was attempting to assume that the academia cautious about the long-term economic impact of the pandemic to the tourism industry, the country as well as the labour. It was also attempting to assume that the respondents consider that implementation of new-normal policy will help in restarting the tourism industry in Bali, while still preventing the outbreak to spread worse.
The parameter of the model shows positive influence of the X1 and X2 to Y. The better the understanding of the respondent about the virus and its impacts, the more they will accept the implementation of new-normal policy. For every increase in the perception of the respondent toward the Corona Virus, will increase their acceptance toward the implementation of new-normal by 0,139 point. The parameter also shows that for every increase in their perception toward the impact of the pandemic to the tourism industry, will increase their acceptance to the implementation of new-normal by 0,574 point.
5. Conclusion and Recommendation
Based on the result, a conclusion can be made that both their knowledge of the virus and their awareness of its impact toward tourism industry in Bali significantly influenced the tourism academia to accept the implementation of new-normal policy for the tourism industry in Bali. Should the government of Bali Province ready to implement the new-normal policy as published by Prajnawrdhi (2020), then this article can support that decision, since it was argued to be the strategy that will be valuable in the present and also in the future to fight the pandemic (Rodriguez-Anton & Alonso-Almeida, 2020). This article can also contributes to the topic of tourism and hospitality recovery which according to Davahli et al. (2020) were discussed in 19% of articles they read for their writings, indicating the needs for research on this area.
While the result shows the support of academia toward implementation of new-normal policy in Bali, it raised concerns as well. The academia who were the respondent of the research are lecturer in tourism subjects. It means thet they well aware with the possibility that opening the border for tourism without propper preparation in the industry, the community and the government may resulted in the deterioration of the tourim image of Bali tourism, since travel and tourism is considered to be a potential spreader of infectious diseases (Wilson, 1995; Findlater & Bogoch, 2018; Jamal & Budke, 2020; Gossling et al, 2020; Wilder-Smith, 2021) including the current pandemic (Benjamin et al, 2020). On the other hand, even though the lecturer are of tourism discipline, it doesn't mean that they are not understand the danger of the virus to human life, as well as how dangerous the pandemic caused by the virus to the economy. With that beeing said, it can be assumed that their acceptance for the implementation of new-normal policy may be an indication of a merely economic
concern that has been voiced since a few years ago. It shows that there are trade-off between economic significants of tourism industry and the danger brought about by the pandemic, as resported in some articles (Dunlop et al, 2020; Goldsztejn et al, 2020; Yechezkel et al, 2021), and that the trade-off is not only the problem of government as the policy maker, but also faced by the community whose life will be affected by the policy.
Bali economy has becoming overly reliance to tourism (Lee, 2017; Handayani et al, 2021) where tourism has been the primary mover of Bali Economy (Antara & Sumarniasih, 2017). Since tourism are prone to safety and security issues, Antara and Sumarniasih also pointed that other sectors such as agriculture and small industries should never be neglected. Their research result may have been the case today in the time of pandemic COVID-19. In their research, Antara & Sumarniasih calculated that 51,81% of people in Bali works in tourism industry during 2014. Assuming that the number has increased, than there should be more people in Bali who are now suffering from the impact of the pandemic COVID-19 than those who are not. The academia may have been concern of this situation so they accept the implementation of new-normal policy, something that seems to place safety and health as second important than the economy, underlining the trade-off that ware discussed earlier.
It can also be assumed that the acceptance of the academia toward implementation of new-normal policy are image of their confidence that implementation of new-habbit in tourism, such as cleanliness, the wearing of face mask, maintaining phisical distancing, avoiding crowds, keeping one's immune in good condition and other ways (Guridno & Guridno, 2020; Colfer, 2020; Basher & Haque, 2020), as suggested by WHO and other health organization are effective in minimizing the possibility of getting infected by the virus.
Therefore, this article recommend that should the tourism be open for visitors, then it should be done with a strick implementation of new-normal policy by the entire tourism stakeholder. While this is important to provide opportunity for the tourism industry to restart, the implementation of the new-normal policy will help in maintain the image of Bali tourism as a safe and secure destination to visit. It will also help to ensure the outbreak will not spread worse in Indonesia.
Acknowledgment
Our gratitude for the respondents of the research who were willing to help us in completing the questionnaire. Gratitude also for the management of Bali Tourism Polytechnic for their approval to the research proposal and for the research budget that were given to the researcher. Special thanks to our family for letting us complete the research and this article.
Author's Note
Authors of this manuscript declares that there is no conflict of interest between the authors and that there is no plagiarism in this manuscript.
References
- Antara, M., & Sumarniasih, M. S. (2017, December). Role of Tourism in Economy of Bali and Indonesia. Journal of Tourism and Hospitality Management, 34-44. DOI: 10.15640/jthm.v5n2a4.
- Basher, S. A., & Haque, A. K. (2020). Public policy lessons from the Covid-19 outbreak: How to deal with it in the post-pandemic world? Journal of Social and Economic Development. DOI: 10.1007/s40847-020-00118-w.
- Benjamin, S., Dillette, A., & Alderman, D. H. (2020). "We can't return to normal": committing to tourism equity in the post-pandemic age. Tourism Geographies. DOI: 10.1080/14616688.2020.1759130.
- Brouder, P., Teoh, S., Salazar, N. B., Mostafanezhad, M., Pung, J. M., Lapointe, D., . . . Clausen, H. B. (2020). Reflections and discussions: tourism matters in the new normal post COVID-19. Tourism Geographies. DOI: 10.1080/14616688.2020.1770325.
- Calzada, I., & Cowie, P. (2017). Beyond Smart & Data-Driven City-Regions? Rethinking Stakeholder-Helixes Strategies. Regions Magazine. RSA Regional Studies Association (Gail Mulvey & Frank Peck).
- Cohen, J. (1988). Statistical Power Analysis For The Behavioral Science, Second Edition. New York: Lawrence Erlbaum Associates Publishers.
- Colfer, B. (2020). Public policy responses to COVID-19 in Europe. Eur Policy Anal. DOI: 10.1002/epa2.1097.
- Davahli, M. R., Karwowski, W., Sonmez, S., & Apostolopoulos, Y. (2020). The Hospitality Industry in the Face of the COVID-19 Pandemic: Current Topics and Research Methods. International Journal of Environmental Research and Public Health. Retrieved February 17, 2021.
- Disparda Baliprov (2020, Juli 15). BUKU STATISTIK PARIWISATA BALI 2020. Retrieved from https://disparda.baliprov.go.id/.
- Dunlop, C. A., Ongaro, E., & Baker, K. (2020). Researching COVID-19: A research agenda for public policy and administration scholars. Public Policy and Administration. DOI: 10.1177/0952076720939631.
- Field, A. (2017). Discovering Statistics Using IBM SPSS Statistics 5 th Edition. Sussex: Sage Edge.
- Findlater, A., & Bogoch, I. I. (2018). Human Mobility and the Global Spread of Infectious Diseases: A Focus on Air Travel. Trends in Parasitology. DOI: 10.1016/j.pt.2018.07.004.
- Frank E. Harrel, J. (2015). Regression Modelling Strategies With Applications to Linear Models, Logistic and Ordinal Regression and Survival Analysis, Second Edition. Switzerland: Springer.
- Goldsztejn, U., Schwartzman, D., & Nehorai, A. (2020). Public policy and economic dynamics of COVID-19 spread: A mathematical modeling study. PLoS ONE. DOI: 10.1371/journal.pone.0244174.
- Gossling, S., Scott, D., & Hall, C. M. (2020). Pandemics, tourism and global change: a rapid assessment of Covid-19. Journal Of Sustainable Tourism. DOI: 10.1080/09669582.2020.1758708.
- Guridno, E., & Guridno, A. (2020). Covid-19 Impact: Indonesia Tourism in New Normal Era. International Journal of Management and Humanities (IJMH), 4(11), 31 - 34. DOI: 10.35940/ijmh.K1049.0741120.
- Hair, J. H., Black, W. C., Babin, B. J., & Anderson, R. E. (2014). Multivariate Data Analysis Seventh Edition. Essex: Pearson Education Limited.
- Handayani, F., Sylvina, V., & Lestari, A. (2021). Toward New Normal: Bali Tourism Goes Extra Mile. IOP Conference Series: Earth and Environmental Science. IOP Publishing. DOI: 10.1088/1755- 1315/704/1/012025.
- Jamal, T., & Budke, C. (2020). Tourism in a world with pandemics: local-global responsibility and action. Journal of Tourism Futures, 181 - 188. DOI: 10.1108/JTF-02-2020-0014.
- Kemenkes (2020). BUKU PEDOMAN RT RW Pencegahan COVID. Retrieved from https://promkes.kemkes.go.id/download/epkk/files6509511%20MEI_BUKU%20PEDO MAN%20%20RT%20RW%20Pencegahan%20COVID.pdf.
- Kompas (2020, September 18). Kasus Covid-19 Meningkat, Bali Batasi Kunjungan Tempat Wisata. Retrieved from: https://travel.kompas.com/read/2020/09/18/141500827/kasus-covid-19 meningkat-bali-batasi-kunjungan-tempat-wisata?page=all.
Lee, S. C. (2017). Tourism, Community adn Quality of Life Indicators in Bali. Institute of Asian Studis, University Brunei Darussalam. Retrieved February 28, 2021, from www.researchgate.net.
- Leiper, N. (1979). The Framework of Tourism, Towards a Definition of Tourism, Tourist, And The Tourist Industry. Annals of Tourism Research, 390 - 407.
- Lester, P., Inman, D., & Bishop, L. (2014). Handbook Of Tests and Measurement in Education and The Social Sciences, Third Edition. Lanham: Rowman & Littlefield.
- Likert, R. (1932). A Technique For The Measurement Of Attitudes. (R. Woodworth, Ed.) Archives Of Psychology, 140, 5 - 55.
- Mahfud, C. (2020). Covid-19 dan Peran Perguruan Tinggi. Retrieved February 17, 2020, from researchgate.net.
- PDPI (2020, July 21th). Virus Corona: Ribuan Orang Mantan Pasien Covid-19 Terancam Gangguan Fibrosis Paru. Retrieved from: http://klikpdpi.com/index.php?mod=article&sel=9648.
- Pituch, K. A., & Stevens, J. P. (2016). Applied Multivariate Statistics For The Social Sciences, Analysis with SAS and IBM's SPSS, Sixth Edition. New York: Routledge.
- Poltekpar Bali. (2020, October 21). SIAMIK - Sistem Informasi Akademik. Retrieved from: http://siamik.ppb.ac.id/gs-laporan-database-dosen-print.php.
- Prajnawrdhi, T. A. (2020). Tourism in the New Normal Era: a Perspective of Bali Tourism Actors. International Journal of Innovation, Creativity and Change, Special Edition: COVID-19 Life Beyond, 51 - 70.
- Rodriguez-Anton, J. M., & Alonso-Almeida, M. d. (2020). COVID-19 Impacts and Recovery Strategies: The Case of the Hospitality Industry in Spain. MDPI Sustainability. Retrieved February 17, 2021.
- She, J., Jiang, J., Ye, L., Hu, L., & Bai, C. &. (2020). 2019 novel coronavirus of pneumonia in Wuhan, China: emerging attack and managemen t strategies. Clinical and Translational Medicine. DOI: 9. 10.1186/s40169-020-00271-z.
- Sigala, M. (2020). Tourism and COVID-19: Impacts and Implications for Advancing and Resetting Industry and Research. Journal of Business Research. DOI: 10.1016/j.jbusres.2020.06.015.
- United Nation. (2020, July 15). Coronavirus global health emergency. Retrieved from: https://www.un.org/en/coronavirus.
- WHO. (2020, July 21th). Naming the coronavirus disease (COVID-19) and the virus that causes it. Retrieved from https://www.who.int/emergencies/diseases/novel-coronavirus-2019/technicalguidance/naming-the-coronavirus-disease-(covid-2019)-and-the-virus-that-causes-it.
- WHO. (2020). COVID-19: Physical distancing. Retrieved from: https://www.who.int/westernpacific/ emergencies/covid-19/information/physical-distancing.
- Wilder-Smith, A. (2021). COVID-19 in comparison with other emerging viral diseases: risk of geographic spread via travel. Tropical Diseases, Travel Medicine and Vaccines. DOI: 10.1186/s40794-020-00129-9.
- Wilson, M. E. (1995). Travel and the emergence of infectious diseases. Emerging infectious diseases, 1(2), 39.
- Yechezkel, M., Weiss, A., Rejwan, I., Shahmoon, E., & Yamin, S. B.-G. (2021). Human mobility and poverty as key drivers of COVID-19 transmission and control. BMC Public Health. DOI: 10.1186/s12889-021-10561-x.