
1. Introduction
With the growth of technology, an individual's life faces continuous improvement. The influence of mobile technology has totally changed people's lifestyles (Jamal & Habib, 2020). Smartphone apps are the most recent which have already resulted in high penetration in the market (Morosan & DeFranco, 2016). It ensures user flexibility in their regular travel by providing various travel-support applications. Through the use of smartphone apps, society has been thoroughly transformed. The apps have greatly impacted the field of travel and tourism (Dickinson et al., 2014). The market demand for smartphone apps is rapidly increasing (Santos-Vijande, 2018) and has significantly impacted the tourism industry and travellers behavior. By using smart technology, travelers are able to enhance their travel experiences (Karanasios et al., 2012). Smartphone apps contain numerous features that facilitate users to share location based social information which thus works as a powerful tool for potential travelers (Dickinson et al., 2014). There are few smart phone apps which are used by travelers much to access information related to hotels, destinations etc (Dickinson et al., 2014). These smartphone apps include hotel booking (Booking.com, Trivago), travel planning (TripAdvisor), tour guide (DETOUR) and, transportation (Uber, Ola). As mentioned by Statista, (2020) India has 4.57 billion active internet users as it has 59 percent of the global population and so India is one of the leading countries globally. While travelling, 30% users opt for hotel deals through smartphone apps, 29% prefer smartphone apps to get flight deals, 8.1% prefer smartphone apps to buy tickets which are downloaded, by 15% users specifically while planning trip in advance (How mobile app benefits, 2015).
The Indian travel market is expanding daily and the availability of high disposable incomes people are very active in travelling related activity. A total of 1798 million Indians travelled to various domestic destinations in 2018, providing a growth rate of 2.3% while another 26 million traveled internationally ensuring a growth rate of 9.5% (Ministry of tourism, statistics, and 2018). The online travel market of India is expected to increase by 11-11.5% to $48bn by 2020, with the hotel sector being expected to grow to $13bn by the same year. Further, the size of the online hotel booking industry in India is projected to increase to $4 bn by 2020. Online penetration of hotel booking in developed nations such as USA, UK, Germany, and France has expanded by 40-45% whereas India in an early adoption curve has 17% online hotel booking (ITU, 2015; World Bank Database, 2015; Eurostat statistics database, 2015).
Various studies in literature analyzed the use of smartphone apps. Palau-Saumell et al., (2019) stated that users adopt smartphone apps for restaurant search and reservations. Lei, Wang, & Law (2019) felt that users adopted smartphone apps for hotel booking by checking reviews posted by other customers. Further, Wang et al., (2016) discussed various factors which impact an organization's hotel apps adoption for reservations. However, there is dearth in studies regarding travelers' using apps for hotel bookings through smartphones. Hence, the current study is an attempt to fill this gap by objectively examining various determinants that affect travelers' behavioral intention regarding hotel bookings through smartphone apps.
The remaining paper is divided into various sections as follows: Section 2 sheds light on extensive literature review of existing studies and formulates the hypotheses. Further, section 3 details the research methodology. Section 4 presented the data analysis and findings part. Finally, section 5 explains discussion, theoretical & managerial implications and limitations associated with the study.
2. Literature Review
The present study has undertaken a comprehensive review of earlier studies. A report published by BCG, (2017) revealed that while booking, 62% travelers booked accommodation first while 22% booked their flights first and 16% booked an alternate mode of travel first. Further, it revealed that consumers usually plan their travels early rather than quickly purchasing tickets. They spend an average of 46 days to plan their trip, spending 49 minutes to search online and visit as many as 17 touch points before making their booking. In 2018, peer to peer accommodation such as Airbnb, Homeaway, VERBO etc. bookings totaled 7% booking across the globe. They provided a total of 8 million beds (World Bank Group, 2018).
The extended Unified theory of acceptance and use of technology (UTAUT-2) proposed by Venkatesh et al. (2012) is an extension of UTAUT (Venkatesh et al., 2003). This extended model includes hedonic motivation, price value, and habit with the original four constructs: performance expectancy, effort expectancy, social influence, and facilitating conditions. Further, this study has extended UTAUT2 model by adding 'perceived trust' in context of hotel bookings through smartphone apps. Previous studies used various theories like TRA, TPB and TAM to study consumers' acceptance and intention using smartphone apps (Assaker, 2020; Dhir, Kaur &Rajala, 2020; Fatima, Ghandforoush, Khan, & Mascio, 2019; Halder & Goel, 2019; Humbani & Wiese, 2019; Vahdat, Alizadeh, Quach, & Hamelin, 2020; Rafique, Almagrabi, Shamim, Anwar, & Bashir, 2020).
However, Venkatesh et al., (2003) integrated eight different theories to propose the determinants of users' adoption and usage of technologies. These theories include Theory of planned behavior (TPB), Theory of reasoned action (TRA), Technology acceptance model (TAM), Motivational Model (MM), Social cognitive theory (SCT), Combined TAM-TPB (C-TAM-TPB), Innovation diffusion theory (IDT) and Model of PC utilization (MPCU). Hence, UTAUT has better predictive ability compared to other theories. A study conducted by (Tosuntas et al., 2014) postulated that UTAUT helps explicate around 70% technology adoption and usage. The four elementary variables of UTAUT (performance expectancy, effort expectancy, social influence, and facilitating conditions) are considered significant predictors of users' acceptance and intentions to use a technology (Nair, Ali & Leong, 2015). Past studies have applied UTAUT model in various contexts including mobile wallet (Madan & Yadav, 2016), m-banking (Tan & Lau, 2016), Internet banking (Sharma, Singh & Sharma, 2020) and smartphone adoption for flight bookings (Jeon et al., 2018). However, application of UTAUT being used in travelers' smartphone apps for hotel bookings is still at the nascent stage.
2.1. Performance Expectancy
It is an extent to which user perceive that using a particular app or technology will increase her/his performance. Performance expectancy is an important predictor of behavioral intentions for using a technology (Venkatesh et al., 2003). Parallel to this, Performance expectancy was also seen as a strong interpreter of behavioral intentions in various studies including mobile payment (Slade et al., 2015), mobile wallet (Madan & Yadav, 2016), e learning (Decman, 2015), mobile shopping (Lu et al., 2017) and purchase intentions (Martin &Harrero, 2012). Therefore, it is assumed that performance expectancy toward using smartphone apps for hotel bookings will influence traveler's behavioral intentions. Therefore, we hypothesize:
H1. Performance expectancy is positively associated with traveler's behavioral intention to use smartphone apps for hotel bookings.
2.2. Effort Expectancy
It is defined as the 'degree of ease associated with the use of a system' (Venkatesh et al., 2012). Travelers favor using a technology for booking purposes which is effort free and provides maximum benefits. Kang (2014) postulated that if technology is easy to use, the probability of users' adoption of that technology would be higher. Further, Venkatesh et al., (2003) stated that users' find there is less effort needed to perform and hence they are motivated and encourage using technology and finding good results. Various studies in previous literature have studied effort expectancy. These are social media (Gruzd, Staves & Wilk, 2014); internet banking (Martins, Oliveira, & Popovič, 2014), mbanking (Hew, Lee, Ooi& Wei, 2015; Koksal, 2016), and m-payments (Teo, Tan, Ooi & Lin, 2015) and, m-learning (Saedi et al., 2020). Therefore, it is postulated that if hotel patrons find hotel booking
apps trouble-free and uncomplicated, they are more convinced and are willing to use it to book hotel rooms. Therefore, we hypothesize:
H2. Effort expectancy is positively associated with traveler's behavioral intention to use smartphone apps for hotel bookings.
2.3. Social Influence
It refers to 'the degree to which an individual is influenced by his/her family/friends to use a certain technology' (Venkatesh et al., 2003). Ajzen (1991) pointed out that persons are strongly influenced by peer groups to use technology. The perception is that an individual would easily influence r important members of his/her life with his/her intentions (Nysveen et al., 2005). Various researchers found social influence as important determinant of behavioral intention in several contexts including m-payments (Saedi, Emran, Ramayah&Abhusham, 2020; Slade, Williams, &Dwivedi, 2014); mobile banking (Raza, Shah & Ali, 2019); mobile entertainment (Leong et al., 2013); m-commerce (Marinkovic, Dordevic & Kalinic, 2019; Tarhini, Alalwan&Shammout, 2019) and, e wallet (Malik, Suresh & Sharma, 2019). Travelers always prefer good accommodation when travelling, and hence decide on hotel bookings depending on the opinion of their family/friends/peer groups. Therefore, it is assumed that social influence guides traveler's behavioral intentions for hotel bookings through mobile apps. Thus, we hypothesize
H3: Social Influence is positively associated with traveler's behavioral intention to use smartphone apps for hotel bookings.
2.4. Facilitating Conditions
It is defined as "the degree to which an individual believes that organizational and technical infrastructure exists to support the use of a system" (Venkatesh et al., 2003). Maruping et al., (2017) state that facilitating conditions influences an individual to use a system. This factor was not included In the TAM model, but was added later by Venkatesh et al., in 2003 while proposing UTAUT as an antecedent of behavioral intentions. This factor was derived from different theoretical models as used in TPB, C-TAM-TPB, Ajzen, 1991; facilitating conditions in MPCU (Thompson et al., 1991). With the growth and advancement of the internet, users are highly prone to use mobile technology (Ahmed, 2016). Previous researches studied facilitating conditions and proved that it was positively associated with facilitating conditions in various contexts including m-learning (Kang et al., 2015); health & fitness apps (Higgins, 2016); banking service adoption (Zhou, Lu & Wang, 2010) and e-learning (Tan, 2013). Therefore, it can be inferred that facilitating conditions toward use of smartphone apps for hotel bookings will influence traveler's behavioral intentions. Thus, we hypothesize:
H4: Facilitating conditions are positively associated with traveler's behavioral intention to use smartphone apps for hotel bookings.
2.5. Hedonic Motivation
Hedonic motivation is defined as "fun or pleasure derived from using a technology" (Venkatesh et al., 2012). Davis (1989) found that users' intentions were significantly influenced by perceived enjoyment. Previous studies found hedonic motivation as a significant antecedent of behavioral intentions in various contexts including m-payment (Gupta & Arora, 2019; Patil, Tamilmani, Rana &Raghavan, 2020); e-learning (Khechine, Raymond & Augier, 2019); e-satisfaction (Alalwan, 2020) and; m-health (Alam, Hu, Kaium, Hoque &Alam, 2020). Thus we hypothesize:
H5: Hedonic Motivation is positively associated with traveler's behavioral intention to use smartphone apps for hotel bookings.
2.6. Price Value
Price value is when users perceive using a smartphone provides him/her quality services. In this study, we find that travelers believe the price value of using smartphone hotel apps is reflected in its value. Price value is derived from perceived value (Dodds, Monroe & Grewal, 1991) and considered a significant determinant of user's perceived worth of using particular technology despite its benefits. The cost for maintaining smartphone apps, mobile data cost for internet services and bills are also included in the price value (Machado, Pinheiro, Lee & Ahmed, 2016). Researchers in previous studies found association between price value and behavioral intentions in the context of behavioral intention (Lau, Choong, Wei, Seow, Choong, 2020); m-banking (Baabdullah, Alalwan, Rana & Kizgin, 2019; Raza, Shah & Ali, 2019); purchasing intention (Akgul, Yaman, Gecgil & Yavuz, 2019); elearning (Mehta, Morris, Swinnerton & Homer, 2019) and m-payment (Al-Saedi, Al-Emran, Ramayah & Abhusham, 2020). Thus, we hypothesize
H6: Price Value is positively associated with traveler's behavioral intention to use smartphone apps for hotel bookings.
2.7. Habit
It is defined as "the degree to which users believes technology use is instinctive or usual" (Ahmed, 2016). Users use technology and when they realize that it is easy and comfortable they become repeat customers. Various researchers found a positive relationship between habit and behavioral intentions in several contexts including m-payments (Slade ., 2015), mobile games (Ramirez-Correa et al., 2019), social networking markets (Beuttner, 2017), e-learning (Gunasinghe et al., 2019) and mobile banking (Moorthy, Chun, Chea, Wen, Joe, Chyi & Jia, 2019). It can be inferred that effort expectancy toward the use of smartphone apps for hotel bookings will influence traveler's behavioral intentions. Therefore, we hypothesize:
H7. Habit has a significant effect on traveler's behavioral intention to use smartphone apps for hotel bookings.
2.8. Perceived Trust
It is defined as "mutual consent between two parties that one party will not exploit the other's vulnerabilities" (Barney & Hansen, 1994, p. 176). It starts when an individual agrees with other's ideas and suggestions. Further, perceived trust is considered as an expectation that service providers provide to users (Gefen, Karahanna, and Straub, 2003). Previous researchers emphasized perceived trust based on consumers' acceptance and use of technologies due to risks and uncertainties associated with it (Lin, 2011). Previous researchers examined perceived trust in the context of purchase of online flight tickets (Suki & Suki, 2017), mobile wallet (Singh et al., 2020); e-shopping (Nghia, Olsen & Trang, 2020) and mobile payments (Talwar, Dhir, Khalil & Mohan, 2020). And extensive literature review revealed studies that mentioned insignificant impact on behavioral intentions; for instance online purchase of Generation Y (Muda et al., 2016) and; online games (Wu & Liu, 2007). Such mixed results from earlier studies was fascinating when examining the association between perceived trust on the behavioral intentions of travelers while booking flight tickets' via smartphone apps. Hence we hypothesize:
H8. Perceived trust is positively associated with traveler's behavioral intention for hotel bookings through smartphone apps.
2.9. Behavioral Intention
It is defined as the users' intent that helps to predict a particular behavior (Islam et al., 2013). It is also explained as the eagerness of an individual to use technology and continue to use it further (Venkatesh et al., 2012). Behavioral intentions are considered the strength of a person which helps him/her for a specified behavior (Fishbein & Ajzen, 1975). It is assumed that behavioral intention is the function of attitude and subjective norms only in earlier technological models as it directly helps to identify one's intention for specific behavior (Sheppard, Hatwick & Warshaw, 1988). Previous researches confirmed the strong relationship between behavioral intention and actual usage (Davis et al., 1989; Mafe, Blas & Mesias, 2010; Venkatesh et al., 2003; Venkatesh et al., 2012). Therefore, it can be inferred that behavioral intentions of travelers influence the actual usage of smartphone apps for hotel bookings. Thus, we hypothesize:
H9. Behavioral Intentions is positively associated with traveler's actual usage of smartphone apps for hotel bookings.
3. Research Method
3.1. Measurement
The items of performance expectancy, efforts expectancy, social influence, facilitating conditions, hedonic motivation, price value, habit, behavioral intentions and actual usage are taken from utaut2, a theoretical model developed by Venkatesh et al., 2013. The items of perceived trust are taken from (Slade et al., 2015). The items of questionnaire were measured on five-point Likert scale.
3.2. Sample and data collection
Data was collected from users who use smartphone apps for hotel bookings in the months of November and December, 2019. The respondents of this study were hotel guests in India, who used smartphone apps for hotel bookings. Hotel guests are more associated with travelling (Kamboj et al., 2018). While planning and travelling on a trip, they continuously use various technologies (smartphones, various apps and internet). Besides they also use it to read others review and ratings and also post their after travel based on their satisfaction. Before starting data collection, permission was taken from the hotel manager. Hotel guests were invited to the hotel lobby and the study's purpose was explained to them. They were encouraged to participate and so round 80% guests expressed willingness to fill the questionnaire. Before data collection, a few questions were asked to the respondents orally to confirm their eligibility. The questions were: 'Do you use a Smartphone?' 'Do you prefer smartphone apps? Have you used smartphone apps for hotel bookings earlier? Initially, the respondents felt shy, but as they read the information, they understood the context gradually and their interest increased. Therefore, we received adequate responses for use of smart phone apps for hotel bookings. Totally, 650 questionnaires were distributed among the respondents, from which 379 questionnaires with complete answers were received, providing a response rate of 58 percent. Table 1 indicates the respondent's profile.
Table 1. Demographic Profile of the Respondents
| Characteristics | Frequency | Percentage | |
|---|---|---|---|
| Gender | Male | 217 | 57.2% |
| Female | 162 | 42.8% | |
| Age | Below 20 | 44 | 11.6% |
| 21-35 | 121 | 31.9% | |
| 36-50 | 109 | 28.8% | |
| 51-65 | 56 | 14.8% | |
| Above 65 | 49 | 12.9% | |
| Employment | Employed | 117 | 30.9% |
| Status | Self-Employed | 92 | 24.3% |
| Student | 131 | 34.5% | |
| Others | 39 | 10.3% |
4. Data Analyses and Result
This study has applied PLS-Structural Equation Modeling (SEM) which is considered an important tool., PLS has been widely used for research in tourism(Cheung et al., 2008; Jeon et al., 2018). It can be used under the condition of non-normality (Hair et al., 2016; Hulland, 1999). In PLS, a bootstrapping technique is used to get path estimates directly. In the PLS algorithm, each indicator has flexibility to contribute to the composite score of the latent construct. I Indicators which provided weak relation to its latent construct are given lower weightage (Chin, Marcolin, & Newsted, 2003). The path models of PLS-SEM are made up of two models: outer model, called the measurement model and the inner model, called the structural model.
4.1. The measurement model
The PLS measurement model was examined by convergent and discriminant validity. The convergent validity in the measurement model was computed by examining composite reliability, Cronbach alpha and the average variance extracted (Fornell & Larcker, 1981). The cronbach alpha provides the alpha value for all indicators by treating them as equally reliable and does the saem for the constructs outer loadings. All values were more than the threshold values as mentioned in Table 2.
Table 2. Item Loadings, Composite Reliability, AVE, Cronbach Alpha Coefficients
| Construct | Scale | Loadings | Composite | AVE | Cronbach Alpha |
|---|---|---|---|---|---|
| Item | Reliability | ||||
| PE1 | 0.797 | ||||
| PE2 | 0.815 | ||||
| PE3 | 0.703 | ||||
| Performance Expectancy (PE) | PE4 | 0.803 | 0.861 | 0.609 | 0.788 |
| EE1 | 0.802 | ||||
| EE2 | 0.755 | ||||
| EE3 | 0.678 | ||||
| Effort Expectancy (EE) | EE4 | 0.890 | 0.864 | 0.616 | 0.788 |
| SE1 | 0.835 | ||||
| SE2 | 0.794 | ||||
| Social Influence (SI) | SE3 | 0.882 | 0.876 | 0.701 | 0.787 |
| FC1 | 0.866 | ||||
| FC2 | 0.802 | ||||
| FC3 | 0.861 | ||||
| Facilitating Conditions (FC) | FC4 | 0.813 | 0.903 | 0.699 | 0.857 |
| HM1 | 0.829 | ||||
| HM2 | 0.899 | ||||
| HM3 | 0.781 | ||||
| Hedonic Motivation (HM) | HM4 | 0.916 | 0.910 | 0.718 | 0.868 |
| PV1 | 0.883 | ||||
| PV2 | 0.886 | ||||
| Price Value (PV) | PV3 | 0.996 | 0.916 | 0.784 | 0.862 |
| H1 | 0.768 | ||||
| H2 | 0.906 | ||||
| Habit (H) | H3 | 0.833 | 0.875 | 0.701 | 0.786 |
| PT1 | 0.907 | ||||
| Perceived Trust (PT) | PT2 | 0.890 | 0.838 | 0.722 | 0.621 |
| BI1 | 0.916 | ||||
| BI2 | 0.915 | ||||
| Behavioral Intention (BI) | BI3 | 0.934 | 0.944 | 0.850 | 0.912 |
| Actual Usage (AU) | AU | 1.000 | 1.000 | 1.000 | 1.000 |
Discriminant Validity is an "extent to which the reflection of one variable doesn't show the reflection of some other variable" (Hulland, 1999). It is established when the square root of AVE mentioned in matrix diagonal is greater than the correlation between the constructs (Fornell and Larcker, 1981) as mentioned in Table 3.
| BI | AU | EE | FC | H | HM | PE | PV | T | SI | |
|---|---|---|---|---|---|---|---|---|---|---|
| BI | 0.922 | |||||||||
| AU | 0.853 | 1.000 | ||||||||
| EE | 0.459 | 0.344 | 0.785 | |||||||
| FC | 0.381 | 0.283 | 0.175 | 0.836 | ||||||
| H | 0.329 | 0.256 | 0.279 | 0.232 | 0.837 | |||||
| HM | 0.718 | 0.572 | 0.457 | 0.295 | 0.306 | 0.848 | ||||
| PE | 0.657 | 0.544 | 0.364 | 0.364 | 0.278 | 0.568 | 0.781 | |||
| PV | 0.581 | 0.561 | 0.308 | 0.252 | 0.181 | 0.475 | 0.429 | 0.885 | ||
| PT | 0.509 | 0.405 | 0.306 | 0.287 | 0.224 | 0.461 | 0.889 | 0.357 | 0.850 | |
| SI | 0.730 | 0.568 | 0.464 | 0.419 | 0.374 | 0.673 | 0.619 | 0.503 | 0.488 | 0.837 |
Table 3. Discriminant validity of constructs
4.2. Structural Model
PLS structural equation modeling was used to test the model and hypotheses. Performance expectancy (β=0.390,P<0.05), Social Influence (β=0.240,P<0.000), Hedonic motivation (β=0.282,P<0.05), Price value (β=0.192,P<0.05), Perceived trust (β=-0.190,P<0.05) were found to be statistically significant on behavioral intentions. Further, Effort expectancy (β=0.061,P=0.05), Facilitating conditions (β=0.045,P>0.05) and Habit (β=0.025,P>0.05) were not found statistically significant. In addition, Behavioral Intention (β=0.853, P<0.05) was also statistically significant on Actual usage. From figure 1, behavioral intention had the highest impact with the path coefficient (β=0.853,P<0.05) whereas Habit had the lowest impact with the path coefficient (β=0.025,P>0.05). The two values squared multiple correlations (R2) and path coefficient (β) values have the highest explanatory power in the structural model. The percentage of variance is depicted by the R2 of endogenous variable whereas the strength of relationship between constructs is depicted by the (β) values (Chin, 1998).
5. Discussion and Conclusion
This study, along with UTAUT2 model, s examined the role of various factors that influence behavioral intentions and actual usage. The finding of the study indicates that traveler's behavioral intention in using travel apps for travelers actual usage is significantly impacted by its determinants. Looking at individual determinants, the proposed (H1) was found statistically significant revealing that consumers travelers found their performance increased with use of smartphone apps. Among all determinants, performance expectancy was found the strongest. The results of this study indicate that travelers prefer to use smartphone apps for hotels as they perceive it provides them relevant, accurate and up-to-date information. The results were found to be consistent with previous studies (Bhatiasevi & Yoopetch, 2015; Jeon, Ali & Lee, 2018; Suki & Suki, 2017).
Further, the relationship association between effort expectancy and behavioral intentions (H2) was found insignificant indicating that smartphone apps require much effort for hotel bookings. The result of the study was also reported in earlier studies (Tarhini et al., 2016; Huang & Chuang, 2017). The proposed (H3) relationship between social influence and behavioral intentions was also significant which reveals that travelers' intentions are influenced by the recommendations and suggestions of others. Social influence is a degree in which other people believe that one should use smartphone apps for hotel bookings. The results of this study was similar to that of previous studies (Slade et al., 2015; Rondan-Cataluña et al., 2015; Tavares & Olieveira, 2016).
The proposed (H4) was found statistically insignificant indicating that supporting facilities like internet and support systems do not affect travelers' behavioral intention to adopt online apps for hotel bookings. The results of this study were similar to previous studies (Mahfuz, Khanam & Hu, 2016; Rondan-Cataluña et al., 2015).
Further, (H5) the impact of hedonic motivation on behavioral intention was significant indicating that s travelers do have fun and pleasure while using online apps for hotel bookings. Travelers are quite familiar with these apps and hence they enjoy and get pleasure when using it. . These findings were consistent with past studies conducted in the context of shopping behavior (Venkatesh et al., 2012; Ozturk, Nusair, Okumus, & Hua, 2016).
The proposed (H6) relationship between price value and behavioral intentions was found statistically significant which states hotel patrons seek hotel search apps and find that they are worth the price incurred. it. Travelers believe that the price value of using hotel apps reflects in its value. Similar results were reported by earlier studies (Alalwan et al., 2017; Mahfuz, Khanam, & Hu, 2016).
The proposed (H7) relationship between habit and behavioral intentions was found statistically insignificant. This might be due to the busy schedule of users who thus lacked the time to spend on smart phone apps. The findings of this study were in contrast with previous researches which were conducted in various contexts including job search apps adoption (Hew, Lee, Ooi & Wei, 2015) and apps adoption for shopping (Miladinovic & Hong, 2016).
The proposed (H8) relationship between perceived trust and behavioral intentions was found statistically significant. The perceived trust of travelers positively influenced their intentions while booking hotel rooms through smart phone apps. Travelers perceive the use of hotel booking apps to be reliable for hotel booking feeling it to be honest. Similar results were reported by previous studies also (Jeon et al., 2018; Suki & Suki 2017).
Further, the relationship between behavioral intentions and actual usage (H9) was found significant. This indicates that travelers behavioral intentions influence their actual usage for the adoption of smartphone apps for hotel bookings. Previous studies conducted by various researchers agreed with this result (Hosizah et al., 2016; Tan, 2013; Venkatesh et al., 2012).
R-Square of endogenous is considered: substantial=0.670, moderate=0.333 and weak=0.190 (Chin, 1998). The value of coefficient of determination for behavioral intention was 0.702 and for actual usage 0.728 which revealed that the proposed model was strong and had considerable power to explain the impact of all constructs on behavioral intentions and actual usage. For adequate model fit, standardized root mean residual (SRMR) value was less than 0.08. The value of SRMR in the model was 0.065 which was acceptable in this study. The 5000 iterations under bootstrapping were performed to analyze the path coefficients. Figure 1 and Table 4 describe the results of the path coefficient. The diagnostic tool provided by Tenenhaus, Amato and Esposito Vinzi (2005) was used to examine the goodness-of-fit (GoF) indices. Hoffmann and Birnbrich (2012) provided the cut-off values: GoF small=0.1, GoF medium=0.25 and GoF large=0.36. For this study, GoF values were 0.720 for behavioral intention, and 0.733 for actual usage, indicating an excellent model fit.
Table 4. Goodness of fit indices
| Constructs | AVE | GFI | R Square | |
|---|---|---|---|---|
| Performance Expectancy | 0.609 | |||
| Effort Expectancy | 0.616 | |||
| Social Influence | 0.701 | |||
| Facilitating Conditions | 0.699 | |||
| Hedonic Motivation | 0.718 | |||
| Price Value | 0.784 | |||
| Habit | 0.701 | |||
| Perceived Trust | 0.722 | |||
| Behavioral Intentions | 0.850 | |||
| Actual Usage | 1.000 | |||
| Average Score | 0.74 | |||
| AVE* R2 (BI) | 0.519 | 0.702 | ||
| AVE* R2 (AU) | 0.538 | 0.728 | ||
| (GoF= AVE* R2) BI | 0.720 | |||
| (GoF= AVE* R2) AU | 0.733 |
Table 5. Summary of test results for the structured model
| Hypotheses | Path | Standardized Coefficient | P value | Supported | Constructs | R-Squared |
|---|---|---|---|---|---|---|
| H1 | PE-BI | 0.390 | 0.000 | Yes | ||
| H2 | EE-BI | 0.061 | 0.050 | No | ||
| H3 | SI-BI | 0.240 | 0.000 | Yes | ||
| H4 | FC-BI | 0.045 | 0.146 | No | ||
| H5 | HM-BI | 0.282 | 0.000 | Yes | ||
| H6 | PV-BI | 0.192 | 0.000 | Yes | ||
| H7 | H-BI | 0.025 | 0.510 | No | ||
| H8 | PT-BI | -0.190 | 0.004 | Yes | Behavioral Intentions | 0.702 |
| H9 | BI-AU | 0.853 | 0.000 | Yes | Actual Usage | 0.728 |
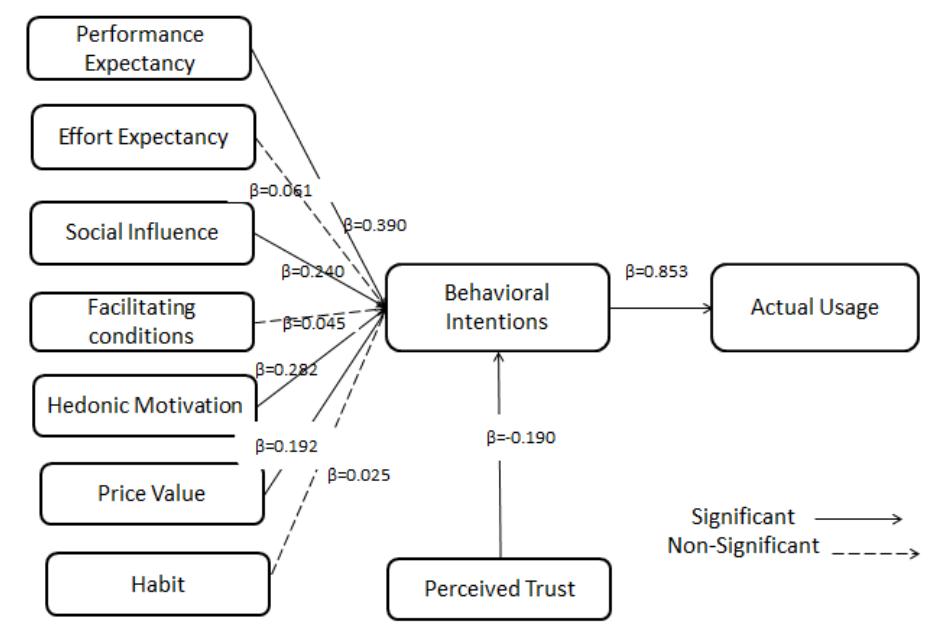
Figure 1. The Structural Model
5.1 Theoretical Implications
This study provided important theoretical contributions to travelers' smart phone apps adoption for online hotel bookings. It has extended the UTAUT2 model proposed by Venkatesh et al., (2012) with an additional construct, perceived trust. This study contributed to previous literature through i) testing the UTAUT model in the hotel booking context by using smart phone apps in developing countries, ii) integrating the UTAUT model by adding a new variable i.e. perceived trust, iii) determining various predictors that strongly influence travelers' intention to use smart phone apps for hotel booking. This study provides implications for policymakers, hotel managers, advertisers who create strategies and make decisions to influence travelers' smartphone apps adoption. Finally, it adds to the adoption of travelers' smart phone appsfor hotel booking literature which is at a nascent stage.
5.2 Managerial Implications
Indian travelers participate vigorously in travelling activities due to high disposable incomes (Arora & Lata, 2020). The massive growth of IT has penetrated the tourism market. The use of new technologies in hotel bookings can help in achieving a competitive advantage. Various factors determine travelers' behavioral intention to book hotel rooms using smart phone apps. This can further motivate other travelers. In addition, it will help decrease the administrative work of hotel managers in hotel bookings. The result of this study has proven performance expectancy as the strongest predictor of behavioral intention.
Related with utilitarian feature of smartphone apps, performance expectancy plays a pivotal role and hence, hotel managers should include all utilitarian features when creating their hotel apps to empower travelers' to opt for hotel booking through smart phone apps. These utilitarian features include response to travelers' queries, relevant and updated information about hotel rooms, their prices differences, services included in prices etc. This information will influence travelers' intentions and motivate them to use smart phone apps for hotel bookings. Further, the findings of study also present the significant role of hedonic motivation and price value on travelers' behavioral intention as these constructs have contributed a lot in terms of β values. Therefore, managers should focus on adding some flavor/fun and pleasure that travelers' can when using smartphone apps. Managers should also consider the economical usage of apps, as perceived trust was found as significant in travelers' intentions for hotel bookings through smartphone apps.
To maintain travelers' perceived trust, managers should provide accurate, up-to-date and reliable information and develop tools to secure travelers' information and transactions when booking hotel rooms through smartphone apps. By incorporating relevant information in the system, travelers' will feel the hotels are trustworthy and thus their tendency to use smartphone apps for hotel bookings will increase. Effort expectancy, facilitating conditions and habit were confirmed to having insignificant influence on travelers' behavioral intentions in using smartphone apps for hotel bookings. It states that resources and services provided by managers should be improved so that it can attract travelers' intentions after which they will use it on regular basis. This will be an additional force that increases their behavioral intentions for hotel bookings through smart phone apps.
5.3 Limitation and Future Scope
This study collected data from Indian travelers despite limitations and hence its findings cannot be generalized for travelers of other countries. They might have different perceptions and different ways of adopting apps. This study has not used any mediation and moderation analysis. So future researchers have to consider consumer scepticism and, personal cognitiveness as moderators during analysis. The study has proposed a theoretical framework which future researchers can use for a comparative analysis of travelers attention in different countries.