
1. Introduction
Travel and tourism have been playing a pivotal role in the economic development of several countries since the Second World War. With a contribution of US$ 8.8 trillion to the global GDP, Travel & Tourism has become a significantly large industry in the world, and it is estimated to grow at a rate of 3.8% annually (WTTC, 2019). The tourism industry contributed US$247 billion in 2018 to the GDP of India, which is equal to 6.7% of the total GDP of the country (WTTC, 2019). Thus travel and tourism are considered to be the largest service industry in India, providing heritage, cultural, business, medical and sports tourism (India.gov.in, National Portal of India, Travel & Tourism). Within the overall gamut of Indian tourism, tiger tourism has played a crucial role in attracting visitors (Cohen, 2012), especially in Central Indian states of Maharashtra, Madhya Pradesh, and Chhattisgarh. Around the globe, wildlife tourism has emerged as an important sector of tourism and is estimated to comprise 10% of the global GDP (Balmford et al., 2009; Weaver, 1999). Some tour operators have reported a growing demand for tiger watching tours (Curtin, S. 2011). However, the number of tigers in the wild has been drastically reduced from the tens of thousands over two hundred years ago to only two to three thousand worldwide as estimated in 2014 by the International Union for Conservation of Nature (Vaidyanathan, 2019).
India is home to roughly two-thirds of the global tiger population, but tigers are becoming isolated in reserves that prioritize tiger tourism. Vasan (2018) conducted a study on the experience of urban middle-class Indians who had gone tiger sighting in national parks, and she found that the majority of the safari tickets are sold online. Moreover, she discovered that tickets to premium zones with a higher probability of tiger sighting became sold very quickly. This can be explained by the fact that tourists who had gone on a safari may have failed to see any tigers during their visit, and thus they are likely to buy tickets to these premium zones that have a higher probability of tiger sighting. Most people who visit jungle resorts arrive with a singular objective of seeing a tiger in the wild, and it is not surprising to find tourists in these resorts discussing among themselves about sighting a tiger (Vasan, 2018). Because there is a demand for tiger sighting, there is consequently immense pressure on the managers of these resorts to ensure that tourists would see a tiger during their visit, as tiger sighting symbolizes success during a safari. In general, tigers are highly elusive, and a good majority of tourists often return without sighting a tiger.
From the above description, it is apparent that sighting a tiger is the sole point of interest in jungle safaris, but meeting this objective requires operators to plan and design the travel path. This challenge can be likened to the tourist trip design problem (TTDP) that is often encountered by tourists, given that one of the most important considerations for a tourist is the design of an optimal trip plan. According to Li et al. (2012), the TTDP is the process of designing a personalized tourist trip; it involves selecting the most attractive points of interest, and it can be modeled as an orienteering problem. Figure 1 shows a photo of a tiger sighting taken in November 2019 during a safari trip in the Kanha Tiger Reserve, which is located in the state of Madhya Pradesh in Central India.
Tourism consumption has a unique nature because it is mainly driven by constraints of time and financial resources (Lv et al., 2019). The orienteering problem occurs in the form of a routing problem in which the primary goal is to determine a subset of nodes to visit and in which order; moreover, the objective of solving the problem is to maximize the total score and not exceed the time budget (Gunawan et al., 2016). The TTDP involves planning routes for tourists according to their preferences and requirements while maximizing their entertainment and considering numerous constraints at the same time (Vansteenwegen & Van Oudheusden, 2007).
Figure 1. A photo of tiger sighting
A survey of relevant literature shows that existing studies have effectively contributed to the capability of personalized services. However, previous research has not yet explored the problem faced by tourists participating in wildlife safaris in selecting the optimal path for maximizing the probability of seeing a tiger, which is the point of interest in this instance. There are a total of 50 tiger reserves in India governed by Project Tiger, which is administered by the National Tiger Conservation Authority. According to the National Tiger Conservation Authority, by the year 2018 it was estimated that 2,967 tigers currently exist in India, while the total estimated global population of tigers is 3890. Despite these figures, the instances of tiger sighting by tourists visiting these tiger reserves are very rare, and most of the tourists fail to see a tiger during their visit.
2. Literature Review
In Kishnanji's (2019) study on ecotourism in Madhya Pradesh, she found that 52% of domestic tourists return highly dissatisfied after going on a jungle safari in the state's reserve forests because they were not being able to see a tiger, and they are likely to not return again. Vasan's (2018) study on the experience of urban middle-class Indian tourists going on tiger sightings was based on participant observation in a number of parks, namely the Ranthambore National Park in the state of Rajasthan, as well as the Bandhavgarh National Park and the Kanha National Park, both in the state of Madhya Pradesh. She observed that many national parks happen to be the only sites for tiger viewing in the wilderness for middle-class urban tourists. According to Vasan the sighting of a tiger is considered to be a personal achievement for the tourists, but tour guides lamented that the tigers in the parks are wild tigers that cannot be easily found on demand.
Cohen (2012) investigated the evolving nature of human interactions with tigers. In his study, Cohen classified the settings of human-tiger interaction into four types, namely fully natural settings, semi-natural settings, semi-contrived settings, and fully contrived settings. He noted that the human-tiger interaction in national parks and wildlife sanctuaries exemplifies semi-natural settings. Even though tiger tourism in these reserves has become an important part of domestic ecotourism in India, Cohen argued that with declining numbers of tigers, they are not easily sighted in the reserves. Lyngdoh et al. (2017) conducted a study of ecotourism surveying tourists in three tiger reserves in India, namely the Corbett Tiger Reserve, the Kanha Tiger Reserve, and the Tadoba-Andhari Tiger Reserve. In the study, the respondents mentioned that the prime attraction for their visit are the wild animals and tigers.
Sighting tigers during a trip to jungle safari is like tourist trip design problem (TTDP) which may superficially look easy to be solved and several routing alternatives may appear. However, computationally, this happens to be one of the toughest problems to solve. It is NP-hard in nature and may be mapped to the orienteering problem (Jana & Mitra, 2020).
The major role of TTDP-related research is to enhance the overall experience of a tourist (Wong & McKercher, 2012) as well as the competitive advantages of tourism destinations (Kang & Gretzel, 2012; Vitterso et al. 2000). Because of these aims, this domain of research has gained enormous interest over the past several decades (Hsu, Lin, & Ho, 2012; Lee et al., 2009; Liao & Zheng, 2018; Liu et al., 2014; Rodriguez et al., 2012; Tsai & Chung, 2012; Zheng & Liao, 2019; Zheng, Liao, & Qin, 2017). Hang et al. (2018) conducted a study for tourists in Jeju based on an analysis of data history by applying an association rule mining-based approach and a genetic algorithm optimization approach for the purpose of travel plan preparation for mobile users. They concluded that the application of a genetic algorithm for optimizing the travel route is the biggest contribution of this work. Chan Lu et al. (2011) applied the effective trip-planning approach when given travel time constraints, and they proposed a novel data mining-based approach named Trip-Mine for creating an optimal trip within a travel time constraint. Friggstad et al. (2018) explored the problem of an automatic and efficient generation of itineraries for travelers, and they noted that the orienteering problem is algorithmically an excellent model to be applied when planning a tourist itinerary in a city. The goal in orienteering is to maximize the reward that is derived from the visiting nodes
within a graph by starting and ending at a given node, and this reward is subject to a budget constraint in the length of the tour. Bolzoni et al. (2014) observed that solving the problem of trip planning is not just a matter of extending existing algorithms, since points of interest usually appear in clusters and not distributed evenly.
The orienteering problem has also received much attention from researchers in the past few decades, given that TTDP is a highly complicated and an arduous task because it involves selecting points of interest (e.g., tourist attractions) and scheduling trips (Rodriguez et al., 2012; Souffriau, Vansteenwegen, VandenBerghe, & Van Oudheusden, 2013; Zhu, Hu, Wang, Xu, & Cao, 2012). According to Verbeeck et al. (2017), the orienteering problem has several enterprising applications in defense, logistics, and tourism. The researchers conducted a study on a time-dependent orienteering problem with time windows, and they defined the orienteering problem on a graph in which the vertices represent geographical locations where a reward can be collected. In particular, they also proposed a mixed-integer problem formulation and a metaheuristic based on an ant colony system that they introduced. Fomin and Lingas (2002) were the first authors to explore the notion of a time-dependent orienteering problem and to claim that such a problem is a nondeterministic polynomially acceptable problem that has a high level of difficulty—also referred to as NP-hard. The basis of their claim is that the orienteering problem is NP-hard in nature. Abbaspour and Samadzadegan (2011) introduced a solution based on two adaptive genetic algorithms and multi-modal shortest path finding modules. Niraki and Kim (2009) proposed an ontology-based knowledge modeling technique using the analytic hierarchical process (AHP). Mikhailov et al. (2018) introduced the ontology tourist trip-planning services that allowed for interoperability between the services; such an ontology covered information on the tourists, their profiles, and preferences, the city, and its attraction, the tourist route, and context. According to Dellaert et al. (1998), many decisions that tourists make are not single independent choices of separate elements (e.g., destination, accommodation, or travel companions) but rather are complex multi-faceted decisions. In their study, they proposed a conceptual framework to understand multifaceted travel decisions.
Mikhailov and Kashevnik (2018) noted that the tourism industry began actively using internet technologies since the mid-1990s; they also observed that planning tourist trips and providing support for the decision of tourists is an object of considerable scientific interest. In their work, they presented the concept of a smartphone-based tourist trip-planning system. Personalized tourist information is essential for tourism recommendation systems used in handheld devices having a small screen (Kabassi, 2010), and e-commerce sites are rather impersonal and unfriendly. Hasuike (2014) proposed a route-planning problem for sightseeing with fuzzy random variables for travel times and satisfaction; it is worth noting that he included "tourist's tiredness" as a variable that impacts satisfaction. Miah et al. (2018) attempted to solve the trip-planning problems that tourists face by using crowdsourced data with some customized algorithms. It was found in one study that a satisfactory trip planning needs several key components, including automated suggestions for possible attraction sites or scenes, options to provide personalized information based on traveler's habits and interests, maximum coverage on sites of interest, and minimum effort in terms of transportation time on the route (Zhou et al. 2018).
Given the stance by Ostrowski et al. (2017) that the orienteering problem is a NP-hard problem, many researchers have proposed heuristics for tackling the orienteering problem using various approaches. Barzegar (2019) proposed a context-aware ontology-based route finding algorithm. According to Mehmood et al. (2019), the rapid growth of mobile phones has increased the interest in developing mobile applications for tourists; based on this trend, they aimed to provide an implementation and design of a travel route recommendation system based on user preferences. Gavalas et al. (2014) introduced two new cluster-based heuristics (i.e., TD_CSCR and TD_SlCSCR) that solves the Time Dependent Team Orienteering Problem with Time Windows for tourist route planning. They argued that the main objective for developing the algorithms was maximizing tourist
satisfaction. Penicka et al. (2017) conducted a study on the orienteering problem for a curvatureconstrained vehicle, and their study involved obtaining information related to the vehicle's heading angle at each target location. Along this line, electronic tour guides have been developed by Kramer et al. (2007) that allow their users to either abandon or alter tours at any point in time.
Alivand et al. (2015) conducted a study to analyze how travelers choose scenic routes using a route choice model called the path size logit (PSL) model. Sirirak and Pitakaso (2018) studied the issue of planning tourism routes and finding optimum market place destinations for agricultural produce transportation. Nie et al. (2009. p. 288) proposed a tourist route planning and navigation system, and it was implemented using location-based services (LBS). Mukhina et al. (2019) studied the orienteering problem with functional profits for multi-source dynamic path construction. Chan Lu et al. (2016) opined that there is not yet research on trip planning in combination with tourist packages in the literature pertaining to tourism. Accordingly, they presented a new approach named the Package Attraction-based Trip Planner (PAT-Planner) that combines tourist packages with tourist attractions, thereby personalizing trip planning and satisfying tourists' travel constraints. Chan Lu et al. (2012) observed that although research on travel recommendations has received a lot of attention, a constraint-based trip recommendation to meet a tourist's individual needs is still missing. In their study, they proposed a novel framework referred to as the personalized trip recommendation (PTR) for efficiently recommending personalized trips; this approach aims to meet multiple constraints that tourists have by mining a user's check-in behavior. According to Xiao et al. (2018), the tourism route plan currently lacks a consideration for individual needs; in their paper, the authors brought forward an interest tourism route plan algorithm based on an improved minimum spanning tree. The researchers concluded that this algorithm finds the optimal tourism route to meet the best motive benefits for tourists.
Tourists are often constrained by time and budget while visiting a region or city, and hence they usually cannot visit all places of interest Souffriau et al., (2010). In the study by Souffriau et al. (2010), the authors examined how the present state of research meets this problem by taking from the field of operations research using the orienteering problem and its extensions. Dolinskaya et al. (2018) evaluated the extent to which one can increase the probability of having a greater reward in an orienteering problem with stochastic travel times; they explored this notion by altering the paths between the reward nodes as travel times are revealed. Ghodge et al. (2019) observed that several people are faced with time management issues with traveling because of improper schedule. In view of this constraint, the authors proposed a system wherein the users only enter the place they intends to visit, and the system then displays all the details of that particular place plus the nearby places that are worth visiting. Zheng et al. (2019) conducted a study to solve the TTDP in an urban context by adding a new dimension of a hotel search. From the above discussions it may be concluded that researchers in the past have attempted to explore different methods to help tourists solve their routing problem, but past works have so far ignored finding solution for the problem, the safari tourists encounter, in tiger sighting.
3. Research Method
3.1. Research Data
The data for this research came from ten of the forest safari guides who accompany tourists when they undertake safaris in the Pench reserve forest in Central India, where the study was conducted. This tiger reserve was selected for our study because it is one of the largest and premier tiger reserves in Central India, attracting an average, 100,000 tourists every year. The data was collected for the period of October 2018 to February 2019. The authors spoke to these guides and asked them to record the spot (path) and time when they cite a tiger for the period of data collection. The authors visited this reserve forest once every month during this period to collect this data from these guides. These guides diligently collected the desired data and gave it to us. Our work is based on the analysis of this data, such collected.
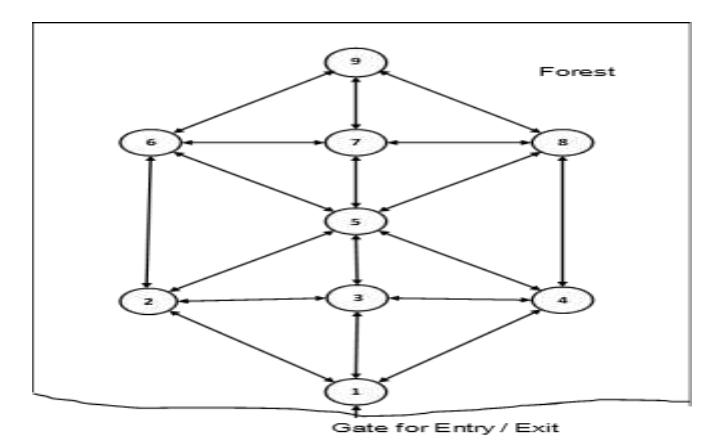
Figure 2. Road map of the forest
The objective of the paper is to find travel paths within a forest that maximize the probability of sighting a tiger within the allocated time of a safari trip. Timings for the safari for entering the forest and exiting from the forest vary according to the season. In winters, due to the shorter duration of daylight hours, the morning entry time is delayed, and evening exit time is advanced.
Figure 2 gives a simplified road map of a part of the forest operated through the entry gate. Although straight lines connect different junctions in the figure, the actual paths are curvy and pass through different sloping gradients. The above connections are by kaccha road, and the condition of the road is extremely bad in certain patches.
The probability of viewing tigers to various paths (i→j) was assigned based on the survey carried out by 10 tour guides that accompanied the transport vehicles for the past five months. The viewing of the tiger may have a seasonal effect and also change with time depending on environmental factors, and hence, a system of keeping a record of tiger sights can help tourists to select paths to maximize the chances of tiger visibility.
From the number of tiger sightings reported by the jungle safari operators, the probability of tiger sighting in different paths of the forest is estimated and compiled in table 1. For example, the road connecting points 4 to 8 and points 6 to 9 have the highest probability of sighting a tiger. The chances of tiger sighting in these two routes are 2.4%, whereas, in some routes such as in path 3 to 4, the viewing chance is only 1%. The table provides a quantitative measure of tiger viewing chance in different routes. It must be borne in mind that the estimated probability number is based on actual sighing of tigers by the tour guides during the study period. In contrast to other scenic objects, tigers are moving objects, and hence the probability estimated would be changing with time and seasons. It would therefore always be preferable to refer to recent estimates in this regard.
Number of tiger sightings during the past five months when the survey was conducted have been converted to a probability of viewing a tiger in a single path from one point to another. Table 2 presents a time matrix that gives average travel time in safari from one point to another that includes normal stoppages at different places for sightseeing and watching other animals of the forest. Although catching a glimpse of the tiger during safari trip is the most rewarding experience for the visitors, the forest provides sighting of many other wild animals and birds that enriches the experience of visitors. Depending on the distance between the points, condition of the road, sighting of flora and fauna, the actual time taken vary widely. The figures mentioned are the average time taken in different previous trips and can be used as a guide for estimating travel time.
| From | To | |||||||||
|---|---|---|---|---|---|---|---|---|---|---|
| 1 | 2 | 3 | 4 | 5 | 6 | 7 | 8 | 9 | ||
| 1 | x | 0.012 | 0.010 | 0.012 | x | x | x | x | x | |
| 2 | 0.012 | x | 0.010 | x | 0.012 | 0.016 | x | x | x | |
| 3 | 0.010 | 0.010 | x | 0.010 | 0.012 | x | x | x | x | |
| 4 | 0.012 | x | 0.010 | x | 0.018 | x | x | 0.024 | x | |
| 5 | x | 0.012 | 0.012 | 0.018 | x | 0.012 | 0.014 | 0.016 | x | |
| 6 | x | 0.016 | x | x | 0.012 | x | 0.016 | x | 0.024 | |
| 7 | x | x | x | x | 0.014 | 0.016 | x | 0.016 | 0.016 | |
| 8 | x | x | x | 0.024 | 0.016 | x | 0.016 | x | 0.020 | |
| 9 | x | x | x | x | x | 0.024 | 0.016 | 0.020 | x | |
Table 1. Probability matrix of tiger sighting in a single visit
Table 2. Travel time matrix between points
| To | ||||||||||
|---|---|---|---|---|---|---|---|---|---|---|
| From | 1 | 2 | 3 | 4 | 5 | 6 | 7 | 8 | 9 | |
| 1 | x | 30 | 20 | 25 | x | x | x | x | x | |
| 2 | 30 | x | 24 | x | 28 | 35 | x | x | x | |
| 3 | 20 | 24 | x | 22 | 20 | x | x | x | x | |
| 4 | 25 | x | 22 | x | 30 | x | x | 40 | x | |
| 5 | x | 28 | 20 | 30 | x | 27 | 18 | 28 | x | |
| 6 | x | 35 | x | x | 27 | x | 24 | x | 26 | |
| 7 | x | x | x | x | 18 | 24 | x | 23 | 15 | |
| 8 | x | x | x | 40 | 28 | x | 23 | x | 28 | |
| 9 | x | x | x | x | x | 26 | 15 | 28 | x | |
The above table gives the average time taken from point "i" to point "j" in minutes. Symbol x indicates the absence of any direct path between points.
3.2. Methodology
We adopted an Operations Research technique that can be used to plan the route of visit for better chances of tiger sighting. Vansteenwegen (2008) recognized that the Orienteering Problem (OP) could be used to model Tourist Trip Design Problems. For using OP, first, a set of available points available for the visit is to be identified, and the travel time between the locations are to be ascertained. Figure 2 gives the available locations for the forest where the preferred routes are to be found out. Table 2 presents a matrix that gives the average time taken to travel between different points, whereas table 1 gives the average probability of tiger sighting in an individual path. The objective is to find a route that can maximize the chances of tiger sighting. Although the starting and ending points of an OP can be different, yet in this case, it will be the same as at the end of the jungle safari vehicles will return at the same point (point 1 in figure 2). The total time of traveling in the jungle cannot exceed 120 minutes put as a predetermined value based on average time spent by jungle safari. Another relaxation from the standard OP is that the individual locations can be visited more than once. A mathematical formulation of the problem is given below:
\[Max \sum_{i=1}^{n-1} \sum_{j=2}^{n} S_{ij} x_{ij}\]
Subject to
\[\sum_{i=1}^{n-1} \sum_{j=2}^{n} t_{ij} x_{ij} \le T_{max}\] \[ij \in \{0,1\}, \ \forall i, j = 1, ..., n\] where n is the number of available locations; the variable xij takes the value of 1 if the solution chooses travel between the locations i and j; otherwise, it takes value 0; each path from i j has a score of probability of success Sij 0; location 1 is the starting point, location n is the ending point of the trip; the time taken to travel from the location i to location j is tij . The goal is to maximize the total score without exceeding a given time Tmax. Some conditions of the standard OP is relaxed, since though the starting and ending points are the same in our case; the same points can be visited more than once.
The orienteering problem is an NP-Hard problem, and a number of algorithms are developed for solving such problems. We developed a random path selection process that starts from a starting point and travels to an available path from that junction, based on the probability of sighting a tiger per unit of time on an available path.
For each path j[n] starting from point "i", the following score was estimated
, where gives the probability of seeing a tiger in the available path per unit of time, is the prior probability of sighting a tiger in the path , is the average time for traveling from . The probability of selecting a path j[n] is based on the value and higher the value, higher is the probability of selecting that path. As the tour has to be completed within a predetermined time allocation (say 2 hours), the main criteria for selecting a new path from is that total time spent to reach point j and return from point j to the starting point 1 should be completed within the pre allocated time . For a visitor located at the point "i", the following time check needs to be done before extending the journey further.
\[T_s + t_{i,j} + t_{j,1} \le T_A\]
Where Time already spent in the forest, is the travel time from , is the travel time from destination "j" to exit gate at point "1" and is the time allotted for the safari trip (120 minutes).
With the above time constraint, the tourist can travel on any path without any path restriction and can visit a junction more than one time if he so desires. While traveling in the forest, the probability of sighting a tiger also increases,
\[p_{s,i} = p_s + p_{i,i}\]
Where = probability of sighting a tiger in the path already traveled, is the probability of sighting a tiger in the path and is the probability of sighting a tiger after reaching destination j.
When the tourist returns to the starting destination after traveling randomly through different paths of the forest, the probability of sighting a tiger on the entire trip would be , the sum of probabilities of sighting a tiger on the individual paths traveled by him.
The above problem can be described as an orienteering problem, where the objective is to maximize by selecting appropriate travel paths within the forest and completing the travel within the allocated time .
As an orienteering problem is an NP-hard problem and difficult to solve, we adopted a simple random traveling algorithm wherein a traveler would travel randomly in different paths within the forest and return to the starting point before the completion of . The algorithm is as follows:
Start from point 1 (starting point, also the exit point)
1. Initialize count parameters:
\[T_s=0\]
\[p_s = 0\]
2. Reach starting point for next path
Find different path emanating from point "i" to immediate next point For each path j[n] starting from point "i", the following score was estimated.
\[s_{j[n]} = \frac{p_{i,j[n]}}{T_{i,j[n]}},\] which gives the probability of seeing a tiger in the available path per unit of time. The probability of selecting a path is based on the score and higher the score, higher is the probability of selecting that path. After a path j[n] is tentatively considered for the next leg of the journey, check the following conditions related to total available time.
If , proceed towards the chosen path , else select another path among
Update the counters
\[p_s = p_s + p_{i,j[n]}\]
\[T_s = T_s + T_{i,j[n]}\]
\[i = j[n]\]
Repeat step 2 3. If no available path from the point "i" meets the condition , it indicates that no more time is available to take the trip further and it is the time to return to starting point 1.
Final value of counters
\[p_a = p_a + p_{i,1}\]
\[T_a = T_a + T_{i,1}\]
The above algorithm estimates the total time spent in the forest and the probability of sighting a tiger during the trip. As the trip was based on a random selection of routes, the probability of tiger sighting will depend on the path chosen. In order to search for a better alternative, the above algorithm was run 100 times, and each time a different route was chosen. The top 20 paths that have a higher probability of viewing a tiger are listed in table 3.
4. Results and Findings
Using the dataset given in Tables 1 and 2 and applying the algorithm explained in the methodology section, we developed several routes and estimated the sighting probability and time taken for each such trip. Although an orienteering problem is an NP-Hard problem, running the above simulation 100 times in an i5 personal computer does not take more than one minute and can be treated as an accepted solution for optimum tour path. We have also run the loop 1000 times, but the best path did not improve and hence conclude that an acceptable solution to the problem can be found by running the simulation about 100 times.
Table 3 gives a list of routes that have a high probability of sighting a tiger. Route 1 35 7 9 8 9 67 1 has the highest probability of 16.8% of sighting a tiger, and the tour can be completed in 237 minutes. Route at sl no 20 has a probability of only 12.8%. It is, therefore, important that instead of visiting the forest in a random path, the path that has high probability of tiger sighting is chosen by the visitors.
| Table 3. | Results of the top 20 paths |
|---|
| Sl # | Path sequence | Travel Time | Probability | |||||||||
|---|---|---|---|---|---|---|---|---|---|---|---|---|
| 1 | 1 | 3 | 5 | 7 | 9 | 8 | 9 | 6 | 7 | 1 | 237 | 0.168 |
| 2 | 1 | 4 | 8 | 5 | 7 | 8 | 9 | 7 | 5 | 1 | 235 | 0.154 |
| 3 | 1 | 3 | 4 | 8 | 5 | 6 | 9 | 7 | 1 | 236 | 0.148 | |
| 4 | 1 | 4 | 8 | 5 | 8 | 9 | 7 | 5 | 4 | 1 | 237 | 0.148 |
| 5 | 1 | 4 | 8 | 7 | 6 | 7 | 5 | 7 | 1 | 230 | 0.148 | |
| 6 | 1 | 3 | 1 | 4 | 8 | 9 | 7 | 8 | 5 | 1 | 239 | 0.146 |
| 7 | 1 | 2 | 6 | 9 | 6 | 7 | 8 | 4 | 1 | 1 | 229 | 0.144 |
| 8 | 1 | 2 | 5 | 7 | 6 | 7 | 9 | 8 | 4 | 1 | 232 | 0.142 |
| 9 | 1 | 4 | 8 | 7 | 9 | 6 | 2 | 5 | 1 | 232 | 0.142 | |
| 10 | 1 | 2 | 6 | 9 | 6 | 5 | 8 | 1 | 237 | 0.140 | ||
| 11 | 1 | 4 | 5 | 8 | 7 | 5 | 7 | 6 | 5 | 1 | 233 | 0.140 |
| 12 | 1 | 4 | 3 | 4 | 8 | 7 | 9 | 6 | 2 | 1 | 238 | 0.140 |
| 13 | 1 | 3 | 1 | 4 | 8 | 9 | 7 | 5 | 2 | 3 | 238 | 0.138 |
| 14 | 1 | 4 | 5 | 4 | 8 | 5 | 7 | 5 | 1 | 229 | 0.138 | |
| 15 | 1 | 3 | 4 | 8 | 9 | 8 | 7 | 1 | 219 | 0.136 | ||
| 16 | 1 | 4 | 8 | 9 | 6 | 5 | 3 | 4 | 3 | 230 | 0.134 | |
| 17 | 1 | 2 | 5 | 7 | 9 | 7 | 5 | 4 | 5 | 4 | 239 | 0.132 |
| 18 | 1 | 4 | 8 | 5 | 8 | 7 | 5 | 3 | 4 | 1 | 229 | 0.132 |
| 19 | 1 | 4 | 8 | 9 | 8 | 9 | 7 | 1 | 222 | 0.128 | ||
| 20 | 1 | 2 | 5 | 8 | 9 | 7 | 9 | 7 | 1 | 217 | 0.128 | |
The chances of tiger sighting in all the above-mentioned simulated routes are compiled and sorted in descending order of probability of success. The top 20 routes that offer a high probability of tiger sighting is presented in table 3. Route 1 35 7 9 8 9 67 1 has the highest probability of 16.8% of sighting a tiger, and the tour can be completed in 119 minutes. Route at sl no 20 has a probability of only 12.8%. There are other routes that have even less probability of tiger sighting. It is, therefore, important that instead of visiting the forest in a random path, the path that has high probability is chosen by the visitors.
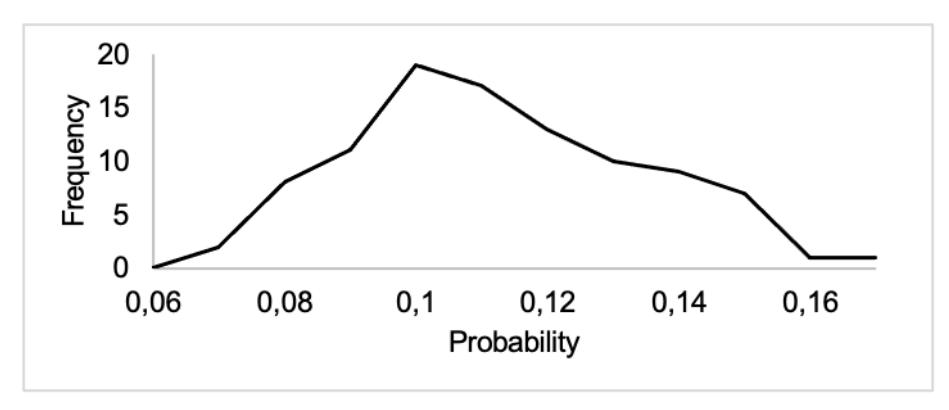
Figure 3. Frequency polygon of the probability of tiger sighting 100 simulated routes
The probability of tiger sighting in the 100 simulated paths are presented in a frequency polygon format in figure 3. From the plot, it is evident that the probability of tiger sighting in a safari trip is about 10% if travel is undertaken on random paths. This probability can be increased to more than 15% when routes are selected based on the aforementioned algorithm. Figure 4 depicts the probability of tiger sighting in different routes.
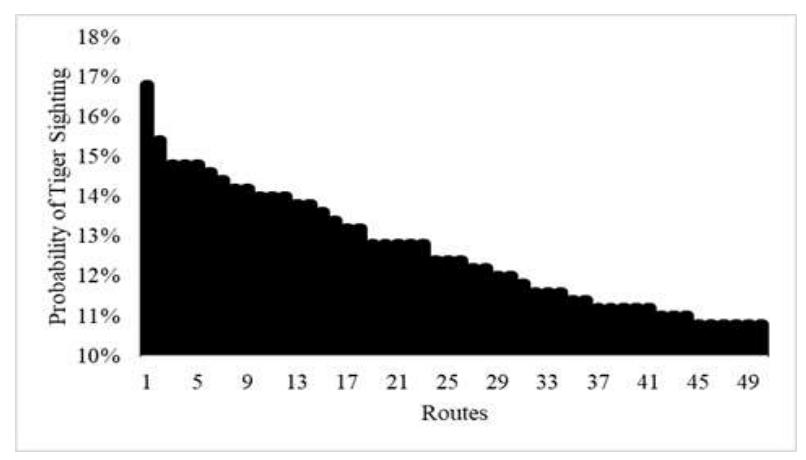
Figure 4. A diagram showing the probability of tiger sighting in top 20 routes
5. Discussion and Conclusion
This paper aimed to provide a model for reserve forest marketers that could help them identify routes (i.e., paths) in a forest with a higher probability of tiger sightings, which is a common point of interest for tourists who go on a jungle safari. Jungle safari marketers often feel the intense pressure of needing to provide assurance to tourists that they would sight a tiger during the safari (Vasan, 2018), since they may never return again if they return disappointed (Kishnanji, 2019). Safari jeeps traveling across the jungle often depend on electronic gadgetry when searching for tigers; safari guides have a tendency to gather at the same location when one vehicle informs the others of a tiger sighting, consequently resulting in mayhem (Cohen, 2012). Some forest resorts even offer night safaris due to the pressure of needing to guaranteed tiger sightings for tourists, despite the prohibition of night safaris (Cohen, 2012).
Forest resort managers are seen to use a number of practices in trying to ensure tiger sighting by tourists. One such practice is to bait the tigers by throwing them meat in order for tourists to catch a view of them with the help of high powered spotlights. One of the national parks in Central
India was criticized by a foreign environmental biologist for using a radio telemetry system to track tigers in order to show them to tourists; interestingly, tourists found this practice to be disappointing because it made them feel like they were visiting a kind of circus instead of a safari (Cohen, 2012). Within and around Indian tiger reserves, hundreds of accommodation facilities such as resorts, jungle lodges, forest camps and hotels have been constructed in view of the growing demand for forest safaris and specifically for tiger sighting. Outside the parks, tiger habitats and corridors have been taken over by tourist accommodations as well (Karanth & Karanth 2012).
It can be inferred from these points that forest destination managers sense much pressure in ensuring that tourists visiting their facilities could see tigers in their natural habitat as much as possible. As the literature survey has shown, there has not yet been any study that has suggested any viable models for them, nor has any study addressed their dilemma in finding a path that can offer higher chances of tiger sighting within the limited time available for a safari. Therefore, managers can only depend on the methods discussed above, and these methods usually result in zero tiger sightings and tourists being disappointed. This problem is similar to the TTDP, which is also termed as an orienteering problem and is characterized as NP-hard in nature.
A number of researchers have attempted to provide models for solving the route-planning problem of different types of tourists in different contexts by applying various methods (e.g., Gavalas et al., 2017; Verbeeck et al., 2017; Hang et al., 2018; Lu et al., 2011; Friggstad et al., 2018; Bolzoni et al., 2014; Niaraki & Kim, 2007; Dellaert et al., 1998; Mikhailov et al., 2018; Kabassi, 2010; Hasuike, 2014). Although these methods address the problem of tourist route planning in different contexts that come close to the orienteering problem, our study is different from past studies since the context of our study is distinct from them. The past studies have mostly focused on 'points of interest' that are static in nature (e.g., lakes, mountains, heritage sights, and scenic routes), whereas our study focused on paths and not points. The same path can be visited many times since the point of interest in the context of our study is a tiger, which is a mobile object itself that is chased by another mobile object, namely a safari jeep. Hence, our problem is different from a typical orienteering problem that has its points of interest as static objects. Moreover, points of interest in other contexts are different for different tourists, but in our case, tourists taking jungle safari all have a single point of interest, namely tiger sighting.
Because the tiger is a moving object and that sightings can be affected by seasons, applying our algorithm model requires periodical data collection in order to achieve the desired result of identifying an optimum tiger sighting path, specifically one that provides a higher probability of tiger sighting within the given limits of time allotted for a safari. Hence, our study proposed a model that fills an essential gap in tourism literature and has meaningful implications for forest destination managers in helping them find the optimum path to follow for tiger sightings.
This study is conducted before the onset of the COVID pandemic, and currently, all jungle safari trips are stopped due to COVID. Once tiger tourism is resumed, the orienteering method described in the study can be applied to the last few days of tiger sighting data to derive optimum travel paths.
6. Managerial Implication
Destination managers typically have a common objective of giving full satisfaction to their visitors so that visitors develop destination loyalty and return to these destinations again, given that destination loyalty ensures a future revenue stream for destination managers. In the context of forest destinations, tourists can be satisfied only when they see a tiger in its natural habitat. The theory of destination loyalty has been recently expanded by adding one more influencing factor, namely the factor of the sensory impression (Lv et al. 2020), which in this context of a jungle safari is, tiger sighting. Hence, it can be concluded that forest resort managers will likely not succeed in satisfying their customers unless they are able to provide them the experience of sighting a tiger. The only way for tiger sightings to be guaranteed is for tigers to be in captivity, but this does not
serve the purpose of a jungle safari, given that forest reserve tourists are interested in seeing tigers in the wilderness. Forest resort managers have been using traditional methods to satisfy their visitors by adopting techniques such as baiting the tigers, using a radio telemetry system for tracking the tigers, and using electronic gadgetry. Safari jeeps that enter a forest reserve mostly depend on luck, and this can be problematic because delivering customer satisfaction that leads to customer loyalty cannot be left to pure luck and chance (Vasan, 2018).
Applying this proposed model could result in managers adopting a scientific approach rather than using a purely random search by crisscrossing the jungle. If there could be a systematic and periodic collection of tiger sighting data in terms of path and time, the proposed model can provide a scientific approach to the selection of optimal path in the jungle with a higher probability of tiger sighting. To conclude, this model can be of some help to forest destination managers in providing better chances of success in tiger sightings and subsequently create a higher destination loyalty for their destinations. According to Chatterjee & Rishi (2020), DMOs should invest in group transportation facilities and make larger rooms available with more beds at reasonable costs to motivate guests to stay longer. In general, the tourists traveling in large groups (four and above) should be incentivized to stay longer. A longer stay produces higher revenues for destinations. Destination loyalty is a critical success factor in tourism marketing, and it cannot be dependent on random chances. One limitation in using the proposed model is the need of frequent data collection on tiger sightings. More research may need to be conducted in different reserve forests to further refine and test the effectiveness of the proposed model in order to produce a better generalization of the findings.