
1. Introduction
In recent years, the service sector has seen substantial development in the country's economy. (Rathore et al., 2019; Yousuf et al., 2019). There has been an average rise of 5.55 % during the previous five years (2015–2018) (Nadeem et al., 2019). Service Sector in India remains the primary engine for growth which contributed 53% to Gross value added at Present prices in financial year 2020-2022 (IBEF,2022). These figures are till January 2022. The reports by KPMG suggest that India's hospitality sector is anticipated to boom at 16.1% CAGR to cross Rs 2796.9 thousands core in 2022. Due to the intense competition in the hotel industry today, new operating ways are required. The creation and execution of numerous new services that may serve as a powerful impetus for advancement and expansion are one of the key themes in this field (Ravishankar and Christopher, 2020). The restaurant business is undergoing significant transformation because of variables such as changes in consumer lifestyles, perceptions, education levels, and awareness because of social media. Consumers today expect a quick and prompt response, as well as services that are tailored to their specific needs (Ivkov et al., 2018). Restaurants can innovate existing products and services or launch a whole new product or service. For example, the restaurant's environment may positively or negatively impact guests' perceptions and the restaurant's vision. Dining out entails more than just going out to eat (Satti et al., 2017). Quick Service Restaurants (QSRs) are a type of company that sells food and beverages (Alfiero et al., 2017) and are quickly expanding (Win, 2016). The QSRs primarily target millennial professionals and employees in the 15 to 40 age range and provide both quick meal cuisines and minimal table service (Credit Analysis and Research Report, 2019). According to a recent Tech Sci Research study (2020), the market for quick-service restaurants in India is expected to expand at a compound annual growth rate (CAGR) of more than 18% between 2020 and 2025.
Innovation is the key to success in Quick Service Restaurants (QSRs) (Musonera, 2019). The services industry's innovation serves as a stimulus for the sector's economic growth (Snyder et al., 2016). Innovations are the introduction of new services that are connected to the goal. Because new services are delivered in many forms, service sector innovations are diverse (Ravishankar & Christopher, 2020). Innovativeness has not only stimulated the interest of practitioners, but it has also aroused the interest of academics, who are investigating the influence of various innovation criteria on company success (Bhat and Sharma, 2021). The capacity to innovate is essential for the hotel industry's modernisation and competitiveness (Fernández et al., 2021). To put it another way, innovativeness refers to the innovative service cues that influence consumer perception when they encounter the operation's intangible values (Truong et al., 2020).
According to the OECD (2005), innovation is defined as a "new or better service or product, process, marketing strategy, and organisational method." According to the OECD (2005), product innovation introduces a new or considerably enhanced item or service in terms of its features or usage. Adopting new or substantial enhancements in the production or delivery processes is called process innovation. Marketing innovation refers to the use of new marketing strategies, which may include significant modifications in product design or packaging, positioning, promotion, or pricing. Service innovation is viewed as a long-term strategy for increasing value through enhancing goods, services, or new ways (Yeh et al., 2019). Innovation is currently a burning subject in manufacturing, information technology, and finance, among others (Biancolino, Maccari, & Pereira, 2013; Lu & Tseng, 2010; Tigu, Iorgulescu, & Ravar, 2013). However, in the hotel business, innovation is a topic that is seldom discussed and researched (Escobar & Parra, 2011; Kessler, Pachucki, Stummer, Mair, & Binder, 2015; Luoh, Tsaur, & Tang, 2014; Nieves, Quintana, & Osorio, 2014; Nieves & Segarra Ciprés, 2015; Thomas & Wood, 2014; Tigu et al., 2013). Zehrer et al. (2015) opined that innovation is a competitive economic advantage responsible for introducing new items to the market or the implementation of new procedures in the manufacturing cycle. Furthermore, earlier research on the impact of service, marketing, and process innovation on customer satisfaction by Weng et al. (2012), Yeh et al. (2019),
Chuang and Hsu (2012), Tsai and Hsu (2012), Lee et al. (2015), and Nkemkiafu et al. (2019). Innovation studies are still being developed in service businesses such as the hotel industry (Divisekera & Nguyen, 2018; Hjalager, 2010; Zehrer et al., 2015). In the Indian context, no relevant research addressing innovation assessment in QSRs has been discovered. Therefore, the present study is a significant attempt to bridge this gap by examining the impact of IP on CE and CS. Further, the study will evaluate the impact of Innovation on CL in QSRs in Northern India.
2. Literature Review and Hypothesis Development
2.1. Quick Service Restaurants
Quick Service Restaurant (QSR) can be defined as a business organization that encompasses the sale of food and beverages (Alfiero et al., 2017) and this sector has shown a rapid growth (Win, 2016). The QSRs offers both quick food cuisines with minimum table service, and are largely focused at young segment in the 15 to 40 age group (Credit Analysis and Research Report, 2019). The QSR is fast-food establishment the traits of which are restricted set of choices. The food is usually already cooked or instantly prepared food (Edwards, 2020). QSR is often referred to as fast-food restaurants (Ottenbacher and Harrington, 2009). It is usually famous for rapid services which are offered overthe-counter for taking or dining out (Parsa and Kwansa, 2002). Moreover, QSRs are usually famous for offering and serving meals which are affordable and with minimum cost. QSR food is incredibly mellow and prepared on a massive scale with a uniform cooking and manufacturing process. Consumers in today's world do not stand in line for long periods of time to enjoy any type of product or service, unless that gear is of greater importance and importance than the time spent waiting (Bielen and Demoulin, 2007). QSRs are well-known for their quick turnaround times between ordering over the phone and receiving food for dining or takeout (Parsa and Kwansa, 2002). Therefore, the main reasons for the popularity of fast-food restaurants are inexpensive, good food value, easily accessible at reasonable prices (Thackston, 2013 QSRs have maintained service quality, standard, and ambiance throughout all outlets, and are expected to grow dramatically in India. (Sviridova and Tarasova, 2019).
2.2. Innovative Practice (IP) and Customer Experience (CE)
The ability to effectively implement new ideas, processes, goods, or services, as well as the ability to alter and adapt, is characterised as innovation. It is characterized by anything different from business as usual or marks a break from prior practice (Divisekera & Nguyen, 2018; Fraj, Matute, & Melero, 2015; Hjalager, 2010; Kallmuenzer, 2018).
One of the most important aspects of a company's success is innovation, which is necessary to get a competitive edge (Calik et al., 2017). Innovation's primary objective is to enhance customer service and goods and customer happiness, boost productivity, lower costs, and generate possibilities (Dantas & Moreira, 2011). The notion of experience design is not new (Carbone and Haeckel, 1994; Pullman and Gross, 2004). CX design is seen as a strategic way to gain distinctiveness and long-term competitive advantage in the hospitality sector (Bergs et al., 2020). The intended CX represents the provider's point of view and contains the features of the experience delivery that the provider has intended and implemented (Ponsignon et al., 2017). Customer experience monitors a journey that leads to service interactions, continues during service delivery, and continues even after service delivery (Berry et al., 2002). In reaction to disruptive innovation from new entrants, incumbent businesses are emphasizing customer experience (Bradley et al., 2015). Generally, customer experience research will consider the consumer's cognitive, emotional, initial, social, and spiritual responses to all encounters with the firm (Bolton, 2016; Brakus et al., 2009; Lemon & Verhoef, 2016).
According to Meyer and Schwager (2007), customer experience is an impression that customers leave that is linked with the inner finding when utilizing new services in restaurants and dealing with various interactions with service providers, whether direct or indirect. All hotels invest in technology and digital technologies to give clients more efficient and convenient services. Innovativeness is dependent on people's abilities, knowledge, and experience (Molina-Morales & al., 2011), and persuasion-oriented innovativeness must consider the descriptive experiences that customers display in interaction sections with service employees (Igwe and Asiegbu, 2015).
When customers claim that dealers provide more excellent value in their offerings, they are pleased with their purchasing experience, which leads to their contentment (Kuo et al., 2009). Customers driven to seek out new products are more likely to share information about positive encounters with their social circles (Bin, 2013). Online reservations, digital check-in and check-out, connection with hotel employees through chat or cell phone in some cases, and disposable electronic keys instead of traditional keys are just a few of the technological solutions used by the hotels surveyed. They show how it is feasible to avoid crowds and give customers speedier service, allowing them to have a better experience without having to wait in line.
H1: Innovative practices adopted by Indian QSRs cause a significant impact on customer experience.
2.3. Innovative Practice (IP) and Customer Satisfaction (CS)
In today's corporate world, the notion of customer satisfaction is critical. Customer satisfaction is a crucial indicator in most businesses since it is a significant driver of enhancing customer loyalty and financial success (Ravishankar & Christopher, 2020). Innovation improves current products and services and increases consumer satisfaction (Ouedraogo and Koffi, 2018). According to Mustafa (2019), service improvements can attract new consumers while also helping to satisfy existing ones. When new products or services are offered to the market, innovation produces customer happiness, and the firm impacts consumers' perceptions of its capacity to meet their requirements (Luo & Battacharya, 2006).
Customer satisfaction is critical in ensuring the tourist industry's long-term viability. Customers nowadays want to discover and appreciate innovative offerings and their necessities. As a result, it is critical to figure out how visitors may get new services from airlines and hotels to please them and boost tourism.
Some researchers have noted that in the service industry, competitive advantage is based on exceptionally high-quality service, which leads to customer satisfaction and loyalty start (Yang, Lee, & Cheng, 2016; Kasiri, Cheng, Sambasivan, & Sidin, 2017), and that innovative service is critical for future competitive strength (Santos-Vijande, López Sánchez, & Rudd, 2016). Service operations might use service delivery to provide creative hints (Lusch and Nambisan 2015). The extreme environment is designed to leave customers with lasting memories and a one-of-a-kind comfort experience that affects customer pleasure physically and mentally (Shahi and Goswami 2018).
H2: Innovative practices adopted by Indian QSRs enhance satisfaction level among customers.
2.4. Innovative Practice (IP) and Customer Loyalty (CL)
Customer loyalty is a significant component in the success of hospitality firms (Kumari & Patyal, 2017). According to Subagio (2014), A loyal client makes repeated purchases from the same brand. As the restaurant industry is competitive, proprietors must focus on fresh and inventive concepts to attract new consumers and keep existing ones. Innovativeness service –mix as per specifications of consumer needs tend to increase the satisfaction of customer and loyalty as well. U and Eliwa (2014)
examined the structural coordination among innovativeness in services, products, behaviour in service providers on an increased level of satisfaction and customer loyalty within the perspective of fine-dining restaurants. Hotel industries are mounting their savings to get innovativeness in their everyday practices to enhance customer satisfaction and loyalty, thus ensuing better relations with each other (Jones et al., 2007). Once an organisation uses innovativeness, it influences its customers and increases the market share. Because the rationale of novelty is to transmit new things to attain a possible contest and enhance business and win customer satisfaction (Leonard-Barton, 1992). When hotels are offering new products, mainly satisfaction is realised, and clientele loyalty enhances in the way of offerings. Innovativeness focuses on its competence to enlarge customers' experience and improve satisfaction, which eventually escorts high returns (Rust and Kannan, 2003). In the modern era, innovation refers to product innovation in the hospitality sector (Gremyr et al., 2014). Another study by Daragahi (2017) found that product appearance innovation had a positive impact on the CS; hence when a business creates a new product, the satisfaction level of customers is accomplished, and so is the loyalty of customers (Naveed et al., 2012). Lee et al. (2017) segregated product innovation into radical and incremental innovation. Product innovation directs to the customer's satisfaction in every field because if a Quick Service Restaurant (QSR) provides the novelty in the product according to the needs and wants of the consumer, it tends to enlarge the level of CS and CL (Laužikas et al., 2016).
H3: Innovative practices significantly impact customer loyalty in Indian QSRs.
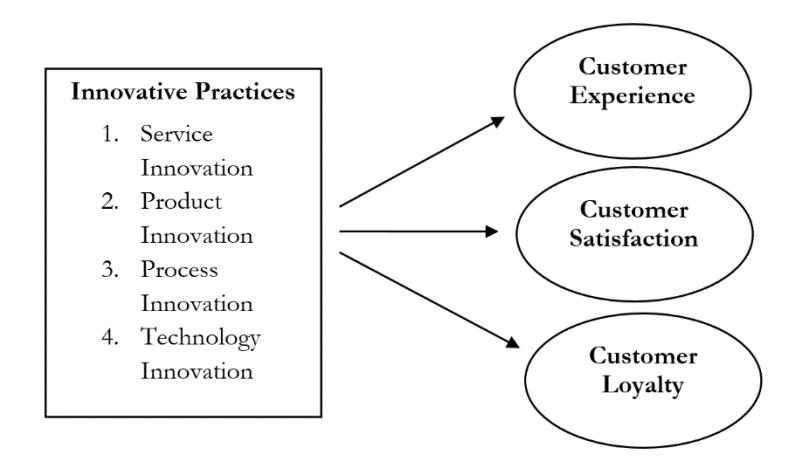
Figure 1. Conceptual Model of the Study
3. Methodological Approach
3.1. Instrument measurment
The study aims to establish the interrelationship of three constructs in innovative practices in QSRs. These constructs include – Customer experience, Customer satisfaction and Customer Loyalty—the questionnaire comprises five sections. The Section A of the questionnaire was concerned with the profile of the respondents. Section B has 26 items representing innovative practices. The section has been adopted from Wangila (2018). Section C comprises nine items representing customer satisfaction. The scale has been adopted from Rozekhi et al. (2016) study. Section D includes six variables of customer experience, which has been taken from the studies of Ali et al. (2014) and Rather (2018). Section E consists of five customer loyalty items derived from the study of Sanjeev
Kumar, 2018. All the variables are measured on a 5-point Likert scale ranging from "strongly disagree" (1) to "strongly agree" (5).
3.2. Sample size, sampling technique and data collection
The present study is descriptive and carried out in the Quick Service Restaurants (QSRs) in India. Non-probability sampling technique (i.e., convenience sampling) was utilised to choose respondents for the present research. A total of 574 personal and online surveys were conducted, out of which 490 were returned, indicating 85% of the response rate. The reason for distributing more questionnaires than the required sample size is made to ensure that a sufficient number of completed questionnaires is received (Boer, Delnoij and Rademakers, 2011; Isguven, Yoruk, and Cizmecioglu, 2015) after having cushioned the rejection of outliers (Gopalakrishnan, Muncherji, and Dhar, 2009). After verifying the accuracy of the data, missing values, normality, multicollinearity, and outliers, 462 responses were deemed appropriate for the evaluation.
The geographical area for the data collection was restricted to Northern Indian QSRs, i.e., Delhi, Chandigarh, and Jammu. The reason behind choosing the northern zones is that the Northern part of India is considered a hub of a diverse population where people from all backgrounds and localities come and exchange their ideas. It is not only an industrial hub but also an educational hub with people coming from all age groups, especially the youth, who meet and exchange their cultures and lifestyles. Moreover, the people of the northern part are considered more open to change and newer things. They adapt to westernised and diverse cultures in the form of cuisines etc., more readily than other parts of the country. Therefore, the QSRs from this part was chosen to have data that could help us have overall opinions of people PAN India.
3.3. Descriptive statistics
To uncover the average perception of the customers, means and standard deviations were computed. Table 2 illustrates that all the articles obtained an average score above the mid-scale point of 3. Respondents ranked the overall mean of the process innovation (M = 4.18) the highest. Subsequently, technology innovation (M = 3.98), service innovation (M = 3.93) and product innovation obtained the least score (M=3.79). Table 2 displays the mean values of all the measurements.
4. Data Analysis and Results
4.1. Demographic profile of respondent
Table 1 represents the detailed demographic summary of the respondents. The respondents included 60% males and 40% females of the total sample. The respondents were distributed into five age groups, as illustrated in Table 1. The age structure of respondents revealed that the majority of respondents (51%) were in the age group of 20-30 years. Furthermore, 44 % of the respondents had a postgraduate degree (41%). In addition to this, out of 462 respondents, the majority of the respondents (44 %) have been visiting all the QSRs.
4.2. Purification of scale-exploratory factor analysis
Exploratory Factor Analysis has been used to identify the factor with principal varimax rotation. Principal Component Analysis (PCA) has been run on each construct to frame the factors of each dimension, and the detailed description of which is given in Table 2. The process of EFA is performed on Innovation Practices. As per the result of EFA, the innovative items, which initially consisted of twenty-six statements, resulted in a nineteen-item scale and converged into four factors
viz. Service Innovation, Product Innovation, Process Innovation and Technological innovation. Thus, the final rotated component matrix containing nineteen items has loadings above 0.5. Factor loadings of Innovation items were between 0.513 and 0.817 and significant at the 0.05 level. The resultant four factors with higher Eigenvalues (>1), factor loading (>0.5), and about 62.4% of total variance explained by these factors indicated that the data was valid and therefore used for analysis/interpretation.
Table 1. Demographic Profile
| S. No. | Frequency | Percentage | |
|---|---|---|---|
| Gender | |||
| Male | 279 | 60% | |
| Female | 183 | 40% | |
| Age | |||
| Below 20 years | 46 | 10% | |
| 20-30 Years | 236 | 51% | |
| 30-40 Years | 142 | 30% | |
| 40-50 Years | 32 | 6% | |
| Above 50 | 6 | 3% | |
| Education | |||
| Matriculation | 15 | 3% | |
| Under-graduate | 70 | 15% | |
| Graduate | 168 | 36% | |
| Postgraduate | 188 | 41% | |
| Others | 21 | 5% | |
| Occupation | |||
| Student | 204 | 44% | |
| Self- Employed | 118 | 25% | |
| Govt- Employed | 68 | 15% | |
| Home Maker | 18 | 4% | |
| Private Employee | 54 | 12% | |
| Reason for | |||
| Eating out | Birthday Parties | 134 | 29% |
| Anniversary | 21 | 4% | |
| Marriage Parties | 72 | 16% | |
| Other Occasion | 235 | 51% | |
| Dine Out | |||
| Once a month | 136 | 29% | |
| Twice a month | 115 | 25% | |
| 3 times a month | 116 | 25% | |
| More than 3 times a month | 95 | 21% | |
| QSR | |||
| KFC | 28 | 6% | |
| Mc Donald's | 45 | 10% | |
| Dominos | 144 | 31% | |
| Pizza Hut | 32 | 7% | |
| Café Coffee Day | 11 | 2% | |
| All QSR | 202 | 44% | |
| Total | 462 | 100% |
Table 2. Results of EFA
| Factors | Items | Mean | Factor Loadings | Factor Mean | Alpha (α) |
|---|---|---|---|---|---|
| (F1) Service | The products offered at QSR are friendlier to the natural environment | 4.026 | .598 | 3.93 | .857 |
| Innovation | Using products by QSR saves a lot of time. | 3.614 | .626 | ||
| The QSR has effective customer satisfaction policy. | 3.741 | .628 | |||
| The QSR meets customer tastes and preferences | 3.951 | .597 | |||
| The QSR décor is always customized according to customer needs | 3.753 | .599 | |||
| QSR managers are always willing to adjust their supply according to the clients' needs' | 3.652 | .683 | |||
| I am always satisfied by the delivery method used by the QSR | 3.329 | .535 | |||
| (F2) Product Innovation | Products offered at QSR are frequently supplemented with new Flavors and ingredients for the customers. | 4.026 | .626 | 3.79 | .878 |
| Products offered at QSR differ from competing models in the market | 3.713 | .700 | |||
| QSR provides a wide array of unique products to choose from | 3.692 | .755 | |||
| Food and beverages frequently comprise new ingredients which are useful to the customers. | 3.785 | .608 | |||
| (F3) Process | QSR has availed multiple payment options which are faster and secure | 3.855 | .604 | 4.18 | .860 |
| Innovation | Communication between the client and the employees has improved due to installation of the innovative communication apps in QSR | 2.847 | .758 | ||
| The QSR website has all the necessary requirements to place an order. | 3.946 | .802 | |||
| The installed environmentally friendly devices have improved the level of QSR | 3.854 | .654 | |||
| Staff members understand your needs | 3.922 | .513 | |||
| (F4) Technology Innovation | Quick-service restaurant adopt digital technologies (online Ordering, Mobile delivery app, digital order Track, Mobile payments) to help improve operations and enhance customer service. | 3.773 | .817 | 3.98 | .877 |
| QSR launch Innovative drive-thru service for improving the time sequence | 3.941 | .599 | |||
| QSRs provide digital menu boards to update information and latest offers for customers. | 3.852 | .640 | |||
| Kaiser-Meyer-Olkin (KMO) = 0.910, Total Variance Explained (TVE) = 62.46% |
4.3. Scale validation-confirmatory factor analysis
The measurement models for the constructs (Service Innovation, Product Innovation, Process Innovation and Technical Innovation) have been tested, dropping several items with low standard regression weights (less than 0.5). Further, modification indices have also been used to improve model fitness.
Innovative Practices- A first order CFA is performed to assess the dimensionality of the innovative practices based on four factors and the indicators (Figure 2). The model predicted a good fit values with CMIN/DF= 3.116; RMR= .045; GFI= .905; AGFI= .877; CFI = .906 and RMSEA = .068.
Customer Satisfaction- CFA is performed on the "Customer Satisfaction" construct which consisted of nine items. All the manifest variables are loaded on their latent construct as the standard regression weight of all the items is above 0.5. The measurement model has yielded excellent results with CMIN/DF= 3.906; RMR= .025; GFI= .959; AGFI= .922; CFI = .966 and RMSEA = .079. The results revealed that goodness of model fit indices and SRW were within the prescribed criteria (Table 2).
Customer Experience- The model comes out to be a good fit as all the fit indices are within the prescribed limits i.e. CMIN/DF= .745; RMR= .009; GFI= .997; AGFI= .990; CFI = 1.000 and RMSEA = .000. All five items of the model indicate their predictive significance in explaining customer experience construct.
Customer loyalty- CFA on construct 'Customer Loyalty' is performed which comprised of five items i.e., CL1, CL2, CL3, CL4 and CL5. The measurement model has yielded excellent results CMIN/DF= 2.413; RMR= .015; GFI= .992; AGFI= .970; CFI = .994 and RMSEA = .055. The standard regression weights of all the items are above 0.5 (Table 5).
4.4. Reability and validity analysis
Table 3. Reliability and Validity Results
| Constructs | α | CR | AVE |
|---|---|---|---|
| SERVING | 0.857 | 0.875 | 0.502 |
| PROTEIN | 0.878 | 0.801 | 0.502 |
| PRICING | 0.860 | 0.841 | 0.514 |
| TEACHING | 0.877 | 0.764 | 0.520 |
Notes: SERVINN =Service Innovation, PRODINN =Product Innovation, PROCINN = Process Innovation, TECHINN =Technology Innovation, α=Cronbach's Alpha, CR=Construct Reliability and AVE = Average Variance Extracted.
Table 4. Discriminant Validity and Correlation Analysis of Latent Constructs
| Construct/(AVE) | SERVING | PRODINN | PROCINN | TECHINN |
|---|---|---|---|---|
| SERVING | 0.502 | |||
| PRODINN | .511 | 0.502 | ||
| .715** | ||||
| PROCINN | .097 | .060 | 0.514 | |
| 312** | 246** | |||
| TECHINN | .432 | .204 | .166 | 0.520 |
| .658** | .452** | .408** |
Note: Values on the diagonal axis represents Average variance extracted, squared correlation is given below the diagonal axis, and all the values within parentheses represent the correlation. *= p>0.05
Table 5. Results of CFA
| Constructs | Items codes | Standard Loadings | Square Multiple Correlations |
|---|---|---|---|
| Innovative Practices | SERVINN1 | .66 | .44 |
| SERVINN3 | .64 | .41 | |
| (1) Service Innovation | SERVINN4 | .76 | .57 |
| SERVINN5 | .74 | .54 | |
| SERVINN6 | .72 | .52 | |
| SERVINN7 | .69 | .47 | |
| SERVINNI8 | .74 | .54 | |
| (2) Product Innovation | PRODINN2 | .77 | .58 |
| PRODINN3 | .69 | .48 | |
| PRODINN4 | .68 | .46 | |
| PRODINN5 | .69 | .48 | |
| (3) Process Innovation | PROCINN1 | .72 | .52 |
| PROCINN2 | .77 | .58 | |
| PROCINN3 | .75 | .56 | |
| PROCINN4 | .67 | .45 | |
| PROCINN5 | .67 | .45 | |
| (4) Technology Innovation | TECHINN1 | .67 | .45 |
| TECHINN2 | .73 | .53 | |
| TECHINN3 | .76 | .57 | |
| Customer Experience | CE1 | .66 | .44 |
| CE2 | .73 | .54 | |
| CE3 | .81 | .66 | |
| CE4 | .70 | .49 | |
| CE5 | .70 | .49 | |
| Customer Satisfaction | CS1 | .68 | .46 |
| CS2 | .63 | .40 | |
| CS3 | .67 | .44 | |
| CS4 | .59 | .35 | |
| CS5 | .65 | .43 | |
| CS6 | .72 | .52 | |
| CS7 | .82 | .67 | |
| CS8 | .78 | .60 | |
| CS9 | .80 | .64 | |
| Customer Loyalty | CL1 | .72 | .52 |
| CL2 | .76 | .57 | |
| CL3 | .75 | .56 | |
| CL4 | .75 | .57 | |
| CL5 | .75 | .57 |
5. Hypothesis Testing-Structural Equation Modeling (SEM)
The proposed structural model was estimated by employing a measurement model using the maximum likelihood estimation with the help of Analysis of Moment Structures (AMOS) 16.0 statistical software. The final model of SEM was developed to test the hypotheses of the study and propose an innovative practices model for QSRs to enhance its CE, CS and CL. The model proves for reliability and validity; and provide support for all the hypotheses in the study as it indicated that IP has a significant positive impact on CE (β = 0.95, p <0.05), CS (β = 0.92, p <0.05) and CL (β = 0.87, p <0.05) in select QSRs from Northern India. (See figure 2).
Finally, the model has also been found to be excellent fit as it provided better goodness-of-fit indices (CMIN/DF= 2.374; RMR= .040; GFI= .859; AGFI= .838; CFI = .906 and RMSEA = .055). Major results and findings have been listed in Table 6.
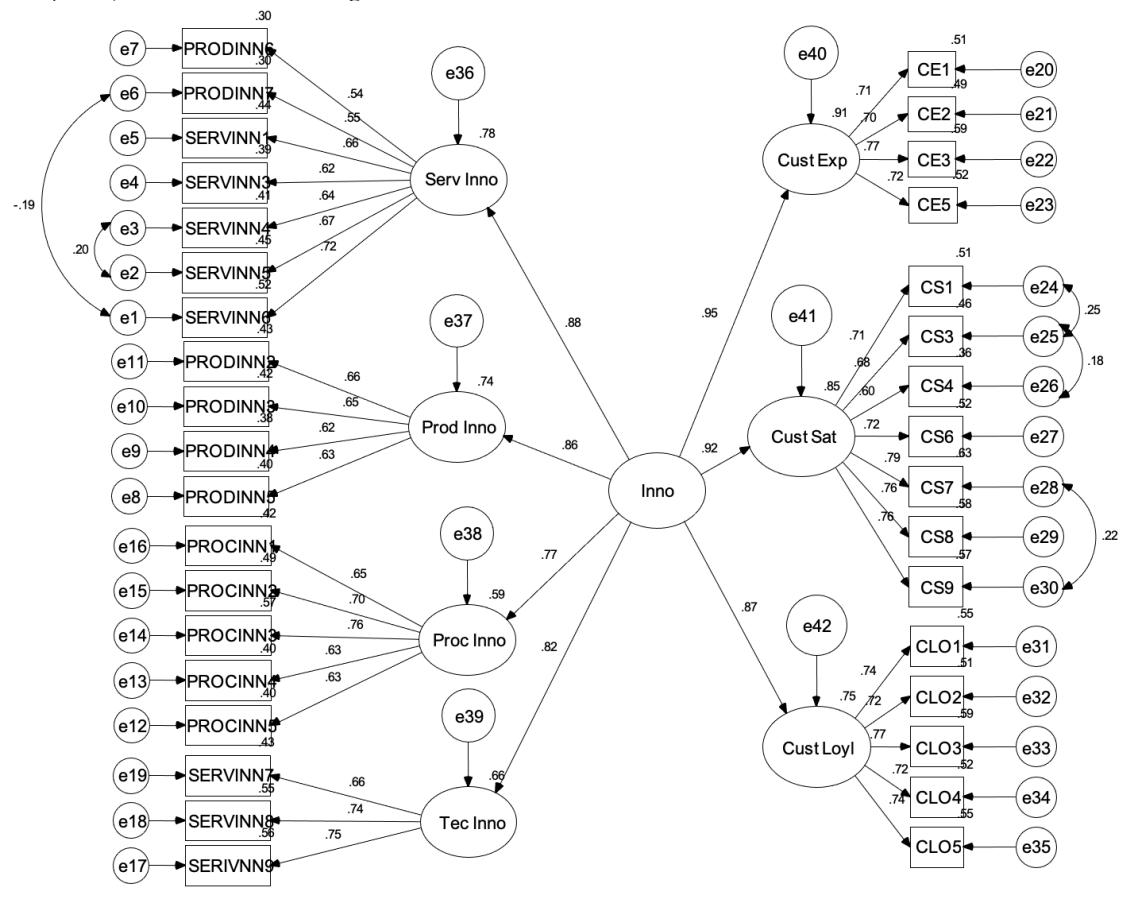
Figure 2. Structural Model
Table 6. Results of Hypothesis Testing through SEM
| Hypotheses | SRW | p-value | Accepted/Rejected | |||
|---|---|---|---|---|---|---|
| H1: Innovative practices adopted by Quick Service | 0.95 | <0.05 | Accepted | |||
| Restaurant (QSR) cause significant impact on customer experience. | ||||||
| H3: Innovative practices in QSR contribute to the satisfaction level of employees. | 0.92 | <0.05 | Accepted | |||
| H4: Innovative practices significantly impact customer loyalty. | 0.87 | <0.05 | Accepted | |||
| Result of Hypothesis Testing through ANOVA | ||||||
| Hypothesis | F-value ranges | Significance level | Accepted/Rejected | |||
| H2: Customers significantly differ with regard to innovative practices of (QSRs) | .645 | <0.05 | Insignificant/ Rejected | |||
6. Implications
6.1. Theoretical Implication
The critical point of this research is to examine the (a) the effect of innovative practices (IP) on customer experience (CE), (b) the Impact of innovative practices (IP) on Customer satisfaction (CS) (c) the Impact of Innovative practices (IP) on Customer Loyalty (CS). From the point of view of academic contributions, the present study includes the increasing research on the relationship between the consumer and the QSRs (e.g. Ottenbacher et al., 2019; Su, 2011; Ottenbacher and Harrington, 2009) by empirically addressing the relationships between innovative practices (IP), customer experience (CE), customer satisfaction (CS) and customer loyalty in select QSRs. The findings of this study have significant implications for the hospitality industry, as the implementation of innovative practices has a significant impact on Quick Service Restaurants. Firstly, this study discovered that Innovative Practices has a substantial and favorable influence on the customer's innovation experience. This study also adds to the existing literature by identifying customers who believe that innovative practices influence the customer experience at QSR businesses. These findings are consistent with the findings of Su (2011), Mihardjo et al. (2019), and Djellal and Gallouj (2001), all of which show that service innovation has a favorable impact on the customer experience. According to this study, IP is an essential predictor of customer innovation experience among QSR brands. The growing relevance of IP will contribute to creating meaningful and memorable experiences among QSR customers. Second, for QSRs, innovation is a critical activity and a fundamental concern for success and development; it has evolved from a critical option to a required management activity (Ottenbacher and Harrington, 2009).
Secondly, the impact of innovative practices on Customer Satisfaction, This study facilitates essential information for QSRs managers to determine the effectiveness of innovative service practices to improve customer satisfaction. In today's diverse corporate climate, service innovation is critical for service improvement and development and increasing customer happiness (Mahmoud et al., 2017). innovation leads to new products and services that meet the rapidly changing needs of consumers (Noorani, 2014). The link between innovation and customer satisfaction has up to date leading significance (Pappu and Quester, 2016) which can be explained based on Signaling Theory (Henard and Dacin, 2010). Furthermore, the QSRs' furnishings must constantly be customised to the demands of the customers. In order to deliver excellent innovative services that satisfy clients, QSRs must correctly provide and carefully plan their service innovation operations (Mahmoud et al., 2018).
6.2. Managerial Implication
The findings have significant Implications for quick service restaurant marketers. To generate a pleasant QSR experience, QSR service providers must give personalised services to specific consumers (Hussain et al., 2016) because customer experience is the primary precursor of satisfaction and then others (Hussain et al., 2016). (Choi et al., 2013). Although Customer satisfaction is one of the challenging goals that QSR marketers must meet. According to this study, customer satisfaction is determined by the customer's assessment of numerous service quality components provided by the QSR. According to an exploratory factor analysis result, customer happiness is determined by the customer's perceptions of the dining experience, accessibility to the QSR, product convenience and price, and product testing. QSR marketers must teach their employees how to communicate effectively. Music creates a positive atmosphere, and a clean seating arrangement ensures that customers are happy. When customers visit QSR, marketers should focus on providing a one-of-akind pleasurable experience. Product innovation is a factor that explains a customer's satisfaction with a product's variety, quality, and flavour. Customer satisfaction is achieved when customers positively think of these service factors. When a QSR introduces a new product or service based on consumer demand, it helps the company attract more customers and expand its client base through positive word of mouth and recommendations. As a result, QSR executives are advised to include innovation in their goods and services to improve consumer satisfaction and loyalty.
7. Limitation and Future Scope
Although this study provides interesting findings, the results need to be interpreted with caution. The present study is confined to the Quick Service Restaurants (QSRs) of Northern India, thus constraining its possibility in generalizing the outcomes. In the future, research might be conducted to test the current study methodology with bigger sample size. In the future, comparative research between different QSRs may be conducted. The research may also be undertaken to discover some other underlying innovation in QSRs that is still under-explored and has a lot to add to the success of QSRs. innovative practice in QSRs, which will aid QSR managers in focusing on those specific variables in order to improve customer experience, which will eventually lead to greater customer performance.