
1. Introduction
Tourism is an important industry for many developing economies as it creates jobs and generates income for the local economy. Before the pandemic, tourism contributes to 10.6% of employment and 10.4% of the global GDP (US$9.2 trillion) in 2019 (WTTC, 2020). However, the tourism industry is also vulnerable to shocks that could easily influence the patterns of international tourist flows. A wide range of shocks has influenced tourism, such as natural disasters, diseases outbreak, and terrorism, contributing to the volatility of tourism demand (Cró & Martins, 2017). A recent major shock is the impact of the COVID-19 pandemic that has dramatically reduced the number of international tourist arrivals worldwide. As of January-May 2021, international tourist arrivals dropped 85%, with a small uptick following the ease of restrictions and increased consumer confidence (UNWTO, 2021). The volatility of tourism demand threatens the sustainability of tourism. Therefore, the tourism industry needs to monitor, anticipate trends, and uses knowledge to make informed decisions and planning. The number of international tourist arrivals is forecasted to slowly recover from the pandemic, with the trends dominated largely by short-haul markets (Zhang et al., 2021).
The importance of shock events as significant factors influencing tourism demand has led to several studies in this area. The goal of shock-related studies is to determine whether shocks (e.g., financial crisis, terrorism, natural disasters, or pandemics) have long-term effects on tourism demand. The last two decades have attracted discussions in understanding shock effects on tourism demand, and these studies commonly use unit root tests to examine the stationarity of data series. An early work, Narayan (2005) investigated the long-term effects of military coups on tourist expenditure in Fiji. Smyth, Nielsen, and Mishra (2009) measured the effect of terrorist attacks in 2002 and 2005 on international tourist arrivals in Bali Island. Lean and Smyth (2009) examined the impacts of the financial crisis, avian flu, and terrorist threats in the number of tourist arrivals in Malaysia's top ten source market countries. Similarly, Tan and Tan (2014) investigated the effect of the global economic recession, 9/11, and SARS on tourist arrivals in Singapore. Perles-Ribes et al. (2016) investigated the correlation between business cycles and economic crisis effects on Spain's world tourism market share. Baig and Hussain (2020) investigated shocks on tourist flow in Gilgit, Pakistan. In a similar vein, Saglam and Ampountolas (2020) examined internal and external shock effects on tourist arrivals in Turkey. Shock-related studies conclude that although shocks have negative consequences on tourism demand growth, shock effects are temporary. Following this line of research, Yucel (2020) analyzed the impact of shocks for the top 20 visited countries. It is argued that tourism demand is likely to return to its equilibrium path, and tourism is considered sustainable in the long run. However, the effects of prolonged shocks, such as terrorist acts in the Middle East countries, are persistent (Liu & Pratt, 2017). Shock effects tend to be short-lived, and tourism can return to normal path. Nevertheless, prolonged shock events may cause long-term impacts on tourism demand.
There is also increased attention that examines shock effects on the cyclical patterns of tourism demand. However, most of the studies conducted are within economic frameworks. Narayan (2011) distinguished permanent (e.g., productivity) and transitory shocks (e.g., fiscal change). Further, the study examined the importance of these shocks in explaining tourist expenditure at business cycle horizons. In the same direction, several authors have also examined the relationship between economic activities and tourism demand cycles (Croes & Ridderstaat, 2017; Croes, Ridderstaat, & Rivera, 2018; Guizzardi & Mazzocchi, 2010; Smeral, 2012). Although economic variables (i.e., income) of source market countries influence tourism demand cycles, they are not the only predictors. Other factors could also play an important role, such as irregular acts of nature and human interactions (Croes et al., 2018). Focusing on economic factors undermines the possibility of the influence of non-economic variables that make accurate estimation, prediction, and conclusion (Kim & Wong, 2006).
This study examines the irregular and cyclical patterns of the international tourist arrivals as the reference in understanding the impacts of the shock events on tourism demand cycles. This study highlights not only the persistence but also the magnitude of the cyclical patterns. While the trend indicates the long-term horizon of tourism demand patterns, this study focuses on the cyclical behaviour of the data series that shows how the pattern could deviate from the trend within the shortrun horizon. The assumption is that shocks would cause reactions on the expansion (positive) and recession (negative) phases of tourism demand cycles.
Because of the interconnectedness of the tourism system with other elements outside its system, external forces, shaping behaviour and tourism demand can easily affect tourism. This study adds to the current literature by examining shocks beyond the economic framework, assuming different shocks could influence the tourism demand cycles. The impact of economic variables on tourism demand is also likely to be complicated by subjective factors. This study aims to analyse the impact of shocks on tourism demand cycles of major international tourists to Bali, Indonesia. The selection is based on the importance of tourism for the destination and the wide range of shocks that have impacted the tourism industry (Gurtner, 2016; Smyth et al., 2009). The responses of shocks in terms of magnitude and persistence of each origin market could be identified and evaluated, providing early signals of future demand for the destination.
2. Literature Review
2.1. Shock effects and tourism demand cycles
Shocks are exogenous factors that can influence the flows of tourism demand (Ridderstaat, Croes, & Nijkamp, 2013). Tourism is regarded as an open system that is connected to the elements outside its system. Tourism is susceptible to shock events such as economic fluctuations, natural disasters, pandemics, and terrorism. Shocks may occur at the destination, source market countries, or neighboring countries (Balli, Curry, & Balli, 2015). In addition, shocks typically occur unexpectedly and beyond the control of the tourism industry, which could have long-term impacts on tourism demand if not immediately managed. Shocks can take different types, and their effects can have different levels of persistence and amplitude on tourism demand cycles. Both individual motives and macro-level interventions play an important role in shaping the fluctuations of the cycles, which may not always be immediate and direct (Croes & Ridderstaat, 2017; Croes et al., 2018).
Tourist behaviors are sensitive to changes in external environments. Shocks can alter individual lifestyles and behavior as well as their travel motivations. The effects of terrorist attacks on 9/11 reduce tourist utility in deciding travel plans (Araña & León, 2008). These shocks increase the level of anxiety of tourists to travel or purchase tourism products. Economic shocks influence tourist behavior. During the economic recession, tourists might adjust their preferences and willingness to purchase luxury tourism products. They are likely to choose less expensive tourism products, visit destinations closer to home and reduce their spending. (Kubickova, Kirimhan, & Li, 2019). Ridderstaat (2021) stated that tourist behavior is subjective, and tourism demand is likely to be influenced by personal factors (e.g., moods and attitudes) rather than economic factors (e.g., financial wealth and income) alone. The availability of financial resources may not necessarily lead to consumption.
One theory that explains behavior change and decision-making is prospect theory. According to Tversky and Kahneman (1979), individual choices are guided by loss aversion principle. This principle suggests that perceived loss is far greater than perceived benefit in influencing decisions. Such evaluation guides an individual before making choices. Tourists are likely to avoid any possible loss associated with their decision, for instance, avoiding destinations that are considered unsafe (Sonmez & Graefe, 1998). Individual motives contribute to the fluctuations of tourism demand. Consumers adjust their behavior in response to the global economic recession (Smeral, 2012). It is also argued that the concept of loss aversion is multi-dimensional, which can further involve potential monetary or non-monetary losses (Bronner & de Hoog, 2017).
The tourism demand cycle refers to the deviation of tourist arrivals from their long-term trends, which may not be immediate or straightforward (Croes & Ridderstaat, 2017). The course of the tourism demand cycles comprises the expansion (positive) and recession (negative) phases, which can last months and even years. Shock events can influence cyclical patterns because tourism demand reacts sensitively to changes in the environmental surroundings. Shocks are not always negative as these can positively influence tourism demand (i.e., lowering the taxes, marketing campaigns, megaevents, etc.). However, shocks such as crises and disasters, need caution since these can significantly impact tourism demand (Coshall & Charlesworth, 2011).
The cyclical component of tourism demand represents a short-run behavior which can further be analyzed to examine its co-movement with its determinant variables. Several economic-related factors are influential in predicting tourism demand cycles. Ridderstaat and Croes (2017) argued that money supply in the source market countries could influence tourism demand cycles in tourist destinations. The study found that the impacts are asymmetrical, depending on the development stage. Furthermore, other determinants of tourism demand cycles, such as income (Croes et al., 2018) and household financial position of source market countries, also explain the variations in the tourism demand cycles (Ridderstaat, 2021).
Shock effects can vary between source market countries. Each market has different characteristics which socio, economic and environmental factors can shape. In addition, different national backgrounds are believed to shape behavior. Tourists from the United States, Hong Kong, and Australia have greater concerns and anxiety about international travel than travelers from the United Kingdom, Canada, and Greece (Reisinger & Mavondo, 2005). Furthermore, German tourists are more sensitive to news shocks than the British (Ertuna & Ilhan Ertuna, 2009). The behavior differences according to national cultures are associated with uncertainty avoidance levels, where individuals from countries with high uncertainty avoidance tend to avoid uncertain or ambiguous situations than those from low-risk uncertainty avoidance. Geographical distance also shapes tourist behavior, and closer destinations are perceived less risky and more attractive when crises and disasters occur (Ridderstaat & Nijkamp, 2016; Seabra et al., 2013).
The effects of the global economic recession on the growth of tourist arrivals in 2008 were diverse across different countries around the globe. For instance, tourist arrivals in South East Asia countries had a positive growth rate annually, while tourist arrivals in Europe plummeted (Chang et al., 2011). The study shows that the global economic recession has smaller impacts on less expensive destinations, such as those in developing countries. Furthermore, the interdependency between destinations cannot be ignored as the impact of shocks on one destination could spread to the neighboring destinations, either positively or negatively. Therefore, the detection of shocks can not only be limited to shocks that occur at the destination.
Based on the literature review, the discussion is limited to economic factors as determinants of tourism demand cycles have limitations. More importantly, socio-psychological characteristics also contribute to the process of decision-making. Therefore, the role of individual characteristics needs to be acknowledged. Different types of shocks exist in influencing tourism demand, not necessarily linked to economic variables.
2.2. The Bali Island
Tourism has always been a key industry for Bali, the number of tourist arrivals has grown from thousands to millions since the island was opened to mass tourism in the 1960s. Approximately more than 6.2 million tourists visited the island in 2019, which marked the highest annual tourist arrivals before the COVID-19 pandemic (BPS). Tourist arrivals on the island represented up to 40% of the total tourist arrivals of the country. The tourism industry contributed to 23% of the local GDP directly from accommodation and food beverage services and employed 13% of the total workforce in 2019 (BPS, 2020).
Bali island is known for its natural and cultural attractions. It has been described as 'the island of Gods' (Picard, 1995). It offers various marine-based tourism, such as surfing, diving, sea walking, watching sunrise and sunset, parasailing, and so forth. Besides beach activities, culture is also a major tourist attraction. The culture of the Balinese people is a manifestation of the Hindu religion which is reflected in architectural buildings, ritual ceremonies, handicrafts, and dance performances. This culture contributes to tourism capital and preservation for the local traditions that embrace devotion to God (Picard, 1995).
Despite its beautiful landscape and culture, the island is located in the Pacific Ring of Fire, which makes the island susceptible to the risks of natural disasters, including volcanic eruptions, tsunamis, and earthquakes. Such geographical features are attractive and contribute to the vulnerability of the tourism industry (Hall et al., 2019). Mount Agung erupted in 2018 and significantly impacted the local economy (Rahmawati, Trianasari, & Martin, 2018). Recently, the COVID-19 pandemic has put Bali in a deep crisis. However, the local tourism industry is hopeful that Bali will recover and return to mass tourism once the pandemic is over (Subadra & Hughes, 2021). Before the pandemic, Bali could restore the confidence of the international travelers to return to the island through the commitment of the stakeholders in supporting tourism on the island (Gurtner, 2016).
Although tourism is vital for Bali Island, research on tourism demand on Bali Island is limited. One study focuses on a particular shock, such as the impacts of terrorism (Bali bombings) on the longterm trend of tourist arrivals (Smyth et al., 2009). Discussions on the consequences of shocks on the tourism demand cycles to Bali are still underexplored. Because of the importance of tourism for the island, this study should contribute to the literature by examining tourist arrivals data to understand the shock effects on its major source market countries.
Mass tourism in Bali has been recorded since 1969, which an influx of international tourists has flocked the island. As shown (Figure 1), international tourist arrivals in Bali slowly grew positively during 1969-2000, with the first major shock of the Asian financial crisis hit in 1997-1998. During 2001-2019, international tourist arrivals showed substantial positive growth but with some years of declines due to several shock events, such as terrorist attacks, SARS, tsunami, and volcanic eruptions. Furthermore, the pandemic has caused a sharp decline in the number of tourist arrivals because of the closure of the tourism industry, which has started in April 2020 (Kompas, 2020). Consequently, such unexpected and sudden shock events trigger efforts to manage crises and disasters and direct such efforts to promote tourism recovery (Gurtner, 2016; Subadra & Hughes, 2021).
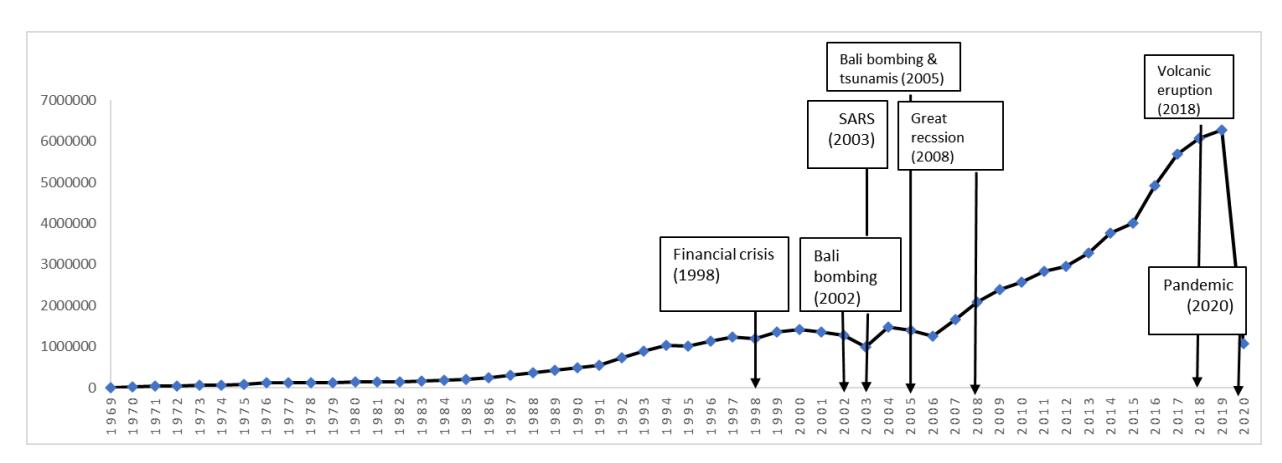
Figure 1. Visualiation of International tourist arrivals to Bali (1969-2020) Source: BPS (2021)
3. Data and Method
The data used in this study are monthly data, which consist of 217 data points, from January 2002 to January 2020, which are selected based on availability. Based on the time, there are eleven major Bali source market countries: Australia, China, India, UK, USA, Germany, Malaysia, France, Japan, Taiwan, and South Korea. These countries represent 70% of the total international tourist arrivals in Bali.
Time-series data consist of sub-components that can be decomposed into Trend (T), Cycle (C), Seasonal (S), and Irregular (I) components. The four components make up the whole time-series data in additive form T + C + S + I). The time-series data can be decomposed into an individual element for regression analysis using an unobserved component model (de Larrea, Ridderstaat, Kizildag, & Weinland, 2019). Each has different characteristics. The cycle (C) is non-periodic variations around the trend, and the irregular components (I) are unpredictable disturbances (e.g., natural disasters, political instability). These disturbances may not necessarily be independent and could influence the cycles (Bails & Peppers, 1993).
The first procedure is applied to isolate the cyclical component and irregular components. Once isolated, these sub-components are examined to study their relationship. The cyclical components represent tourism demand cycles, and irregular components of international tourist arrivals represent shocks. This study employs the two components, and the other elements (seasonality and trend) which are not the focus of this study, are eliminated. The Cycle (C) and Irregular (I) components of tourist arrivals data series are used as proxies for tourism demand cycles and shocks. Shocks, which are represented by the irregular components in the data series, could distort the cyclical movements (Dias & Dias, 2010). The first procedure applied in this study is the decomposition technique.
The UCM model is commonly used to decompose time-series data (Croes & Ridderstaat, 2017). The author conducts an unobserved component model (UCM) to decompose the elements of the data series. The C and I components are used as the basis for further analysis. The Cycle (C) and Irregular (I) components are standardized to obtain comparable and meaningful values (Croes et al., 2018). The unit root test is applied, in standardized values, to examine the data series properties and data stationarity. The assumption of stationarity must be satisfied to avoid a biased error and untrustworthy relationship (de Larrea et al., 2019).
Three commonly used unit root testing, Augmented Dickey-Fuller (ADF), Phillips Perron (PP), and Dickey-Fuller General Least Squares (DF-GLS), are conducted (Smyth et al., 2009). A step by step unit root test is conducted at the level and first difference form. The null hypothesis of the presence of the unit root in the data series is tested (H0=θ=0). Suppose the null hypothesis is rejected at level form, indicating the presence of a unit root. In that case, the process continues to test in its first difference form or second difference until the null hypothesis is rejected (Peng, Song, & Witt, 2012). An important factor in the estimation of the unit root testing is the specification of the lag length. The maximum lags are determined at 14 for the cycle and the irregular components, following the commonly used formula (Schwert, 1989).
One method that has been used to examine tourism demand cycles is logistic regression. The benefits of applying logistic regression are two folds. First, it can identify the variables that influence the cycles. Second, it can estimate the impacts of the explanatory variables on the probability of tourism demand cycles. This probability estimation provides a signal of the occurrence of the expansion (positive) or recession (negative) period of the cycles (Kulendran & Wong, 2011). Logistic regression is considered appropriate to measure the probability of positive negative tourism demand cycles, which can be used to estimate the short-term reactions of the source market countries to shocks and as the basis to predict tourism demand.
Prior to logistic regression, a stepwise regression is conducted to select the best select subset of candidates of the irregular components that could best predict the cycles (Kim & Gu, 2010). A combinatorial stepwise regression method is chosen because it is more thorough than other types of stepwise regressions. It combines every possible combination of regressors that could best predict the outcome (Agung, 2011). The test obtains a subset of irregular components within the lag lengths that best explain the variance in the cyclical component for each of the market source countries. The best model selection is determined by the lowest value of the Akaike Information Criterion (AIC), where the criterion is a mode that seeks the best model (Burnham & Anderson, 2004).
As the subsets of regressors are obtained, these are then calculated with logistic regression to estimate the probabilities of the combined irregular variables in influencing the expansion and recession phases of tourism demand for each specific market. A binary dependent variable represents the expansion and recession of the tourism demand cycles. The positive values or expansion phases are coded as one. The negative values or recession phases are coded as zero. J. Ridderstaat (2021) has applied a similar approach to predict tourism demand cycles. The formula for logistic regression can be described in the following equation:
TDC \[c_{,t} = \alpha_1 + \alpha_i XI t - k + \epsilon_t\] (1)
Where: TDC= Tourism Demand Cycles; c= country; t=time; α1= intercept; αi= ith coefficients; XI= Irregular component variables, k=possible lags, ε= white noise error term.
The coefficients are specified in log-odds units and indicate how many units the log of odds of tourism demand will change. The odds can be interpreted as the ratio of the probability that the dependent variable outcome is equal to one. The author conducts null hypothesis tests to see whether shock effects exist on tourism demand cycles., the following function is used to convert the odds ratio to probability:
Probability = \[\frac{\text{odds ratio}}{(1 + \text{odds ratio})}\] (2)
Conversion of the odds ratio into probability classifies the likelihood of the occurrence of the cycles from zero to one. The probability values closer to one indicates an increased probability of positive cycles, which indicate expansion, and probability values close to zero suggest an increased probability of negative cycles, which indicate recession.
4. Results and Discussions
This study focuses on analysing tourism demand cycles or the short-term horizon of tourist arrivals that have rarely been investigated. Previous studies have typically concentrated on economic frameworks. This study fills the research gap by examining shocks as aggregate and predicting the impacts of shocks on the short-run by observing the relationship between the cyclical and irregular components of international tourist arrivals to Bali. This study extends the current body of knowledge by employing unobserved component models, unit root tests, and logistic regression analysis. These approaches explain the persistence and consequences of shocks on the expansion and recession period of the cycle. The cyclical and irregular components of the data series are standardized before unit root testing is conducted. Based on the thee unit test results (ADF, PP, and DF-GLS), the data series of the cyclical components for all countries does not indicate the unit root, which suggests the data is stationary (see Table 1). The result from the three tests is quite similar. The time series of the cyclical components at the level and first difference form is below the critical values and statistically significant at 1%. Therefore, it is not necessary to do further data transformation. Integration is conducted at the level form. Because the cycles are stationary, shock effects are not permanent on the cyclical components for all the variables. The effects of shocks disappear along with the trend, and the cycles continue to repeat their movement.
Table 1. Unit Root Test of the Cyclical Components
| Country | ADF | PP | DFGLS | Integration | ||||
|---|---|---|---|---|---|---|---|---|
| SDVIS_AUS_C | Level | -13,5281 | *** | -21,1746 | *** | -13,5281 | *** | I(1) or I(0) |
| First difference | -10,7782 | *** | -83,0903 | *** | -10,4578 | *** | ||
| SDVIS_CHN_C | Level | -9,2451 | *** | -6,0939 | *** | -9,2645 | *** | I(1) or I(0) |
| First difference | -11,1104 | *** | -27,9790 | *** | -11,1373 | *** | ||
| SDVIS_FRA_C | Level | -11,6982 | *** | -5,2826 | *** | -11,5363 | *** | I(1) or I(0) |
| First difference | -12,0929 | *** | -5,8220 | *** | -11,5482 | *** | ||
| SDVIS_INDI_C | Level | -5,6214 | *** | -3,8192 | *** | -4,5025 | *** | I(1) or I(0) |
| First difference | -11,2641 | *** | -2,8972 | ** | -1,2442 | |||
| SDVIS_JAP_C | Level | -5,8648 | *** | -5,8590 | *** | -5,8803 | *** | I(1) or I(0) |
| First difference | -12,2355 | *** | -30,3556 | *** | -12,2010 | *** | ||
| SDVIS_MAL_C | Level | -10,8221 | *** | -8,8403 | *** | -14,6653 | *** | I(1) or I(0) |
| First difference | -8,3680 | *** | -10,0714 | *** | -9,5919 | *** | ||
| SDVIS_SOK_C | Level | -8,0405 | *** | -5,9099 | *** | -7,9266 | *** | I(1) or I(0) |
| First difference | -8,6492 | *** | -53,1072 | *** | -12,8216 | *** | ||
| SDVIS_US_C | Level | -8,1263 | *** | -4,1572 | *** | -7,9733 | *** | I(1) or I(0) |
| First difference | -8,6086 | *** | -17,2409 | *** | -11,2784 | *** | ||
| SDVIS_UK_C | Level | -12,2343 | *** | -4,0722 | *** | -11,5643 | *** | I(1) or I(0) |
| First difference | -12,8241 | *** | -2,6852 | * | -11,1955 | *** | ||
| SDVIS_GER_C | Level | -10,7249 | *** | -5,3649 | *** | -10,7630 | *** | I(1) or I(0) |
| First difference | -7,0272 | *** | -4,6902 | *** | -9,5311 | *** | ||
| SDVIS_TAI_C | Level | -8,4165 | *** | -8,1875 | *** | -8,3374 | *** | I(1) or I(0) |
| First Difference | -10,3279 | *** | -73,8701 | *** | -0,4523 |
Unit root testing for the irregular components is conducted as well (see Table 2). Based on the test, we also find that the data series is stationary at the level form and first difference form of the variables by ADF and PP test. Based on the ADF and PP unit root test, the time series of the irregular components are below the critical values and statistically significant at 1% for all countries. The test shows that unit root is not found in the data. Therefore, it is not necessary to do any data transformation for the irregular components. Integration for the irregular components are conducted at the level form. The effects of shocks can be present or absent on the international tourist arrivals cycles. When the effects are present, they can take a longer time to disappear (see Table 3). Shock effects differ according to different market source countries. Some countries are not affected by shocks. The probability of shock effects on tourism demand cycles is not statistically significant for Malaysia, UK, France, Taiwan, and Japan. Wald and Likelihood Ratio estimates and the associated pvalue <.05 show that shock effects are absent in the tourism demand cycles. It can be interpreted that these markets tend to be neutral from the shock effects.
Table 2. Unit Root Test of Irregular Components
| Country | ADF | PP | DFGLS | Integration | ||||
|---|---|---|---|---|---|---|---|---|
| SDVIS_AUS_I | Level First | -13,4091 | *** | -13,4091 | *** | -13,3128 | *** | I(1) or I(0) |
| difference | -10,2442 | *** | -64,1444 | *** | -15,1766 | *** | ||
| SDVIS_CHN_I | Level First | -12,1426 | *** | -12,0425 | *** | -11,9931 | *** | I(1) or I(0) |
| difference | -10,6632 | *** | -46,6061 | *** | -11,5359 | *** | ||
| SDVIS_FRA_I | Level First | -11,2902 | *** | -13,0587 | *** | -12,9611 | *** | I(1) or I(0) |
| difference | -8,1404 | *** | -125,2815 | *** | -0,4403 | |||
| SDVIS_INDI_I | Level First | -1,6241 | *** | -11,7061 | *** | -1,5501 | I(1) or I(0) | |
| difference | -9,6314 | *** | -42,8602 | *** | -1,2636 | |||
| SDVIS_JAP_I | Level First | -12,7464 | *** | -12,7476 | *** | -12,7636 | *** | I(1) or I(0) |
| difference | -9,5021 | *** | -127,1353 | *** | -0,6437 | |||
| SDVIS_MAL_I | Level First | -14,2207 | *** | -14,2177 | *** | -12,7402 | *** | I(1) or I(0) |
| difference | -10,4975 | *** | -140,8007 | *** | -0,8403 | |||
| SDVIS_SOK_I | Level First | -14,0723 | *** | -14,0694 | *** | -2,2628 | ** | I(1) or I(0) |
| difference | -10,1510 | *** | -98,9295 | *** | ||||
| SDVIS_US_I | Level First | -14,0111 | *** | -14,0115 | *** | -2,0293 | ** | I(1) or I(0) |
| difference | -9,2691 | *** | -89,6494 | *** | -15,3695 | *** | ||
| SDVIS_UK_I | Level First | -13,2941 | *** | -13,6795 | *** | -0,6577 | I(1) or I(0) | |
| difference | -11,5840 | *** | -56,5067 | *** | -0,1549 | |||
| SDVIS_GER_I | Level First | -11,3376 | *** | -23,5283 | *** | -1,2295 | I(1) or I(0) | |
| difference | -8,7682 | *** | -63,9923 | *** | -0,5752 | |||
| SDVIS_TAI_I | Level First | -14,5225 | *** | -14,7337 | *** | -0,8166 | I(1) or I(0) | |
| difference | -11,3957 | *** | -128,4471 | *** | 0,0994 |
Note: Significance level at 10% (*), 5% (**), and 1% (***)
Shock effects on the tourism demand cycle are statistically significant for China, Australia, India, United States, South Korea, and Germany (p <.05). In this case, the null hypothesis is rejected. Shock effects are present and statistically significant in influencing the tourism demand cycles for these countries. There are moderately affected countries, and there are those strongly affected by shocks in terms of the duration. Countries such as Australia, China, and South Korea are moderately affected compared to Germany, the USA, and India. South Korea and Australia have the shortest lag lengths (Lag = 2), China has longer time lags (Lag = 6), and the longest time lags are found in India, the United States, and Germany (Lag > 10). Shock effects on tourists from China, Australia, and South Korea swiftly disappear, which means that the effects are not persistent, although shocks also influence them. Similarly, it extends the assumption of the importance of Asia Pacific markets for
Bali (Carlsen & Hughes, 2008). Following the Bali bombing in 2003, optimal growth was mainly from Asia Pacific markets (Japan, Australia, Taiwan, and South Korea).
The irregular components predict the magnitude of the cyclical components. Shocks influence the degree of the positive and negative cyclical components. The magnitude of shocks differs according to different market source countries based on the observed data. Shock effects influence the negative cycles for China, India, the USA, and Germany. For China, the probability of shock effects on the cycles ranges between 23-30% on the positive cycles. Accordingly, shock effects influence the negative cycles more, between 70-77%. For other countries, shocks affect the negative cycles at 48- 75% for Indian, 3-72% for the USA, and 21 to 84% for the German market. The cyclical behavior indicates that China, India, the USA, and Germany might be in a recession phase when shocks occur. The results are different for Australia and South Korea. Their irregular components influence the positive cycles by nearly 70%, indicating that shocks are less likely to cause a recession in the tourism demand cycles or only 30%.
This study provides empirical evidence on the effect of shocks on the tourism cycles or for Bali. Shock effects are not permanent as indicated by data stationarity or unit root test of the cyclical components. In this case, shock effects on tourism demand cycles are temporary in the short term for all the source market countries of Bali, similar to previous findings (Smyth et al., 2009). This means that the tourism industry can recover from shock events. This study also reveals that the impact of shocks is different to different segments by looking at each market being investigated. Not all market source countries share the same amplitude or duration. This study further reveals the three groups of market segments according to their cyclical behavior. There are groups of segments that are not affected, moderately affected, and strongly affected by shocks. These groups have different cyclical characteristics in terms of amplitude and duration, allowing identifying important market segments according to the interaction between the irregular and cyclical patterns. The patterns indicate that different market segments have different sensitivity to shocks, implying different marketing treatments for different markets.
Personal influences can explain differences in the patterns of tourist arrivals. Reisinger and Mavondo (2006) claim that said tourists from the United States and Australia have more concerns and are anxious to travel internationally than tourists from the United Kingdom. German tourists are more sensitive toward news shocks compared to tourists from the UK. Tourist behaviors can differ according to nationalities (Ertuna & Ilhan Ertuna, 2009). The cultural background of the market is also influential to responses to shocks. In addition, the availability of substitutes for tourist destinations might also be a factor that is considered when choosing a destination under crises and disasters (Ridderstaat & Nijkamp, 2016). Geographical factor matters in the consequences of shocks where shorter distance destination is an advantage to attract tourists to return to the destination (Perles-Ribes et al., 2016). In this study, we find that distance may not be the only factor determining visitation for the island. Countries like France and the UK exhibit strong performance in the tourism demand cycle, showing that the possibility for long-distance markets is not affected by shocks. The latter is in contrast to the assumption that distance is a factor that shapes tourism demand (Ridderstaat & Nijkamp, 2016; Seabra et al., 2013). The relationship between shock effects and geographical distance of the source market countries is not straightforward. These findings are significant because they provide insights into the fact that Bali is frequently affected by external shock events along its journey as a tourist destination. These multiple shocks could affect its demand, which can influence the sustainability of the tourism industry. The results also provide a framework for analysing the source market behaviour and methodology to predict the impacts of shocks on the expansion and recession phases of the cyclical patterns in the short-term horizon. There is no standardized requirement on how the main content is organized. However, we expect the author to divide it into several sections indicating literature review and analytical results and discussions.
Table 3. Logistic Regression Tourism Demand Cycles
| Country | Lags | Odds Ratio | Probability | Wald X2 | Likelihood ratio | Pseudo R2 | Peason X2 | |
|---|---|---|---|---|---|---|---|---|
| France | L2 | 1,3131 | 0,5677 | 2.17 (.5387) | 2.116 (.539) | 0,014 | 172.63(.4722) | |
| L13 | 0,9444 | 0,4857 | ||||||
| L14 | 1,2590 | 0,5573 | ||||||
| Japan | L9 | 1,3063 | 0,5664 | 4.01(.4044) | 4.012(.404) | .025 | 174.32(.4363) | |
| L10 | 1,0075 | 0,5019 | ||||||
| L11 | 1,0509 | 0,5124 | ||||||
| L13 | 1,4344 | 0,5892 | ||||||
| L9 | 1,3063 | 0,5664 | ||||||
| Taiwan | L7 | 0,9320 | 0,4824 | 3.29(.3493) | 3.28(.349) | .0188 | 184.10(.3417) | |
| L9 | 0,7723 | 0,4358 | ||||||
| L10 | 0,7962 | 0,4433 | ||||||
| Malaysia | L13 | 1,2428 | 0,5541 | 1.00 (.3166) | 1.003 (.317) | .0066 | 181.07(.3808) | |
| UK | L6 | 0,7097 | 0,4151 | 6.21(.286) | 6.20 (.287) | .048 | 174.89(.4242) | |
| L7 | 0,8928 | 0,4717 | ||||||
| L8 | 0,6444 | * | 0,3919 | |||||
| L11 | 0,8954 | 0,4724 | ||||||
| L12 | 1,1652 | 0,5382 | ||||||
| China | L5 | 0,4409 | ** | 0,3060 | 17,14(.0088) | 17,143(.009) | .3271 | 127,58(.9936) |
| L6 | 0,3105 | *** | 0,2370 | |||||
| L7 | 0,5776 | 0,3661 | ||||||
| L8 | 0,6357 | 0,3887 | ||||||
| L9 | 1,1794 | 0,5412 | ||||||
| L13 | 0,7435 | 0,4265 | ||||||
| Australia | L1 | 1,7446 | ** | 0,6356 | 14.46(.0023) | 14.46(.002) | .1003 | 173.64(.4720) |
| L2 | 2,1238 | *** | 0,6799 | |||||
| L13 | 1,2611 | 0,5577 | ||||||
| South | ||||||||
| Korea | L2 | 2,3065 | *** | 0,6976 | 14.54(.0012) | 14.53(.0013) | .1164 | 176.89(.3628) |
| L6 | 0,8927 | 0,4717 | ||||||
| L7 | 0,8176 | 0,4498 | ||||||
| L13 | 1,1969 | 0,5448 | ||||||
| L14 | 1,3941 | 0,5823 | ||||||
| India | L3 | 0,9887 | 0,4972 | 39.19 (.000) | 39.18 (.000) | .3996 | 140.01(.9601) | |
| L4 | 0,9887 | ** | 0,4972 | |||||
| L5 | 0,3566 | *** | 0,2629 | |||||
| L7 | 0,3458 | *** | 0,2570 | |||||
| L12 | 1,0505 | 0,5123 | ||||||
| L13 | 0,5209 | * | 0,3425 | |||||
| USA | L1 | 2,0044 | * | 0,6672 | 36.36(.000) | 36.36 (.000) | .282 | 153.93(.7574) |
| L2 | 2,4647 | * | 0,7114 | |||||
| L3 | 40,2923 | * | 0,9758 | |||||
| L4 | 7,8848 | 0,8874 | ||||||
| L9 | 0,4032 | *** | 0,2874 | |||||
| L10 | 0,5380 | ** | 0,3498 | |||||
| L11 | 5,4245 | * | 0,8443 | |||||
| L12 | 9,3393 | 0,9033 | ||||||
| L13 | 34,646 | * | 0,9719 | |||||
| Germany | L1 | 1,3401 | 0,5727 | 14.54(.0012) | 14.53(.0013) | .1164 | 184.18(.186) | |
| L2 | 2,0303 | * | 0,6700 | |||||
| L3 | 2,2164 | ** | 0,6891 | |||||
| L4 | 3,8721 | *** | 0,7947 | |||||
| L6 | 1,1904 | 0,5435 | ||||||
| ** | ||||||||
| L7 | 0,3126 | ** | 0,2382 | |||||
| L8 | 0,4225 | * | 0,2970 | |||||
| L9 | 0,2016 | *** | 0,1678 | |||||
| L10 | 0,4178 | ** | 0,2947 | |||||
| L11 | 0,5256 | ** | 0,3445 |
Note: Significance level at 10% (*), 5% (**), and 1% (***)
5. Conclusions
This study provides an alternative approach in investigating the relationship between the tourism demand cycle and shocks through data series decomposition, unit root test, and logistic regression. Time series analysis provides an overview of the market behaviour in response to the various shocks, not only to the persistence but also to the magnitude of tourism demand cycles. This exercise is useful to understand the extent of shocks affecting the cyclical components of different market segments. The approach used in this study can be applied to assess other destinations. It is important to look into how the persistence and magnitude of the impacts are different to the markets.
While shock effects are temporary on the tourism demand cycles, the findings should alert authorities—the effects of shocks that can be persistent in several source countries. The local authorities must take a proactive role in preparing for crises and disasters and adopting intensive marketing campaigns to promote the island as a safe destination. Otherwise, the impacts of shocks will be persistent. Understanding different responses performed by different market segments provide input to authorities to extend their marketing to important market segments. This study suggests a more intensive campaign to tourists from India, Germany, and the USA when shock effects in these markets appear to have more adverse impacts than those in other countries.
Despite the empirical evidence provided, this study has several limitations. First, shocks are calculated in aggregate values as represented by the irregular components. It does not identify specific shocks or differentiate shock effects in determining the tourism demand cycles. According to their magnitude and persistence, specifically distinguishing the types of shocks would benefit from analyzing how different shocks could affect tourism demand cycles. Second, this study is based on a small sample size with limited data points. Large data series would capture more data periodicity, which can be useful for a more comprehensive interpretation. Analyzing another variable of tourism demand, such as tourist expenditures or length of stay, can capture additional information. Moreover, the analysis is restricted to a destination. Future research could consider other tourism markets and destinations with more data for higher periodicity. Finally, the latest COVID-19 pandemic has reduced the number of tourist arrivals significantly. The results of this study could give an insight into the tourism practitioners about the probability of demand shocks in the tourism sector during the pre-pandemic period. Moreover, future studies could compare the length and magnitude of shocks before and after the pandemic, contributing to the literature.