
1. Introduction
The tourism industry has contributed to the development of the world, having a number of tourists also contributed to economic sectors. It has been announced "Pakistan is 2020's top holiday destination" by Conde Nast Traveller magazine (Conde Nast Traveller, 2020). It is a place where greeneries are snubbed by large and gigantic peaks and exquisite landscapes. In fact, Pakistan has mountains that are taller than 22965 feet combining China and Nepal, making it an attractive and exact spot for courageous hikers and travelers who love adventures (Conde Nast Traveller, 2020).
Travel and tourism industry has been growing and one of the largest industry with global economic contribution: $7.6 trillion in 2016. The direct impact of tourism on different industries: transportation, accommodation, attractions, and entertainment approximately $2.3 trillion. Gross domestic product (GDP) total contribution of travel and tourism is $8272.3 billion in 2017 that is 10.4% of GDP, and it is estimated to rise by $4 by 2018, and it will rise by 3.8% per annum to $12450.1 billion in 2028 (WTTC, 2018).
The growing trends in tourism have an impact on Pakistan's tourism industry. Decades before Pakistan was among those countries where less than a million international tourists visited annually. In 2017, record-breaking statistics of 1.75 million tourists visited the country due to improving law and order situation (The News, 2018). According to Pakistan Tourism Development Corporation (PTDC) domestic travellers increased 30 per cent, Jovago the top hotel that claimed to book increased by 80-90 per cent in 2017 (Pakistan Today, 2017).
Pakistan travel tourism industry enhanced and it also contributed to the GDP of Pakistan. In GDP contribution of tourism was Rupees 2349 billion that is 7.4% of GDP, and it is estimated to rise by 5.8% in 2018, and it will increase by 5.4% per annum 4200 rupees billion (USD39851.6mn), that is 7.4% of GDP in 2028 (Pakistan, 2018). These figures show tourists have the enthusiasm to go on different destination of Pakistan.
Pakistan possessed specular natural beauty, one of the diversified culture nation that makes country distinct. There are few countries that blessed with all seasons Pakistan is one of them. It has humongous mountains with the highest peaks covered with a snow cap, flowing rivers, and beautiful lakes make Pakistan's portfolio more impressive. More than hundreds of peaks are above 7000 meters, out of 14 highest peaks Pakistan possessed 5 highest peaks situated mainly in Karakoram range (The Nation, 2015).
As per statistical data of 2017 there is an increase in growth of 1.75 million tourists as compared to 0.5 million tourists who traveled during the previous year (The News, 2018). Government enjoyed the revenue of Rs 300 millions from the tourism in these two years. And the provisional government is expecting 2.5 million of the visitor (national and international) in 2018. If we go for the comparative analysis of the given indexes, without any second thought we can say that mountainous are part of Pakistan plays a vital role in attracting tourists from outside and within Pakistan (Voice of Vienna, 2018).
With the growth of Internet surfing, people along with the searching of other information also search to decide their travel destination. Social media connects individuals that didn't possible before sitting at one corner of the world can communicate the personal who sitting the other corner of the world. Facebook, WhatsApp, Instagram and many more provide an opportunity to share their views, can comments on posts. Liking on the page, comments on other create electronic word of mouth (E-WOM), is a tool of communication which allow individuals to share their experiences, and opinions via emails, reviews on the blog, and comments on social media (Ishida, Slevitch, & Siamionava, 2016).
Tourists select a specific destination on the basis of E-WOM, and individuals rely on E-WOM because response came from anonymity individuals. Individuals rely on online reviews and on that basis they took the decision of buying products/service.
There are factors considered by individuals while choosing any destination such as the price of accommodation, travel distance, destination image, and situational factors (Masiero L & Qiu R.T, 2018). Having a better image of destination influences on intention to return, and overall satisfaction, and it is creating a positive impact on destination loyalty (De Nisco, Mainolfi, Marino, & Napolitano, 2015). Destination image is directly linked with perceived satisfaction, quality, intention to return at the place, which creates trust, and positive word of mouth (De Nisco, Mainolfi, Marino, & Napolitano, 2015).
There are other variables that influence while choosing destination: destination trust, destination image, and destination familiarity. Destination trust creates when individuals get safety, security, better infrastructure, greeting from other individuals. Strengthening between the tourist and tourist destination involves tourists' past experiences through personal contacts with product and services related to the destination. Better experience based on quality, better infrastructure, greetings in past individuals get from others that ultimately lead to trust. Individuals recommend those destinations to others it is because the trust that perceived as signal from the destination. Destination familiarity is how much individuals aware of place/destination, how many time visit place/destination. Familiarity with destination does impact on consumers' destination image formation and tourists enhance interest to visit there (Yang, Yuan, & Hu, 2009). Having positive familiarity with destination create a favorable reputation of destination that stimulate to visit the same destination (Artigas, Vilches-Montero, & Yrigoyen, 2015).
Above are the main constructs that are investigated by the present research. Online reviews play a dual role it provides information regarding products, services and it serve as recommendations. Having better image, trust and familiarity tourists stimulate to visit. The quality of services enhances the overall satisfaction that creates trust in choosing the destination and chances to revisit again (Masiero & Qiu, 2018). These two roles are important, tourists search for information and recommendations while choosing any destination and online reviews can satisfy tourists' needs (Jalilvand M.R., & Samiei, N. 2012). Destination choice is an important part of the travel and tourism industry (Masiero & Qiu, 2018). Based on the previous discussion following the present research identifies the following broad problem statement.
2. Literature Review
2.1. Electronic Word of Mouth (E-WOM)
Word of mouth (WOM) is an oral, face to face, person to person communication between the sender and a receiver, it involves, service, product, or brand. The word of mouth is not a commercial activity so receiver believes in it and feel more credible, WOM has more influence than a commercial advertisement (Wu & Wang, 2011). E-WoM, an online context which can easily reach the large audience in a short span of time (Abubakar & Ilkan, 2016). E-WOM is a mode of communication that individuals post positive or negative comments on services/products that they did get experience in past (Abubakar & Ilkan, 2016). E-WoM is more reliable because response comes from anonymous nature and without incentives. Marketers can seize this opportunity and improve services quality, and innovate future services characteristics and create trust in the minds of tourist that ultimate increase purchase intent (Abubakar & Ilkan, 2016).
E-WOM has received a lot of attention in recent years, many numbers of reasons such as tourists' choice of destination, influence on marketing strategy, influence on decision making, and influence on purchase intents (Abubakar & Ilkan, 2016), and it reduced travellers' perception of risk and improving booking recommendation. The most widely used social networks Facebook and Twitter resulted that people take the review and E-WOM (whether it is positive or negative) more serious when it forms the reliable and authentic source (Sotiriadis & Van Zyl, 2013). The below hypothesis focused on specific E-WoM and destination trust that drew on the basis of literature.
On the basis of literature above discussion the following hypothesis is made:
H1: EOWOM positively influences destination trust.
2.2. Destination image
Destination Image consists of many elements range: functional to psychological. Destination image consisted of subjective interpretation of tourists' beliefs and feelings regarding a specific destination (De Nisco, Mainolfi, Marino, & Napolitano, 2015). The research found the destination image is a direct antecedent of perceived satisfaction, quality, intention to return at the place, that creates trust, and positive word of mouth (De Nisco, Mainolfi, Marino, & Napolitano, 2015). Image of destination influences on intention to return, and overall satisfaction, in turn, it is creating a positive impact on destination loyalty (De Nisco, Mainolfi, Marino, & Napolitano, 2015). Satisfaction and loyalty are the antecedents of consumer's trust that is used in tourism. As a result, a positive destination image increases the propensity and enhances intentions to return and the recommended destination.
On the basis of literature following the hypothesis has made:
H2: Destination image positively influences destination trust.
2.3. Destination familiarity
Destination familiarity explained the visual or mental impression of tourist experience or destination that stimulates intention to visit those places. It referred to as mental impressions that encourage tourists to visit those places (Horng, Liu, Chou, & Tsai, 2012). Having knowledge of the destination leads to a level of affection toward the destination. Tourists express their affection and familiarity to shape the tourism destination image and motivate potential tourists to visit the destination. Therefore, destination familiarity plays an important role in decision-making (Yang, Yuan, & Hu, 2009).
After visiting the destination tourists evaluate in the cognitive and affective form of destination that increases the perception of familiarity. Perception of tourist destination is composed of different elements that include landscape of the place, built of environment, and its attractions. Tourist's favourable perception directly and positively effect on familiarity (Artigas, Vilches-Montero, & Yrigoyen, 2015).
Familiarity with destination does impact on consumers' destination image formation and tourists enhance interest to visit there, familiarity needs awareness that consumers have the idea of what the destination is (Yang, Yuan, & Hu, 2009). Having a positive reputation, and perception enhance destination familiarity and create trust in destination to visit. The previous study has found a gap that proposed model didn't incorporate familiarity as a tourism destination. The result may differ between that tourist who have already visited destination one or more times in past and first-time visitors (De Nisco, Mainolfi, Marino, & Napolitano, 2015).
On the basis of literature, the following hypothesis made:
H3: Destination familiarity positively influences destination trust.
2.4. Destination trust
Most of the literature on trust has focused on specific sectors: airline, tourism suppliers, restaurant, and hotels (Artigas, Yrigoyen, Moraga, & Villalón, 2017). Few studies focused on tourist destination as tourist's trust. Trust has defined the relationship between two parties when one party perceived the integrity and reliability with its exchange partner (Artigas, Yrigoyen, Moraga, & Villalón, 2017). Strengthening and creation between the tourist and tourist destination involve tourists' past experiences through personal contacts with product and services related to the destination. Personal contacts with inhabitants of destination are important – inhabitants welcome as are the private and public institutions that should be competent, honest, and benevolent (Artigas, Yrigoyen, Moraga, & Villalón, 2017).
Reputation influences the process of choosing a destination and reducing the risk of an individual's insecurity. It can define as consistency between what companies promise and fulfilment of guarantee. Reputation is not only consistent with the place but it consistent with history too, it is all about how the place reputed in past and how to maintain it. From the perspective of hospitality and tourism, enjoying good reputation can mean tourist stays longer and increased visits (Artigas, Yrigoyen, Moraga, & Villalón, 2017). The current study defined there are another antecedent that influences destination trust such as prior experience, this study will incorporate the prior experience of tourists who went on some destinations and experiences.
On the above discussion the following hypothesis is made:
H4: Destination trust mediates the relationship between E-WOM, destination Image, and destination familiarity and destination choices.
2.5. Destination choice
There are various attributes effecting the destination choices of tourists in different categories such as resources of tourism, the fare of facility, and service quality, these are known as the regular attribute of destinations, and its accessibility: travel distance, available travel mode, and travel fare. Situational factors: political circumstances, weather conditions these are the attributes that related to the actual trip. Although many other attributes that significantly influence on destination choices known as segmentation of tourists is important in the process of choosing a destination (Masiero & Qiu, 2018). On the basis of demographic, geographic, psychographic, behavioristic, and socioeconomic characteristics doing segmentation, which can be used independently or in combination (Masiero & Qiu, 2018). In tourism all segmentation is important but frequently used in tourism model is demographic, specific found age factor characteristic found closely related to individuals in tourist activities (Masiero & Qiu, 2018). In demographic: age, personality, and gender are specific factors that effecting while choosing a destination. In choosing destination consumers focused on pervious experiences, quality, the satisfaction that has been offered by companies (Masiero & Qiu, 2018).
The quality of services enhances the overall satisfaction that creates trust in choosing the destination and chances to revisit again (Masiero & Qiu, 2018). There are major seasonal differences, such as climate, weather conditions, social, and political circumstances, they considered as influence on selection of destination (Masiero & Qiu, 2018). These are external factors if they are positive it creates trust in the destination and intention to revisit. It has been observed having positive familiarity with destination create a favorable reputation of destination that stimulate to visit the same destination (Artigas, Yrigoyen, Moraga, & Villalón, 2017). Current study filling the gap by adding how prior experiences create destination trust, and influence on destination choice.
On the basis of literature following hypothesis has made:
H5: Destination trust positively influence on destination choice.
2.6. Conceptual framework
In the conceptual framework, there are five variables: E-WOM, Destination image, Destination familiarity, destination trust, and destination choices. With the help of electronic word of mouth individual exchange their views and knowledge about different destinations. Tourists want to visit somewhere they knowing about the destination, its beauty, image, where it is located. Getting positive reviews create trust on destination. As destination image is belief, perception regarding specific product, service, or place. Having familiarity with a destination it is easy to make a decision whether to visit or not. These are independent variables that create trust on destination having positive E-WOM, destination image, and familiarity with destination create trust on the destination that leads to choosing a destination. Table 12 presents delineation of past research studies and contribution of the present research.
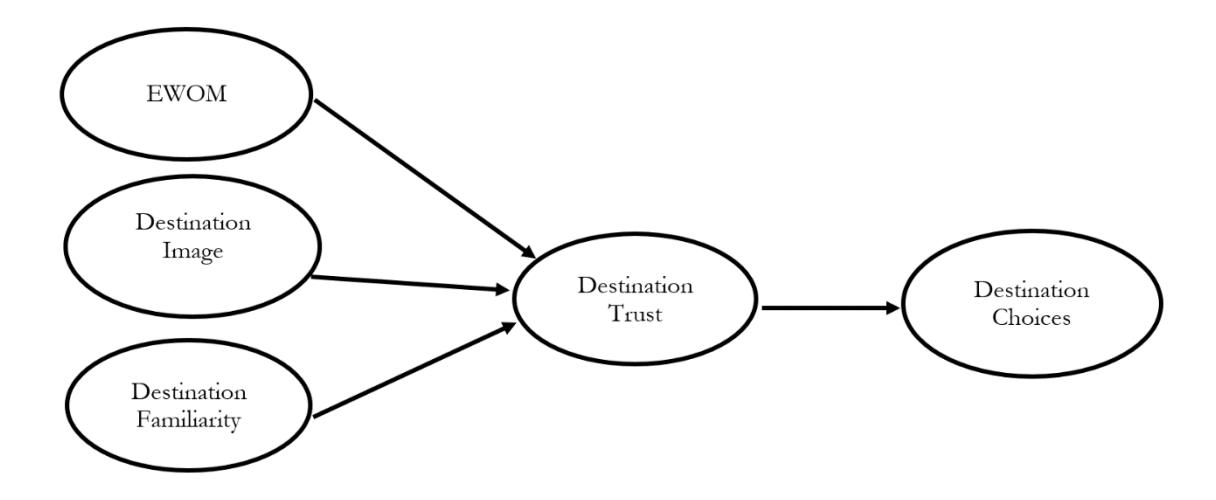
Figure 1. Conceptual Framework of Measuring Perceptions of Consumer Destination Image, Familiarity, E-WOM, Trust with Destination Choice
3. Methodology
The current study has taken a quantitative method on the basis of the problem statement. Reason to select quantitative to take a larger sample that can solve the problem of generalizability. The quantitative method helps to quantify with numeric data that can easily transform into statistics, and it measures opinions, behaviour, and attitudes of a larger sample of respondents (Law & Buhalis, 2010). The study has applied non-probability sampling (convenience sampling) because of the unknown population. Sample size based on 5% margin of error that is 382 that represent populations and it estimated that more than 75000 tourists have visited northern areas (Sekaran, 2016).
3.1. Instrumental an procedure of data collection
Primary data collection methodology is used. Items are adopted and some are adapted on the basis of literature and context: (i) Electronic word of mouth (E-WOM) items taken from (Liang, Choi, & Joppe, 2018) (ii) destination image items taken from (Prayag & Ryan, 2012), (iii) destination familiarity items taken from (Artigas, Vilches-Montero, & Yrigoyen, 2015), (iv) destination trust items taken from (Delgado-Ballester, 2004), (v) destination choices items taken from (Masiero & Qiu, 2018). Items were previously measured in Airbnb context and the current study is related to the tourism context so it is adapted accordingly. There are some criteria that the current study followed, a questionnaire filled by those who have already visited northern areas of Pakistan and have shared their experience.
3.2. Statistic technuque
Smart PLS software has used by current study to analyze data. It is easy to use, frankly compare to others. However, SmartPLS allows analyzing direct and indirect effect within model (Hosseinifard, Abbasi, Fadaki, & Clay, 2019).
3.3. Pilot test
To ensure the validity and reliability of the data collection instrument, the process of pilot testing was initiated to reduce measurement errors through by editing questionnaire content, questionnaire design and format, and respondent. The questionnaire developed for the purpose of the data collection was presented to the two domain experts in the field of Marketing and their kind insight and expert opinion was requested. The insight received from domain experts were incorporated into the questionnaire. The questionnaire was further distributed among 28 respondents to check the reliability statistics of the questionnaire (Table 1).
Variable Numbers of items Croanbach alpha Electronic word of mouth 5 0.850 Destination Image 5 0.779 Destination Familiarity 5 0.880 Destination trust 5 0.894 Destination Choice 8 0.735
Table 1. Reability of Items
The value is not far from acceptable range of the 0.60, therefore, researchers decided to retain the all of items of destination choice for data collection and run the other measures of ensure the reliability of the data.
4. Data Analysis and Results
4.1. Descriptive statistic
The sample size of the current study is 382. From 237 are males and 145 are females. According to the results of data analysis, the majority of the respondent are males with having 62.00% ratio while 38.00% proportion of females. It shows the male ratio is a dominant and frequent visit to northern areas. Moreover, the age factor is categorized into 5 different age brackets. In addition, householder income is categorized in four different household income brackets, as shown in Table 2. Additionally, the demographic variable is categorized into three different education levels: Undergraduate, Graduate and Post Graduate. In the descriptive frequency of travel is a demographic variable that categorized in three different brackets. This study also gained the data regarding how frequent individuals visit northern areas and the purposes of visit by a tourist who has visited to northern areas. Furthermore, it has also categorized in five different purposes that respondents choose to visit northern areas (Table 3).
Table 2. Frequency of Gender, Age, Household Income and Education (N=382)
| Frequency | Percentage (%) | |
|---|---|---|
| Gender | ||
| Male | 237 | 62.0 |
| Female | 145 | 38.0 |
| Age | ||
| Less than or 20 Years | 10 | 2.6 |
| 21 – 30 | 237 | 62.0 |
| 31 – 40 | 105 | 27.5 |
| 41 – 50 | 25 | 6.5 |
| Greater than or 61 | 5 | 1.3 |
| Houshold Income | ||
| Less than 100000 | 109 | 28.5 |
| 100000 to 300000 | 143 | 37.4 |
| 300001 to 400000 | 69 | 18.1 |
| Greater than 400000 | 61 | 16.0 |
| Education | ||
| Undergraduate | 54 | 14.1 |
| Graduate | 168 | 44.0 |
| Post Graduate | 160 | 41.9 |
Table 3. Frequency of Travel and Purpose of Visit (N=382)
| Frequency | Percentage (%) | |
|---|---|---|
| Frequency of Travel | ||
| Once a year | 247 | 64.7 |
| Twice a year | 67 | 17.5 |
| Thrice a year | 68 | 17.8 |
| Purpose of Visit | ||
| Holiday | 171 | 44.8 |
| Visiting Friends and Relatives | 155 | 40.6 |
| Business | 20 | 5.2 |
| Honeymoon | 10 | 2.6 |
| Others | 26 | 6.8 |
4.2. Construct validity and reability
The minimum value to ensure reliability through Cronbach alpha is 0.60. All constructs value is greater than 0.6 it shows constructs are reliable. The second way to ensure the reliability is through composite reliability which takes factor loading (Peterson & Kim, 2013). The minimum acceptable value of composite reliability is 0.70. All constructs value is greater than 0.7 it shows constructs are reliable. The minimum accepted value of AVE is 0.5 (Hair, Henseler, Dijkstra, & Sarstedt, 2014). All constructs value is greater than 0.5 it shows constructs are valid.
Table 4. Construct Validity and Reliability
| Cronbach's Alpha | Composite Reliability | Average Variance Extracted (AVE) | |
|---|---|---|---|
| Destination Choice | 0.887 | 0.911 | 0.596 |
| Destination Familiarity | 0.910 | 0.933 | 0.735 |
| Destination Image | 0.889 | 0.918 | 0.691 |
| Destination Trust | 0.930 | 0.947 | 0.781 |
| E-WOM | 0.893 | 0.921 | 0.701 |
4.3. Discriminant validity
The criteria for ensuring discriminant validity through Fornell-Locker test value above 0.70 (Ab Hamid, Sami, & Sidek, 2017). All Constructs value is greater than 0.70 it shows that constructs are discriminant valid.
Table 5. Discriminant Validity
| Dest.* Choice | Dest.* Familiarity | Dest. * Image | Dest.* Trust | E-WOM | ||
|---|---|---|---|---|---|---|
| Destination Choice | 0.772 | |||||
| Destination Familiarity | 0.680 | 0.857 | ||||
| Destination Image | 0.831 | 0.700 | 0.863 | |||
| Destination Trust | 0.860 | 0.671 | 0.816 | 0.883 | ||
| E-WOM | 0.782 | 0.627 | 0.725 | 0.748 | 0.837 |
*Destination
4.4. Explanation of variance
The variance of the model is generated from the contribution of independent variables variance into dependent variable variance.
Table 7. Explanation of Variance
| R Square | R Square Adjusted | |
|---|---|---|
| Destination Choice | 0.835 | 0.834 |
| Destination Trust | 0.725 | 0.723 |
4.5. Standardized Root Mean square Residual (SRMR)
According to PLS-SEM literature, having value less than 0.1 or 0.08 in original model can be considered as goodness of fit (Hu & Bentler, 1998). The SRMR value is 0.093 that is less than 0.1 and shows model is good fit.
4.6. Outer Loading
The minimum criteria to accept for outer loading to retain an item is 0.7 (Hair Jr, Hult, Ringle, & Sarstedt, 2016). All constructs items value is greater than 0.7 it shows constructs of items met the criteria.
Table 6. Outer Loading
| Dest. Choice | Dest. Familiarity | Dest. Image | Dest.Trust | E-WOM | |
|---|---|---|---|---|---|
| DChoice2 | 0.736 | ||||
| DChoice3 | 0.813 | ||||
| DChoice4 | 0.745 | ||||
| DChoice5 | 0.717 | ||||
| DChoice6 | 0.778 | ||||
| DChoice7 | 0.748 | ||||
| Dchoice1 | 0.856 | ||||
| DFamiliarity1 | 0.822 | ||||
| DFamiliarity2 | 0.872 | ||||
| DFamiliarity3 | 0.881 | ||||
| DFamiliarity4 | 0.888 | ||||
| DFamiliarity5 | 0.822 | ||||
| DImage1 | 0.793 | ||||
| DImage2 | 0.837 | ||||
| DImage3 | 0.857 | ||||
| DImage4 | 0.855 | ||||
| DImage5 | 0.813 | ||||
| DTrust1 | 0.918 | ||||
| DTrust2 | 0.867 | ||||
| DTrust3 | 0.847 | ||||
| DTrust4 | 0.892 | ||||
| DTrust5 | 0.892 | ||||
| E-WOM1 | 0.880 | ||||
| E-WOM2 | 0.896 | ||||
| E-WOM3 | 0.817 | ||||
| E-WOM4 | 0.858 | ||||
| E-WOM5 | 0.724 |
**Destination choice (Dchoice), Destination familiarity (Dfamiliarity), Destination image (Dimage), Destination trust (Dtrust), and Electronic word of mouth (E-WOM).
4.7. Assesment of structural model
Table 8. Assesment of Structural Model
| Hypothesis | Beta | Standard Deviation | T Statistics | P Values |
|---|---|---|---|---|
| Values | (STDEV) | (O/STDEV) | ||
| Destination Familiarity à Destination Choice | 0.030 | 0.038 | 0.792 | 0.429 |
| Destination Familiarity à Destination Trust | 0.127 | 0.054 | 2.346 | 0.019 |
| Destination Image à Destination Choice | 0.398 | 0.067 | 5.961 | 0.000 |
| Destination Image à Destination Trust | 0.511 | 0.057 | 8.901 | 0.000 |
| Destination Trust à Destination Choice | 0.364 | 0.058 | 6.308 | 0.000 |
| E-WOM à Destination Choice | 0.202 | 0.045 | 4.538 | 0.000 |
| E-WOM à Destination Trust | 0.298 | 0.045 | 6.569 | 0.000 |
4.8. Assesment of mediation analysis
Mediating variable helps to strengthen the relationship between independent variable that is destination familiarity, and dependent variable which is destination choice by 4.6%.
Table 9. Assesment of Mediation Analysis
| Standard Deviation | T Statistics | P | ||
|---|---|---|---|---|
| Mediation Paths | Beta Values | (STDEV) | (O/STDEV) | Values |
| Destination Familiarity à Destination | 0.046 | 0.022 | 2.126 | 0.034 |
| Trust à Destination Choice | ||||
| Destination Image à Destination | 0.186 | 0.031 | 6.008 | 0.000 |
| Trust à Destination Choice | ||||
| E-WOM à Destination Trust à | 0.109 | 0.026 | 4.170 | 0.000 |
| Destination Choice |
4.9. Assesment of model
It has been found that all values are significant and all hypothesis are accepted.
Table 10. Hypothesized Assesment
| Hypothesis | ||
|---|---|---|
| H1 | E-WOM positively influences destination trust. | Accepted |
| H2 | Destination image positively influences destination trust. | Accepted |
| H3 | Destination familiarity positively influences destination trust. | Accepted |
| H4 | Destination trust positively influences destination choice. | Accepted |
| H5 | Destination trust mediate relationship between E-WOM, destination Image, | Accepted |
| destination familiarity and destination choices. |
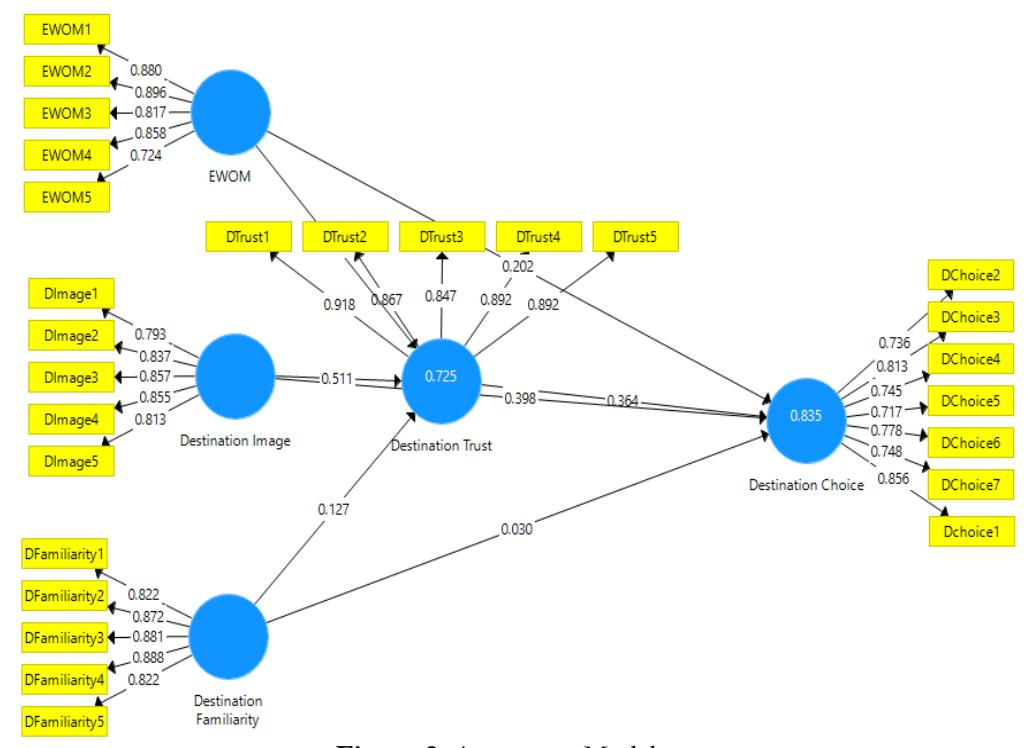
Figure 2. Assesment Model
5. Discussion
The aim of the current study is to use signaling theory in tourism marketing from the perspective of different variables that include electronic word of mouth (E-WOM), destination image, destination familiarity, destination trust, and destination choice. From literature, it has observed signals create trust in consumers to choose products and services and go on the same destination because of having positive feedback. Customer satisfaction is an element of trust that the current study investigates by taking satisfaction as an item in destination trust.
Individuals initiate signals by posting on social media that creates itself a signal for others to like, or to think of it. It is the main theme of the current study how signals create an intensity in tourists to visit. Having strong signals tourists create an image of the product, services where it comes from known as familiarity such as: products from German and Japanese are more superior from Hong Kong and Korea (Lee & Robb, 2016).
H1: E-WOM positively influences destination trust
One of the hypotheses of the current study is to analyze E-WOM positively influences destination trust. The current study has confirmed that E-WOM positively influences on destination trust. The result of the current study has concluded that E-WOM has a positive relationship. According to results of the data analysis, E-WOM has a value of .298 or 29.8% influence on destination trust. It suggests a significant influence of E-WOM on destination trust.
The previous study has also confirmed E-WOM reduced perceived risk because of having trust in E-WOM (Liang, Choi, & Joppe, 2018). Another study also confirmed E-WOM has a direct and positive relationship and individuals increase them repurchase intention after having positive experiences (Wu & Wang, 2011).
H2: Destination image positively influences destination trust.
The second hypothesis of the current study is to analyze destination image positively influences destination trust. The result of the current study has concluded that the destination image has a positive relationship. According to results of data analysis, destination image has a value of .511 or 51.1% influence on destination trust. It suggests a significant influence of destination image on destination trust.
The previous study has also confirmed that perception is part of destination image, better perception toward the place the greater her or his trust towards the destination will be (Artigas, Yrigoyen, Moraga, & Villalón, 2017).
H3: Destination familiarity positively influences destination trust.
The third hypothesis of the current study is to analyze destination familiarity positively influence destination trust. The result of the current study has concluded that destination familiarity has a positive relationship. According to the result of data analysis, destination familiarity has a value of
.127 or 12.7% influence on destination trust. It suggests a significant influence of destination familiarity on destination trust. The previous study has also confirmed a reputation increase trust in the destination (Artigas, Yrigoyen, Moraga, & Villalón, 2017).
H4: Destination trust positively influences destination choice.
The fourth hypothesis of the current study is to analyze destination trust positively influences destination choice. Results of data analysis have confirmed destination trust positively influences destination choice. The previous study has also confirmed that reputation of destination creates trust in a destination that tourists willing to visit again, having better reputation influences trust that will lead to visit again (Artigas, Yrigoyen, Moraga, & Villalón, 2017).
5.1. Assesment of mediation analysis
Results of data analysis have confirmed destination trust mediates the relationship between E-WOM, destination image, destination familiarity, and destination choice. According to results of data analysis destination trust mediates the relationship between E-WOM and destination choice by value of .109 or 10.9%. E-WOM indirectly effects destination choice by 10.9% through destination trust.
H5: Destination trust mediate the relationship between E-WOM, destination Image, Destination familiarity, and destination choices.
| Mediation Paths | Beta Values | Standard Deviation (STDEV) | T Statistics (O/STDEV) | P Values |
|---|---|---|---|---|
| Destination Familiarity à Destination | 0.046 | 0.022 | 2.126 | 0.034 |
| Trust à Destination Choice | ||||
| Destination Image à Destination Trust à | 0.186 | 0.031 | 6.008 | 0.000 |
| Destination Choice | ||||
| E-WOM à Destination Trust à | 0.109 | 0.026 | 4.170 | 0.000 |
| Destination Choice |
Table 11. Assesment of Model
5.2. Theoretical implication
With the conceptualization of realistic travel expectations, we advance theoretical knowledge on signaling theory and destination choice in a tourism context. Previous tourism research predominantly addresses the concept of signaling theory, that is the correlation of tourists' selfconcept with trust, social media that relates E-WOM, brand origin image (Benlian & Hess, 2011), (Sichtmann & Diamantopoulos, 2013), (Boateng, 2019). It has found signals intimate by individuals in shape of E-WOM, liking, posting video, commenting. Having access to information from several media, the accuracy of information reduce perceive risk. The study suggested that technological platform used by signaling party, where right signals sent to receivers (Boateng, 2019).
Signals should be clear, easily understandable, minimize interpretation that individuals access proper and taking the right decision with the help of signals. Other study suggested with the reference of signaling theory, it has confirmed brand origin image acts as a strong signal of quality and identified as a key driver of success (Sichtmann & Diamantopoulos, 2013). (Benlian & Hess, 2011) Suggested that signals are helpful in influencing participation or helping to mitigate adverse selection.
5.3. Managerial implication
The results of the current research study imply important insights for marketing practitioners. Tourists companies can post more videos, pics and live videos to create E-WOM that increase trust in the destination. Companies can use the perception of individuals and improve facilities that offering to tourists such as access to accommodation when tourists arrive at the destination they feel the foreign environment that increase trust towards the destination and increased chances to visit again. Having convenient facilities, comfortable to individuals but they will useless unless destination could not have a reputation that creates trust. Companies can improve the reputation and perception of destination by experiencing them visually and beautiful scenery that increased familiarity of destination and builds trust in a destination that potential consumers willing to visit.
5.4. Limitation and future recommendations
The current study establishes a statistically significant positive relationship of destination choice to determine E-WOM, destination image, destination trust, destination familiarity positively influence. These are surely not only the constructs that influence on destination choice. There are probably other constructs that influence on destination choice such as destination reputation, opinions, perceptions, knowledge and attitudes of different stakeholders, hosts, community as a whole, and also incorporate prior experience with the destination that tourists have visited. The current study has not incorporated socio-cultural, therefore the author recommends the current destination choice model should be used international tourists that varied cultural background.
6. Conclusion
The present research addresses the need to develop a conceptual model on destination choice from signaling theory perspective. It also informs that signification variables for consumers to make choice decisions are E-WOM, destination image, familiarity and trust. The current study also extends this theoretical perspective to destination choice in some ways. This study analyzed how individuals create signals by social media as E-WOM, how an image can be a strong signal that tourists rely on, and choosing a destination. Tourists share their experiences, the information relates destination that crate signals and increase familiarity and leads to destination choice. Having a belief that place is safe enough that create a signal of trust and leads to destination choice. It further concludes that E-WOM, destination image, destination have positive influence on destination trust. Destination trust is a mediator that also mediates the relationship between the independent variables and dependent variable, and dependent variable is known as destination choice.
References
- Ab Hamid, M. R., Sami, W., & Sidek, M. M. (2017). Discriminant validity assessment: Use of Fornell & Larcker criterion versus HTMT criterion. In Journal of Physics: Conference Series 890(1), 012163. IOP Publishing.
- Abubakar, A., & Ilkan, M. (2016). Impact of online WOM on destination trust and intention to travel: A medical tourism perspective. Journal of Destination Marketing & Management, 5(3), 192-201.
- Artigas, E. M., Vilches-Montero, S., & Yrigoyen, C. C. (2015). Antecedents of tourism destination reputation: The mediating role of familiarity. Journal of Retailing and Consumer Services, 26, 147- 152.
- Artigas, E. M., Yrigoyen, C. C., Moraga, E. T., & Villalón, C. B. (2017). Determinants of trust towards tourist destinations. Journal of Destination Marketing & Management, 6(4) , 327-334.
- Baloglu, S. (2001). Image variations of Turkey by familiarity index: Informational and experiential dimensions. . Tourism Management, 22(2), 127–133.
- Benlian, A., & Hess, T. (2011). The signaling role of IT features in influencing trust and participation in online communities. International Journal of Electronic Commerce, 15(4), 7-56.
- Boateng, S. L. (2019). Online relationship marketing and customer loyalty: a signaling theory perspective. International Journal of Bank Marketing, 37(1), 226-240.
- Carmines, E. G., & Zeller, R. A. (1979). Reliability and validity assessment (Vol. 17). Sage Publications.
- Chen, C. C., Chung, J. Y., Gao, J., & & Lin, Y. H. (2017). Destination familiarity and favorability in a country-image context: examining Taiwanese travelers' perceptions of China. Journal of Travel & Tourism Marketing, 34(9), 1211-1223.
- Clark, D. R., & Shepherd, D. A. (2018). Country familiarity in the initial stage of foreign market selection. Journal of International Business Studies, 49(4), 442-472.
- Connelly, B. L., Certo, S. T., Ireland, R. D., & Reutzel, C. R. (2011). Signaling theory: A review and assessment. Journal of Management, 37(1), 39-67.
- Crompton, J. L. (1979). An assessment of the image of Mexico as a vacation destination and the influence of geographical location upon that image. Journal of travel research, 17(4), 18-23.
- De Nisco, A., Mainolfi, G., Marino, V., & Napolitano, M. R. (2015). Tourism satisfaction effect on general country image, destination image, and post-visit intentions. Journal of Vacation Marketing, 21(4), 305-317.
- Delgado-Ballester, E. (2004). Applicability of a brand trust scale across product categories: A multigroup invariance analysis. European Journal of Marketing, 38(5/6), 573-592.
- Finstad, K. (2010). Response interpolation and scale sensitivity: Evidence against 5-point scales. Journal of Usability Studies, 5(3), 104-110.
- Gallarza, M. G., Saura, I. G., & Garcı́a, H. C. (2002). Destination image: Towards a conceptual framework. Annals of tourism research, 29(1), 56-78.
- Groves, R. M. (1987). Research on survey data quality. The Public Opinion Quarterly, 51, S156-S172.
- Hair Jr, J. F., Hult, G. T., Ringle, C., & Sarstedt, M. (2016). A primer on partial least squares structural equation modeling (PLS-SEM). Sage Publications.
- Hair, J. F., Black, W. C., Babin, B. J., & Anderson, R. E. (2010). Multivariate data analysis (7th ed.). Englewood Cliffs: Prentice Hall.
- Hair, J. F., Henseler, J., Dijkstra, T. K., & Sarstedt, M. (2014). Common beliefs and reality about partial least squares: comments on Rönkkö and Evermann. Faculty Publications. 3666. https://digitalcommons.kennesaw.edu/facpubs/3666.
- Hennig-Thurau, T., Gwinner, K. P., Walsh, G., & Gremler, D. D. (2004). Electronic word-of-mouth via consumer-opinion platforms: what motivates consumers to articulate themselves on the internet?. Journal of interactive marketing, 18(1), 38-52.
- Horng, J. S., Liu, C. H., Chou, H. Y., & Tsai, C. Y. (2012). Understanding the impact of culinary brand equity and destination familiarity on travel intentions. Tourism management, 33(4), 815- 824.
- Hosseinifard, Z., Abbasi, B., Fadaki, M., & Clay, N. M. (2019). Postdisaster Volatility of Blood
- Donations in an Unsteady Blood Supply Chain. Decision Sciences. 51(2), 255-281.
- Hu, L.-t., & Bentler, P. M. (1998). Fit Indices in Covariance Structure Modeling: Sensitivity to Underparameterized Model Misspecification, Psychological Methods, 3(4), 424-453. .
- Ishida, K., Slevitch, L., & Siamionava, K. (2016). The Effects of Traditional and Electronic Wordof-Mouth on Destination Image: A Case of Vacation Tourists Visiting Branson, Missouri. Adminstrative Science Journal, 6(4), 1-17.
- Jiang, J., Gretzel, U., & Law, R. (2010). Do negative experiences always lead to dissatisfaction? testing attribution theory in the context of online travel reviews. Information and communication technologies in tourism , 297-308.
- Law, R. Q., & Buhalis, D. (2010). Progress in tourism management: A review of website evaluation in tourism research. Tourism Management, 31(3), 297-313.
- Lee, Y. K., & Robb, C. A. (2016). Moderating Effect of Country Familiarity and Country Image on Product Purchase Intention in South Africa. Journal of International Trade & Commerce, 12(4), 237-256.
- Liang, L. J., Choi, H. C., & Joppe, M. (2018). Understanding repurchase intention of Airbnb consumers: perceived authenticity, electronic word-of-mouth, and price sensitivity. Journal of Travel & Tourism Marketing, 35(1), 73-89.
- Lin, J., Lobo, A., & Leckie, C. (2019). The influence of green brand innovativeness and value perception on brand loyalty: the moderating role of green knowledge. Journal of Strategic Marketing, 27(1), 81-95.
- Mansfeld, Y. (1992). From motivation to actual travel. Annals of Tourism Research, 19(3), 399-419.
- Marinao, E., Chasco, C., & Torres, E. (2012). Trust in tourist destinations. The role of local inhabitants and institutions. Academia. Revista Latinoamericana de Administración, (51).
- Masiero, L., & Qiu, R. T. (2018). Modeling reference experience in destination choice. Annals of Tourism Research, 72, 58-74.
- Munar, A. M., & Jacobsen, J. K. (2013). Trust and involvement in tourism social media and webbased travel information sources. Scandinavian Journal of Hospitality and Tourism, 13(1), 1-19.
- Nagelkerke, N. J. (1991). A note on a general definition of the coefficient of determination. Biometrika, 78(3), 691-692.
- Nation, T. (2015). Pakistani peaks that are among worlds highest, Retrieved from: https://nation.com.pk/11-Dec-2015/5-pakistani-peaks-that-are-among-world-s-highest.
- Neuman, L. W. (2014). Social Research Methods, 7th Eds. Pearson Education India.
- Nevo, B. (1985). Face validity revisited. Journal of Educational Measurement, 22(4), 287-293.
- Oppermann, M. (1999). Predicting destination choice—A discussion of destination loyalty. Journal of Vacation Marketing, 5(1), 51-65.
- Pakistan. (2018). Reports economic impact on research Pakistan 2018. Retrieved from: https://www.wttc.org/-/media/files/reports/economic-impactresearch/archived/countries-2018/ pakistan2018.pdf.
- Peterson, R. A., & Kim, Y. (2013). On the relationship between coefficient alpha and composite reliability. Journal of Applied Psychology, 98(1), 194.
- Prayag, G., & Ryan, C. (2012). Antecedents of tourists' loyalty to Mauritius: The role and influence of destination image, place attachment, personal involvement, and satisfaction. Journal of travel
- research, 51(3), 342-356.
- Prayag, G., & Ryan, C. (2012). Antecedents of tourists' loyalty to Mauritius: The role and influence of destination image, place attachment, personal involvement, and satisfaction. Journal of travel research, 51(3), 342-356.
- Rice, W. R. (1989). Analyzing tables of statistical tests. Evolution, 43(1), 223-225.
- Saunders, M. N. (2011). Research methods for business students, 5th Eds. India: Pearson Education.
- Sekaran, U. &. (2016). Research methods for business: A skill building approach. Carbondale: John Wiley & Sons.
- Sichtmann, C., & Diamantopoulos, A. (2013). The impact of perceived brand globalness, brand origin image, and brand origin–extension fit on brand extension success. Journal of the Academy of Marketing Science, 567-585.
- Smith, V. L., & Font, X. (2014). Volunteer tourism, greenwashing and understanding responsible marketing using market signalling theory. Journal of Sustainable Tourism, 22(6), 942-963.
- Sotiriadis, M. D., & Van Zyl, C. (2013). Electronic word-of-mouth and online reviews in tourism services: the use of twitter by tourists. Electronic Commerce Research, 13(1), 103-124.
- Spence, M. (1976). Informational aspects of market structure: An introduction. The Quarterly Journal of Economics, , 591-597.
- Stylidis, D., Shani, A., & Belhassen, Y. (2017). Testing an integrated destination image model across residents and tourists. Tourism Management, 58, 184-195.
- Taber, K. S. (2017). The use of cronbach's alpha when developing and reporting research instruments in science education. Research in Science Education,, 1-24.
- Taj, S. A. (2016). Application of signaling theory in management research: Addressing major gaps in theory. European Management Journal, 34(4), 338-348.
- The News. (2018). 175 million tourists visited Pakistan in 2017. Retrieved from: https://www.thenews.com.pk /latest/309042-175-million-tourists-visited-pakistan-in-2017 ptdc.
- Today, P. (2017). 175 million tourists visited Pakistan in 2017. Retrieved from: https://www.pakistantoday.com.pk /2018/04/25/1-75-million-tourists-visited-pakistan-in-2017/.
- Traveller, C. N. (2020). Best holiday destinations 2020. Retrieved from: https://www.cntraveller.com/gallery/best-holiday-destinations-2020.
- Trump, D. (2018). Trump says: US has gotten nothing from Pakistan aid. Retrieved from: https://www.reuters.com/ article/us-trump-pakistan/trump-says-u-s-has-gotten-nothingfrom-pakistan-aid-idUSKBN1EQ112.
- Vienna, V. (2018). Kashmir the scenic beauty of Gilgit Baltistan attracts millions of tourists. Retrieved from: http://voiceofvienna.org/2018/07/16/kashmir-the-scenic-beauty-of-gilgit-baltistan-attractsmillions-of-tourists/.
- Walliman, N. (2017). Research methods: The basics. Routledge.
- WTTC. (2018). Reports economic impact research by regions 2018. Retrieved from: https://www.wttc.org/- /media/files/reports/economic-impact-research/regions-2018/world2018.pdf.
- Wu, P. C., & Wang, Y. C. (2011). The influences of electronic word-of-mouth message appeal and message source credibility on brand attitude. Asia Pacific Journal of Marketing and Logistics, 23(4),
Xia, L., & Bechwati, N. N. (2008). Word of mouse: the role of cognitive personalization in online consumer reviews. Journal of interactive Advertising, 9(1), 3-13.
Yang, J., Yuan, B., & Hu, P. (2009). Tourism Destination Image and Visit Intention: Examining the Role of Familiarity: 旅游目的地形象和游览意向—研究亲景度对两者的影响. Journal of China Tourism Research, 5(2), 174-187.
Appendices:
Delineation of Research Studies
| No | Study | Research Question/ Research Objective and Country Context | Variables | Metho dology | Results/Findings |
|---|---|---|---|---|---|
| 1 | De Nisco, Mainolfi, Marino, & Napolitano, 2015 | This study object to investigate: "satisfaction of tourism on tourists' evaluation of components of general country image and perception of the country as tourism destination." Country context: Italy. | Tourism satisfaction, Quanti general country tative image, destination image, and post-visit behavioral intentions | Empirical findings described that higher level of tourism satisfaction strongly related to improvement of country image that confirmed by analyzed, affective country image, and destination image supported to hypothesize. | |
| 2 | Artigas, Yrigoyen, Moraga, & Villalón, 2017 | This study aims to analyze question tied to the tourist destination in itself, not the service industry that associate with tourist activity. Country context: Chile | Reputation, Familiarity, Cognitive perception, and Affective evaluation | Quanti tative | Study confirmed that having good place's' reputation create trust for tourists' in destination. Trust is consequence of reputation of destination, as well as affective and cognitive evaluation of tourists. |
| 3 | Masiero & Qiu, 2018 | Study object to explain the preference heterogeneity using a set of key tourist characteristics, namely Formative experience, personality, and travel experience. Country context: US, UK, and Australia | Cultural Attraction Natural Attraction Outdoor Recreational Attractions Entertainment Attractions Hospitality Services Food and dinning Services Transportation Services Which budget alternative would you choose? | Quanti tative | Findings concluded that tourists visit a new destination, they tend to favor the level of quality that experienced from services and attractions in a specific destination. |
| 4 | Abubakar & Ilkan, 2016 | Objective: our knowledge no research has investigated the "impact of online WOM on destination trust and intention to travel, coupled with the moderating effect of income." Country context: Cyprus | Online E-WOM, destination trust, and intention to travel | Quanti tative | Findings show how online WOM influences destination trust and travel intention. |
| 5 | Horng, Liu, Chou, & Tsai, 2012 | Purpose of this paper is "to investigate how brand equity contributes to travel intentions and how | Brand image, perceived quality, destination familiar, brand awareness, | Quanti tative | These results further confirm that destination familiarity positively moderates the relationship |
| destination familiarity moderates the relationship between brand equity and travel intentions in culinary tourism." Country context: Taiwan | brand loyalty, and travel intention | between perceived quality and travel intentions in culinary tourism. The results indicate that there is a direct positive relationship between brand equity and travel intentions in culinary tourism. | |||
|---|---|---|---|---|---|
| 6 | Smith & Font, 2014) | This research aims to understand "how VT operators communicate responsibility towards the projects visited and the needs of the volunteers, and to establish the relationship between responsibility and price signaling." Context: – Asia, Africa and Central/South America | 19 responsibility | Mixed Method | We find that responsibility is not used for market signaling; preference is given to communicating what is easy, and not what is important. The status of the organization is no guarantee of responsible |
| 6 | Present research | Measuring Perceptions of Consumer Destination image, Destination familiarity, E-WOM, Destination trust in Destination Choices. Country context: Pakistan | E-WOM, destination image, destination familiarity, destination trust, destination choice | Quanti tative | Results conclude that destination trust mediates the E-WOM, destination image, destination familiarity with destination choice (from signaling theory perspective). |