
1. Introduction
The Asian Games (AG) is a sanctioned quadrennial initiative by the Olympic Council of Asia (OCA), hosting a multi-sports event for every nation in the Asian Continent. Indonesia hosted the 18th Asian Games Jakarta-Palembang (2018 AG), which began on August 18 and ended on September 2. The sports were played across three distinct provinces: DKI Jakarta (the national capital of Indonesia), Palembang (the capital city of Sumatera Selatan Province), and Jawa Barat as the supporting province. With 11,300 athletes from 46 Asian nations competing in 40 sporting disciplines, encompassing 465 sports events, the 2018 AG is the biggest in the history of AG (OCA, 2019). The number of participants surpasses the 2014 Incheon AG in South Korea, 2010 Guangzhou AG in China, and 2006 Doha AG in Qatar. It resembles the 2016 Olympics in Rio de Janeiro, Brazil, which boasted 11,238 athletes. Moreover, 1,149 foreign country officials were present at the 2018 AG, alongside numerous OCA officials and representatives from international sports federations.
To ensure the successful execution of the 2018 AG, over 13,000 local committees were hired, comprising officials and volunteers of the Indonesia 2018 AG Organizing Committee (INASGOC) and various task forces from governmental bodies and community organizations. Moreover, the event successfully attracted more than five thousand international journalists and nearly 79 thousand foreign tourists, some from continents beyond Asia, who traveled to Indonesia primarily to report on or attend the games (Widyasanti et al., 2019).
For such a significant-scale event financed through governmental budget allocations, capturing the generated economic impact is paramount (Barajas et al., 2016; Lee et al., 2017). Regarding the 2018 AG, previous studies have estimated the economic multiplier impact (Hidayat & Maula, 2019), impact on micro, small, and medium-sized enterprises (SMEs) (Maula et al., 2019) (Wikarya et al., 2022) and determinants of international attendees' expenditure (Revindo, Siregar, et al., 2019). Differently, our study investigates additional potential advantages that the host country can reap in the long term, particularly international attendees' intention to revisit Indonesia after the event. The study holds dual importance. First, extant literature has yet to specifically reference the long-term impact of the AG case or the Indonesia case, except for Revindo et al. (2019) and Revindo et al. (2023). Second, understanding sports event attendees' intention to revisit is essential to maximize the event's economic influence on the host nation and society (Dongfeng, 2013; Hallmann et al., 2015; Osti et al., 2012). This is especially crucial to Indonesia's aspirations to serve as the host nation for other grand sports events in the forthcoming years (Minister of National Development Planning, 2019).
This paper is organized as follows. Section 2 furnishes a brief overview of existing literature concerning sports tourism, sports events, and their economic ramifications. The third section briefs the utilized data and methodology. This is succeeded by the fourth section, which provides descriptive statistics and estimation results on international attendees' propensity to repeat visitation to Indonesia. Section 5 presents conclusions and discusses the academic and practical implications of the findings.
2. Literatur Review
2.1 Sports Tourism and Sports Events
Sports tourism encompasses traveling to participate, spectate sports events, or explore sports-related attractions within a given tourism destination (Delpy, 1998). Hence, it can be classified into three main components: visiting sports attractions, actively participating in sports events, or attending them as a spectator. The concept of sport tourism can be delineated into narrow and broad definitions. Narrowly, it is defined as "the expanded, quasi-double conflict and appropriation of the participation of another
sport which does not exist in the routine living environment, and under other, non-familiar conditions." (Schwark, 2007, p. 119). In a broader term, it refers to "the appropriation of 'self'-participation in sports in the routine living environment under other/alien, non-familiar conditions outside of one's living environment." (Schwark, 2007, p. 119).
Sports tourism has been recording rapid growth in recent years. This industry is estimated to be worth more than US$800 billion globally (Orbis Research, 2018) and is expected to grow 36% annually until 2023 (Technavio Research, 2020). Hence, it stands out as a swiftly burgeoning sector within the broader travel and tourism industry, further spurred by the growing accessibility to travel for middle and lower-income travelers and a more efficient ticketing system (Hritz & Ross, 2010). Within the sports tourism industry, the sports event segment has been gaining importance over the past few decades (Roche et al., 2013). Sports spectators have been proliferating within the sports event segment (Fullerton & Merz, 2008). However, active participation in competing in a sports event, either by teams or individuals, has also been growing. Expanding leagues, tournaments, and competitions across various sports have attracted more frequent participants (Fullerton & Merz, 2008).
2.2 Sports Events' Economic Impact
The economic ramifications of a sporting event are expected to take effect through three phases of the event: (1) during event preparation, (2) during the event, and (3) after the event. The event's preparation phase already generates direct and indirect economic impact through government spending on venue provision and other public amenities, as well as private sector investment and increased inventory (Baade & Matheson, 2004; Davis, 2012; Müller et al., 2016; Solberg & Preuss, 2007). The preparation phase has the potential to directly stimulate the construction, transportation, and trading sectors while, in turn, indirectly stimulating the upstream industries, producing input to cater to those sectors above (Solberg & Preuss, 2007).
Throughout the event, domestic and international attendees and spectators contribute to the local economy by investing in indigenous products and services. Local products include food, beverages, and merchandise, while regional services include tickets, hotels, restaurants, transportation, and possibly entertainment and recreation (Case et al., 2010; Case et al., 2013; Sato et al., 2014). The increasing demands create local business revenues and, in turn, generate multiplier effects in the supporting industries and temporary jobs (Haddad & Haddad, 2010). In the long run, a sports event may still create advantages for the host economy by augmenting tourism and tourism-related employment and reducing seasonal fluctuations in tourist influx (Fourie & Santana-Gallego, 2011; Kasimati, 2003; Ritchie & Adair, 2004). Further, the host region will also gain a better image, infrastructure, public welfare, inward investment, and expertise in event hosting (Kasimati, 2003; KPMG, 2018; Roche et al., 2013). Beyond the event, some attendees are reported to purchase the host country's products still online (Case et al., 2013).
2.3 Expectations of Participants and Visitors
Our study focuses on the long-run economic impact after the 2018 AG event, which is expected to come from international participants and visitors' repeat visits to Indonesia. Higham (2018) categorizes sports tourism events into two distinct classifications: elite and non-elite. Elite sporting events, exemplified by the Olympic Games, have effectively served as platforms for destination promotion. Conversely, non-elite sporting events, like the National Sports Festival for the Elderly in Japan, afford participants opportunities to partake in various tourist endeavors, including sightseeing and recreational activities, but only limited during and immediately after the completion of the event (Chogahara & Yamaguchi, 1998). Experience and expectation are also significant factors that foster the propensity of event attendees to revisit the destination. Zhang et al. (2014) reported that a positive
experience in participating or attending a sports event emerged as a pivotal determinant influencing attendees' inclination toward future event participation. Likewise, Shonk (2006) showed that perception of sports tourism quality significantly contributes to attendees' satisfaction, while satisfaction significantly contributes to attendees' decision to return to future sports events or the host region.
Zhang et al. (2014) further posited that the primary expectations of sports event attendees encompass five factors: convenience, efficiency and excitement, socialization, education, and authenticity. Satisfaction with the experience may stem from activities in the area (Higham, 2018; Kurtzman & Zauhar, 2005; Palrão & Filipe, 2017) and interaction with local people (Gammon & Ramshaw, 2013; Higham, 2018) or the locale itself and its interactions (Palrão & Filipe, 2017; Standeven & Knop, 1999; Weed & Bull, 2004). Furthermore, the satisfaction and experience of tourists can be influenced by their cultural background. Zhang et al. (2014) found that local and foreign tourist groups behaved differently during Shanghai's ATP Masters 1000. The two groups showed differences in their assessments of service provision, satisfaction levels, and intentions for future visits.
3. Methodology
3.1 Data
The study utilizes a combination of primary and secondary data sources. The secondary data was employed to approximate the population of the international participants and visitors of the 2018 AG. The study targeted five distinct respondent groups: International Athletes (IAs), Foreign Country Officials (COs), International Journalists (IJs), International Spectators (ISs), and Olympic Council of Asia (OCA) and International Sports Federations representatives (IFs). These secondary data formed the sampling frame for the subsequent primary data collection phase.
Primary data collection involved face-to-face surveys employing structured questionnaires. The survey was conducted between August 19 and September 4 around the venues and athletes' villages in Jakarta, Palembang, and several cities in Jawa Barat Province. The tailored questionnaire was developed for each respondent group. The first and general section of the questionnaire solicited demographic information such as respondents' names, ages, nationalities, and contact details. Additional inquiries focused on arrival and departure dates in/from Indonesia, experiences in attending or participating in international sports events, and past visits to Indonesia. A segment of the questionnaire was dedicated to evaluating the AG organization, encompassing accommodation and food, transportation, safety and security, match scheduling, information, and telecommunications and internet services arrangements. The respondents were also prompted to share their views on local culture (including hospitality and culinary offerings) and the hosting cities (including public services, traffic conditions, and scenic views). Another questionnaire section investigates respondents' intentions to revisit Indonesia in the future.
Respondents' answers are validated by further questions regarding their planned destination, length of stay, and companionship during their future visits. The drafts of the questionnaires were piloted to national athletes and sports federations before the event. Subsequently, the finalized questionnaires were transcribed into the Computer Assisted Personal Interview (CAPI) program, which facilitated the team to monitor the survey progress, give immediate feedback to enumerators, make voice recordings, and verify survey location coordinates.
| Type of Respondents | Total Population | Respondents |
|---|---|---|
| International Athletes (IAs) | 11,300 | 1,268 |
| Foreign Country Officials (COs) | 1,149 | 261 |
| International Journalists (IJs) | 5,000 | 121 |
| International Spectators (ISs) | 78,854 | 218 |
| Olympic Council of Asia & International Sports Federation Representatives (OCA & IF) | Unknown | 46 |
| Total | 1,914 |
Table 1. Population, Sample, and Types of International Respondents
Source : The INASGOC provided the population of IAs and COs from 44 participating nations (excluding Indonesia) and IJs. Widyasanti et al. (2019) estimated the population of ISs.
Table 1 presents the demographic distribution and response data across respondent categories. The survey on IAs and COs applied a proportional sampling technique based on country of origin. In contrast, the study about IJs and ISs utilized a quota sampling approach, whereby respondents were conveniently selected until the predetermined maximum quota per country was reached, owing to the absence of a population list. Similarly, the survey targeting OCA & IF officials employed a convenience sampling method, which was necessitated by challenges in scheduling survey appointments. During the survey, 1,914 completed and usable responses were collected.
3.2 Profile of Respondents
Table 2 shows the frequency of responses from diverse respondents categorized by their geographical regions of origin. The samples of each respondent category are distributed across various sub-regions within Asia. Furthermore, it is noteworthy that the survey captured responses from areas outside of Asia, primarily journalists and spectators. Additionally, it is pertinent to acknowledge the participation of officials from non-Asian countries, both from individual nations and organizations such as the OCA and IF, who are professionally hired in their respective tasks.
Table 2 also shows that IAs and OCA & IF are the youngest and oldest cohorts, respectively, with an average age of 24 and 50, respectively. The majority of male participants are observed across all respondent categories. Most international attendees, apart from officials affiliated with OCA & IF, are experiencing their inaugural visit to Indonesia during the 2018 AG. Conversely, most international attendees possess prior exposure to global sporting events, except for representatives from COs and ISs.
3.3 Data Analysis
Both theoretical underpinnings and empirical evidence discussed in the extant literature have provided this study with various factors hypothesized to correlate with tourists' likelihood to repeat visitation in the future. One framework that is used in Kastenholtz (2013) suggests that four main factors drive and increase tourism destination loyalty, and hence the tourist's propensity to revisit: 1) socio-demographic; 2) travel behavior; 3) tourists' motivation; and lastly, 4) destination image and tourists' satisfaction factors. Our study incorporates these four factors and re-categorizes them into three distinct groups of factors, which include socio-demographic, tourist-specific, and psychographic. Specifically, we merge the aspects of motivation and travel behavior into a single category of tourist-specific factors, with the rationale that the motivation in visiting the AG may differ across respondents, depending on the respondent types.
The findings documented by previous studies have shed light on the importance of sociodemographic factors in affecting the tourists' perceived image of the destination and their propensity to revisit it. These demographic factors encompass, but are not confined to, age, gender, income and education level, and place of origin. From these variables, our study selects the most pertinent metrics within the framework of sporting events, comprising age (Barros & Assaf, 2012; Chen & Chen, 2010), gender (Chi & Qu, 2008; Vassiliadis, 2008), and region of origin (Kastenholtz, 2013).
Table 2. Obtained Sample by Type of Respondents and Regions
| Variable | Description | IAs | COs | IJs | ISs | OCA & IF |
|---|---|---|---|---|---|---|
| Origin (count) | South East Asia (Malaysia, Singapore, Thailand, Brunei Darussalam, the Philippines, Vietnam, Cambodia, Laos, Myanmar, Timor Leste) | 304 | 67 | 27 | 49 | 11 |
| East Asia (China, Japan, South Korea, Hong Kong, Macau, Mongolia, North Korea, Taiwan) | 377 | 68 | 37 | 85 | 15 | |
| South Asia (India, Sri Lanka, Pakistan, Bangladesh, Afghanistan, Nepal, Bhutan, Maldives) | 189 | 42 | 22 | 28 | 3 | |
| Central Asia (Uzbekistan, Afghanistan, Kazakhstan, Kyrgyzstan, Tajikistan, Turkmenistan) | 165 | 19 | 8 | 3 | 1 | |
| Middle East (Saudi Arabia, Syria, Lebanon, Palestine, Jordan, Iraq, Yemen, Iran, Oman, United Arab Emirates, Qatar, Bahrain, Kuwait | 233 | 62 | 17 | 8 | 5 | |
| Outside Asia (Europe, America, Africa, Australia & Oceania) | 3 | 10 | 45 | 11 | ||
| Total | 1,268 | 261 | 121 | 218 | 46 | |
| Average Age (year) | 24.77 | 42.0 5 | 38.57 | 34.5 | 50.22 | |
| Gender (%) | Male | 61.4 | 84.7 | 85.9 | 59.6 | 71.4 |
| Female | 38.6 | 15.3 | 14.1 | 40.4 | 28.6 | |
| First Time to Indonesia (%) | Yes | 72.4 | 59.8 | 70.3 | 60.6 | 36.7 |
| No | 27.6 | 40.2 | 29.8 | 39.4 | 63.3 | |
| First Time to | Yes | 34.7 | 54 | 32.2 | 50 | 10.2 |
| International Event (%) | No | 65.3 | 45 | 67.8 | 50 | 89.8 |
Source: Derived from the survey data (2018)
Extant empirical literature also suggests that tourist-specific factors are pivotal in affecting tourists' destination loyalty and, thus, their propensity to revisit. Several factors that empirical studies have highlighted include length of stay, travel group composition, number of previous visits to the destination, form of transportation, and tourists' motivation for visit. Our study selects the most pertinent variables within the framework of sporting event, which includes the city where the respondent was interviewed (as the AG was held in two distinct city venues – Jakarta and Palembang), length of stay (Wang, 2003; Kastenholtz, 2013), previous visit experiences (Huang et al., 2010; Correia & Oliveira, 2008) – which we further refine into previous experiences to Indonesia and to other sporting events, and types of respondents. The rationale behind the inclusion of the kinds of respondents in our analysis is that we categorize visitors' motivation (Kastenholz et al., 2006; Kozak, 2001) based on their roles in the sports event, assuming that different types of visitors will have differing visit motivations as well.
Previous studies also highlight the importance of psychographic variables, which directly proxy for visitors' satisfaction with the travel destination, in influencing tourists' likelihood to repeat visitation. Chen & Funk (2010) formulate a 16-item destination image inventory and find that higher inventory assessment contributes to a more positive overall destination experience, thereby inducing a higher propensity to revisit. Among the attributes are assessments of accommodation facilities, sports facilities and activities, city attractions, local infrastructure and transportation, and personal safety. Osti et al. (2012) find that satisfaction in several aspects, including services, prices, and accessibility, positively influences tourists' propensity to revisit. Drawing upon these works, we include variables that measure respondents' assessment of several aspects, such as Information and Communication Technology (ICT) infrastructure, transportation arrangement, safety/security, information access, and broad evaluation of local cultures and cities.
The dependent variable is a qualitative measure with a limited range of categorical options. The dependent variable, denoted as yi, encompasses three choices pertaining to whether the international attendees intend to revisit Indonesia after the event: will revisit, probably revisit, and will not revisit. Hence, we employ the Multinomial Logit (MNL) regression model to predict the probability of respondent I revisiting, considering a predetermined set of independent variables (tourist-related, psychographic factors, and socio-demographic variables). The MNL model is represented by three distinct outcomes that gauge revisit intent (1= yes; 2 = maybe; and 3= = no). The formulation of the MNL model is written as follows:
\[Prob(Revisit_i = j) = \frac{e^{\beta_j x_i}}{\sum_{m=1}^3 e^{\beta_j x_i}}, j = 1,2 \text{ or } 3\]
Where \(\beta_j\) is a vector of parameters of independent variables, \(x_i\) is the respondent i's probability of Revisit<sub>i</sub> = j.
Table 3. Definition and Expected Signs of the Independent Variables
| Variable | Description | Expected Sign |
|---|---|---|
| Socio-demographic Variables | ||
| Age | Respondent's age at the time of the survey (years) | + |
| Male | Respondent's gender (1 = male; 0 otherwise) | + |
| ASIAN | Respondent's origin (1 = ASEAN; 0 otherwise) | +/- |
| Tourist Variables | ||
| Jakarta | Respondent's interview location (1 = Jakarta; 0 otherwise) | +/- |
| LOS | Respondent's length of stay (days) | + |
| Experience | Respondent's previous visit to Indonesia (1 = 'at least once'; 0 = 'never') | - |
| Experiment | Respondent's past attendance in an international sporting event (1 = 'at least once'; 0 = 'never') | - |
| D_CO | 'Country Officials' respondent category (1 = COs; 0 otherwise) | +/- |
| D_IS | 'International Spectators' respondent category (1 = ISs; 0 otherwise) | +/- |
| D_IJ | 'International Journalists' respondent category (1 = IJs; 0 otherwise) | +/- |
| D_OCA | 'OCA & IF representatives' respondent category (1 = OCA & IF; 0 otherwise) | +/- |
| Psychographic Variables | ||
| RTICT | Respondent's perception of the provision of telecommunication and internet (on a Likert scale, ranging from 'very poor' (1) to `excellent' (4)) | + |
| RTTRANS | Respondent's perception of transportation provision and arrangement (in Likert scale, ranging from 'very poor' (1) to `excellent' (4)) | + |
| RTSAFSEC | Respondent's perception of the assurance of security and safety (on a Likert scale, ranging from 'very poor' (1) to `excellent' (4)) | + |
| RTINFO | Respondent's perception of the provision and access to information (on a Likert scale, ranging from 'very poor' (1) to `excellent' (4)) | + |
| RTCUL | Respondent's perception of local culture (on a Likert scale, ranging from 'very poor' (1) to `excellent' (4)) | + |
| RTCITY | Respondent's perception of the host cities (Likert scale, ranging from 'very poor' (1) to `excellent' (4)) | + |
Source : Analytical Framework For Estimation
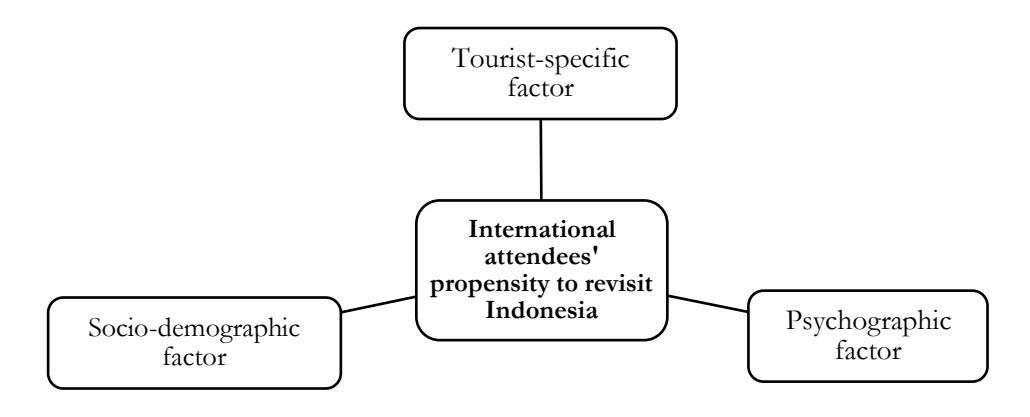
Figure 1. Analytical Framework for Estimation
4. Result and Discussion
4.1 Attendees' Evaluation of the Event
The satisfaction of international participants with the 2018 AG holds significant importance for their future inclination to revisit Indonesia. Consequently, it is imperative to consider and assess their perceptions regarding the event's execution. Figure 2 (a) shows that a considerable proportion of respondents perceive that transportation and traffic management enhancements are possible. Except for OCA & IF, some fewer respondents rate 'excellent' than 'good,' especially for ISS and IJs. OCA & IF, IAs, and COs are more satisfied with the arrangement because they can access specialized transportation arrangements for event-related engagements. By contrast, IJs' duty requires them to be mobile, while ISs have no particular arrangement provided by the organizing committee.
The survey shows that the provision of sustenance and lodging by the organizing committee generally meets the approval of respondents, notwithstanding specific criticisms about the diversity of food offerings and the dimensions of accommodations within the athlete village, as voiced by the IAs and COs (refer to Figure 2 (b)). The organizing committee had different arrangements for food and accommodation for international attendees. Officials from the OCA & IFs were accommodated in rooms at hotels close by, whereas COs and IAs primarily resided in the Athlete Village unless they were participating in events located outside urban areas. By contrast, IJs and ISs arranged food and accommodation services by themselves.
Improvements are also demanded for safety and security assurance (Figure 2 (c)). Except for OCA & IF officials and IAs, more respondents rate 'good' than 'excellent,' especially for ISS and IJs. In the future, demand for safety will be even more crucial for any country hosting the event, given the 2020 COVID-19 pandemic. The safety standard will cover both accident-related and health-related risks, particularly as global health standard requirements increase. Another improvement is demanded regarding the provision of information (via flyers, booklets, and information counters) during the event (Figure 2 (d)). More respondents rate 'good' than 'excellent' in all types of respondents. It is also worth noting that ISS and IJs experienced a higher frequency of challenges pertaining to information accessibility, with over 15% of respondents rating their access to information as either 'poor' or 'very poor.'
Telecommunication and internet services are other aspects that were complained the most among other evaluated aspects (Figure 2 (e)). Across all respondent types, there are more respondents who rate these two aspects as being 'good' rather than 'excellent.' Numerous participants drew comparisons between Indonesia's telecommunication and internet provisions to those available in their countries of origin. While the overarching trend indicates that a majority of participants are still satisfied with telecommunications and internet services throughout the event, a subset within each demographic expresses dissatisfaction. Particularly noteworthy are the responses from individuals originating from IJs, of which almost 20% rate this aspect as being 'poor' or 'very poor.'
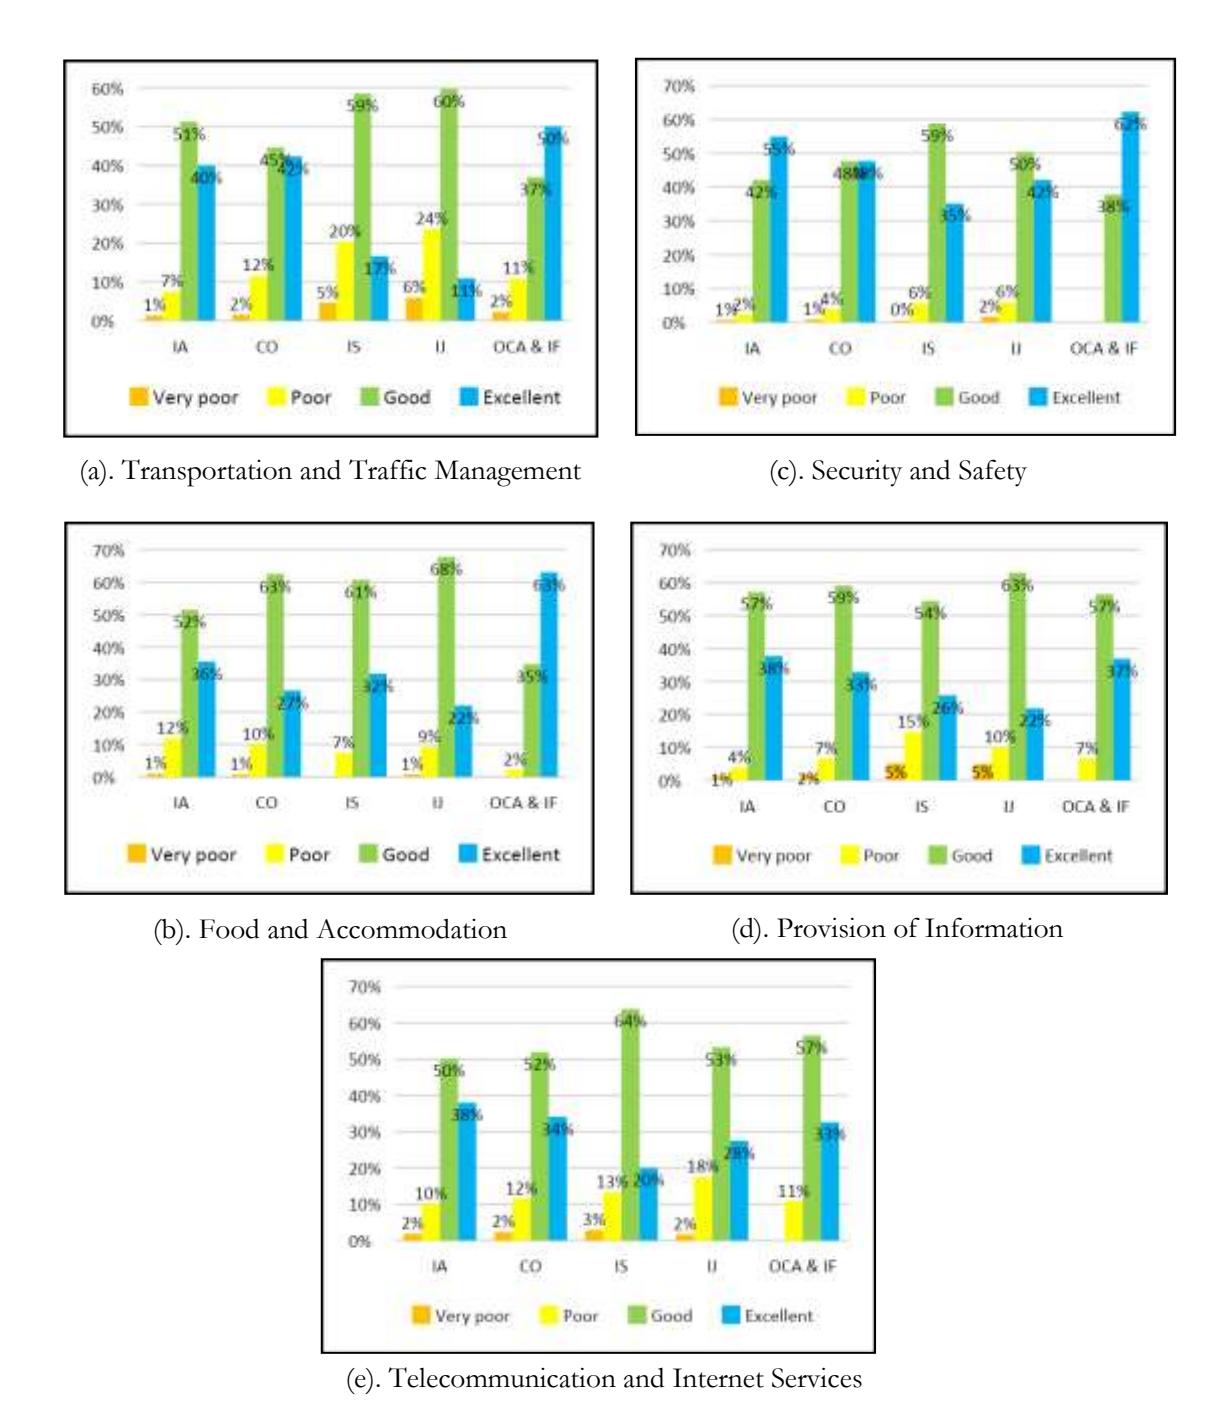
Figure 1. International Attendees' Evaluation of the 2018 Asian Games Source: Derived from the survey data (2018)
4.2 View towards Indonesia
Figure 3 (a) demonstrates that a minimum of 97% of respondents across all categories state either 'like' or 'really like' Indonesian culture (the people, hospitality, and cuisine). This suggests Indonesia effectively promotes and cultivates its cultural-related aspects' image during the event. International respondents expressed a slightly different view of Indonesian cities, encompassing public service, traffic, and aesthetics. Figure 3 (b) shows that, even though at least 73% of international respondents in each category state that they either 'like' or 'really like' Indonesian cities, a notable percentage voice dissatisfaction, with at least 10% admitting their discontent. This underscores the imperative for host cities to improve to meet international standards and ensure the comfort of international attendees. Notably, IJs exhibit the highest level of dissatisfaction (21.19%), possibly attributed to their negative assessment of transportation and traffic conditions, which are crucial for fulfilling their professional obligations.
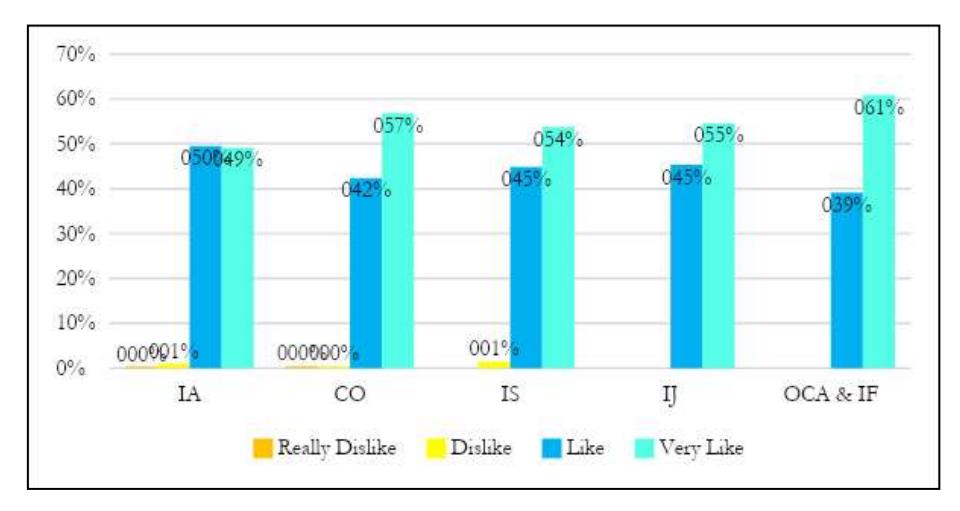
(a). Culture (People, Hospitality, Culinary)
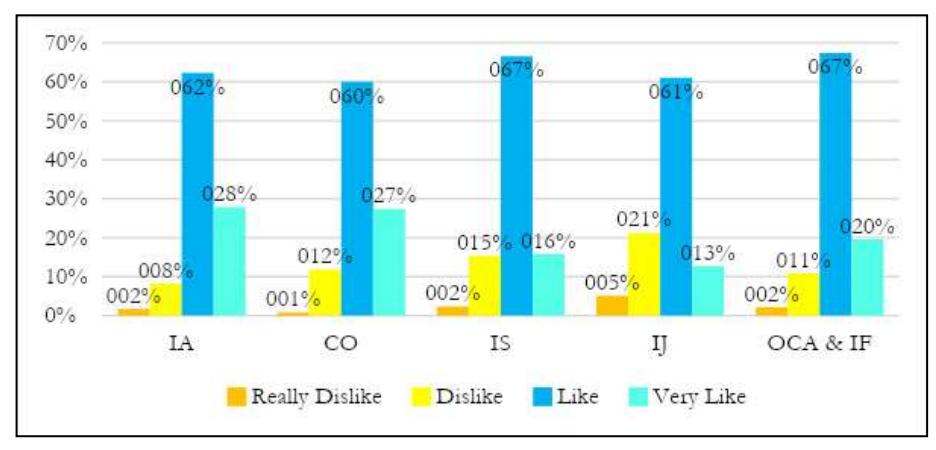
(b). Cities (Public Service, Traffic and View)
Figure 2. International Respondents' Opinion on Indonesia Source: Derived from the survey data (2018)
4.3 Intention to Revisit: Descriptive Statistics
Table 4 presents the descriptive statistics, including frequency distributions and chi-square test results, for the variables utilized in assessing the likelihood of revisiting. Overall, all respondents mainly stated that they would return or at least consider revisiting Indonesia. In each respondent category, a minority of less than 6% unambiguously indicate their intention not to return. This pattern is observed in all variables' categories, except for those aged 19-25, in which 27,5% clearly state that they do not consider revisiting Indonesia. This is invaluable information, as it may reflect the younger
generation's behavior that despite their appreciation of a place, they may prefer to explore other places (see Figure 4).
On a more detailed note, the table shows that there are differences in the tendency to revisit across categories in each variable. The likelihood of respondents intending to return to Indonesia tends to be higher among those who are male, attending the event in Jakarta (or Jawa Barat) as opposed to Palembang, originating from ASEAN countries, having no prior visitation to Indonesia, and being of older age, when compared to their counterparts in these respective categories. Furthermore, among respondents, the proportion of COs intending to revisit is notably higher compared to other respondent types. Conversely, the revisit intention does not demonstrate significant variation across different lengths of stay and prior experiences with international sports events.
Table 4. Summary Statistics of Revisit Intention
| Plan to Revisit | Chi-sq. | |||||||||
|---|---|---|---|---|---|---|---|---|---|---|
| Variables | Categories | Yes | Maybe | No | Total | Stat | ||||
| n | % | n | % | n | % | N | % | |||
| Types of | IA | 881 | 69.5% | 318 | 25.1% | 69 | 5.4% | 1268 | 100% | 20.037** |
| Respondents | CO | 207 | 79.3% | 49 | 18.8% | 5 | 1.9% | 261 | 100% | |
| IS | 168 | 77.1% | 43 | 19.7% | 7 | 3.2% | 218 | 100% | ||
| IJ | 93 | 76.9% | 23 | 19.0% | 5 | 4.1% | 121 | 100% | ||
| OCA & IF | 38 | 77.6% | 11 | 22.4% | 0 | 0.0% | 49 | 100% | ||
| Gender | Female | 444 | 68.4% | 170 | 26.2% | 35 | 5.4% | 649 | 100% | 7.800** |
| Male | 943 | 74.4% | 274 | 21.6% | 51 | 4.0% | 1268 | 100% | ||
| Location | Palembang | 351 | 69.1% | 134 | 26.4% | 23 | 4.5% | 508 | 100% | 4.105 |
| Jakarta | 1036 | 73.5% | 310 | 22.0% | 63 | 4.5% | 1409 | 100% | ||
| Country of Origin | Non ASEAN | 1066 | 71.2% | 358 | 23.9% | 74 | 4.9% | 1498 | 100% | 6.098** |
| ASEAN | 321 | 76.6% | 86 | 20.5% | 12 | 2.9% | 419 | 100% | ||
| Previous Visit to | Never | 476 | 78.3% | 119 | 19.6% | 13 | 2.1% | 608 | 100% | 20.231** |
| Indonesia | At least once | 911 | 69.6% | 325 | 24.8% | 73 | 5.6% | 1309 | 100% | * |
| Experience in Past | Never | 851 | 71.9% | 281 | 23.8% | 51 | 4.3% | 1183 | 100% | 0.753 |
| International Sporting Events | At least once | 536 | 73.0% | 163 | 30.4% | 35 | 4.8% | 734 | 100% | |
| Age Group | Below 19 | 111 | 68.1% | 40 | 24.5% | 12 | 7.4% | 163 | 100% | 30.45*** |
| 19-25 | 485 | 66.8% | 43 | 5.9% | 198 | 27.3% | 726 | 100% | ||
| 26-30 | 312 | 75.9% | 85 | 20.7% | 14 | 3.4% | 411 | 100% | ||
| 31-40 | 226 | 75.8% | 63 | 21.1% | 9 | 3.0% | 298 | 100% | ||
| 41-50 | 122 | 80.3% | 27 | 17.8% | 3 | 2.0% | 152 | 100% | ||
| 51-60 | 88 | 75.9% | 24 | 20.7% | 4 | 3.4% | 116 | 100% | ||
| Above 60 | 43 | 84.3% | 7 | 13.7% | 1 | 2.0% | 51 | 100% | ||
| Length of Stay | 0-7 days | 305 | 71.8% | 100 | 23.5% | 20 | 4.7% | 425 | 100% | 7.86** |
| 8-14 days | 646 | 72.9% | 199 | 22.5% | 41 | 4.6% | 886 | 100% | ||
| 15-21 days | 348 | 70.3% | 126 | 25.5% | 21 | 4.2% | 495 | 100% | ||
| 22-28 days | 56 | 81.2% | 9 | 13.0% | 4 | 5.8% | 69 | 100% | ||
| >28 days | 32 | 76.2% | 10 | 23.8% | 0 | 0.0% | 42 | 100% | ||
Source: Derived from the survey data (2018)
For the respondents who stated that they would not revisit Indonesia, the survey further explored their reasoning (see Figure 4). Two main reasons are observed. The primary motivation among respondents is their aspiration to explore numerous countries, with an average prevalence of 34.4% across all categories excluding OCA & IF officials. A substantial portion of responses encompass diverse rationales, averaging 36.4% across all categories, excluding OCA & IF officials. These rationales comprise constraints such as time limitations, insufficient financial resources allocated for travel, and Indonesia's humid and hot climate leading to discomfort. Furthermore, the IJs are critical about Indonesia's crowdedness (44.4%), and the COs are critical about pollution and cleanliness (20%).
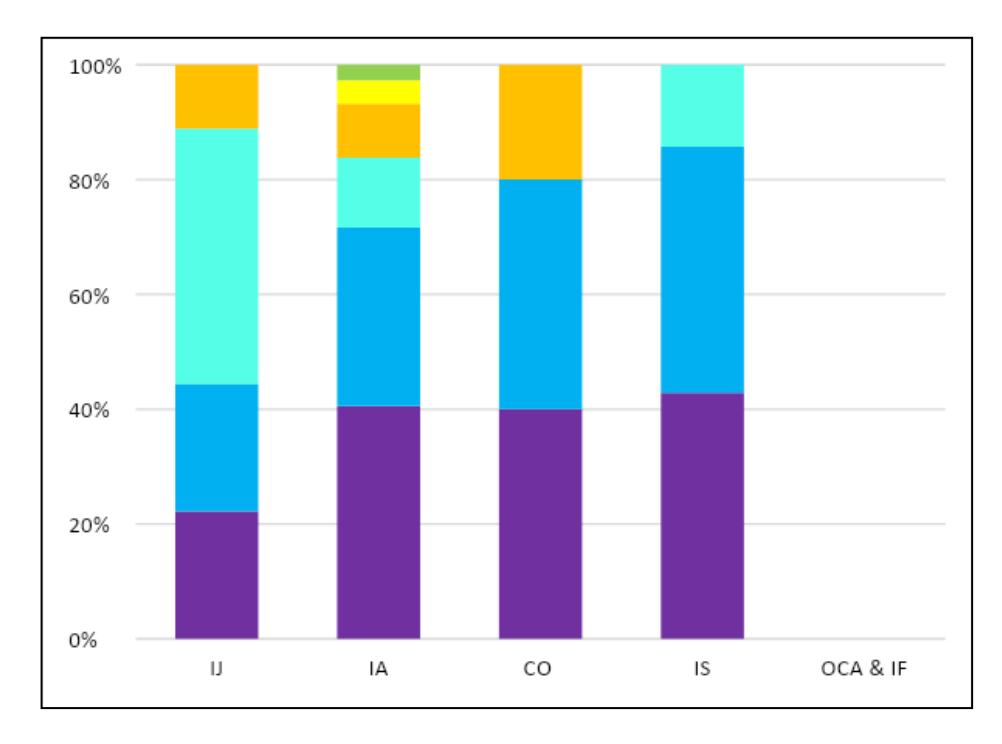
Figure 3. Reasons for not Intending to Revisit Indonesia Source: Derived from survey data (2018)
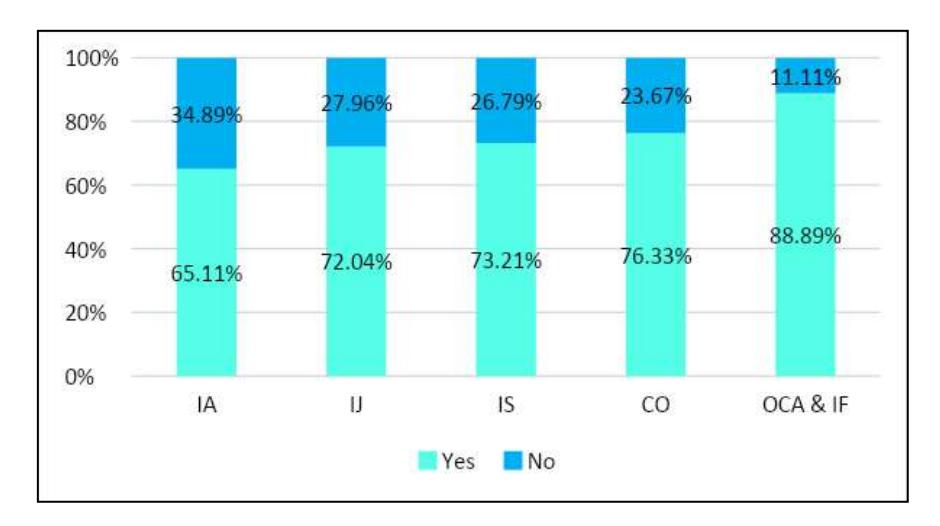
Figure 4. Intention to Revisit with Planned Destination Source: Derived from the survey data (2018)
For the respondents who declare that they plan to revisit, the survey confirms their intention by asking whether they have selected specific tourist destinations, indicating their intent's gravity (see Figure 5). Across types of respondents, OCA & IF officials exhibit the highest proportion of respondents (88.89%) who have identified their travel destinations, indicative of their proactive information-seeking behavior regarding these locales. Conversely, IAs demonstrate the lowest percentage of respondents who have designated their destinations despite expressing a desire to revisit beyond the event.
For the respondents who declare their intention to revisit, the survey further asks about their anticipated length of stay (LOS) for future visits. The finding reveals considerable variability in planned LOS among different respondent groups. ISs exhibit the lengthiest planned stays, averaging 14.24 days, whereas IJs have the shortest LOS plan, averaging 8.47 days. Nevertheless, the overall average planned LOS of the surveyed international respondents surpasses Indonesia's overall international tourist average of 8.2 days in 2018.
4.4 Propensity to Repeat Visitation: Estimation Results
Table 4 presents the results of multinomial logistic regression analyses concerning respondents' inclination to revisit Indonesia. Given that the dependent variable represents a categorical variable of revisit intention, including 1 (No), 2 (Maybe), and 3 (Yes), the 'No' answer is chosen as the base outcome for the nuanced comprehension of the estimation outcomes. This approach enables us to elucidate pathways through which the propensity of these visitors to revisit can be enhanced. Analysis of the regression outcomes reveals that several factors, such as prior experiences visiting Indonesia and satisfaction levels with transportation arrangements, telecommunications, cities, and culture, influence respondents' plans to revisit.
Previous visitation to Indonesia significantly decreases the respondents' propensity to consider or to revisit. This finding is at odds with those of other studies, such as Huang and Hsu (2009), Gomez-Jacinto et al. (1999), and Sönmez and Graefe (1998) that reported past experiences, typically measured by several past visitations and their corresponding satisfaction, are positively associated with intention to revisit. However, our finding aligns with intuition, as individuals who have previously traveled to Indonesia may exhibit a reduced preference for further experiences within the country, thus expressing a desire to explore alternative destinations and novel environments. Our finding supports Anastasopoulos (1992), who observed a negative impact of the travel experience to Turkey on Greek tourists' revisit attitude. Furthermore, given that the risk ratio for the outcome 'Yes' is lower than for the outcome 'Maybe' (albeit with a lower level of statistical significance for the outcome 'Maybe'), this suggests that prior experiences of visiting Indonesia tend to comparatively heighten respondents' relative risk of abstaining from future revisits in contrast to holding ambivalent sentiments towards engaging in repeated visits.
The favorable evaluation by respondents regarding transportation arrangements and telecommunication networks is revealed to substantially augment their inclination to engage in repeated visits to Indonesia. In our case, participants perceive transportation arrangements as crucial, especially for individuals with demanding schedules, such as IAs, COs, and IJs. Providing convenient transportation arrangements facilitates their adherence to these schedules and punctuality. This finding reconfirms the importance of transportation in the tourism sector, which was emphasized in previous studies (see, for example, Mammadov, 2012; Sorupia, 2005). The result shows that heightened satisfaction among respondents with the provision of a telecommunication network notably amplifies the likelihood of repeated future visitations. Within the broader framework of advancing communications infrastructure globally and escalating reliance on these networks, respondents are likely to increasingly perceive telecommunications, particularly internet connectivity, as vital during their vacations in Indonesia. This finding confirms Bethapudi (2013), who reported the crucial role of ICT in promoting tourism products, thereby increasing the tourists' satisfaction with the host destination.
Table 4. Multinomial Logistic Regression Results on Propensity to Revisit
| Number of Observation | 1684 |
|---|---|
| Log-likelihood | 1082.76 |
| LR chi2(34) | 178.99 |
| Prob > chi2 | 0.000 |
| Pseudo R2 | 0.0763 |
| Base Outcome | Maybe Will Revisit vs No (Will Not Revisit) | Yes (Will Revisit) vs No (Will Not Revisit) | ||||||
|---|---|---|---|---|---|---|---|---|
| Revisit | RRR | Std.Err | z | P>|z| | RRR | Std.Err | z | P>|z| |
| Male | 1.104 | 0.304 | 0.36 | 0.719 | 1.229 | 0.324 | 0.78 | 0.434 |
| Age | 0.993 | 0.017 | -0.44 | 0.658 | 1.002 | 0.016 | 0.1 | 0.922 |
| ASEAN | 1.215 | 0.450 | 0.53 | 0.599 | 1.538 | 0.548 | 1.21 | 0.227 |
| LOS | 1.015 | 0.022 | 0.69 | 0.488 | 1.011 | 0.021 | 0.54 | 0.59 |
| Jakarta | 0.782 | 0.234 | -0.82 | 0.412 | 1.029 | 0.297 | 0.1 | 0.921 |
| Experindo | 0.533* | 0.193 | -1.74 | 0.083 | 0.427** | 0.149 | -2.43 | 0.015 |
| Experevent | 0.898 | 0.244 | -0.4 | 0.693 | 0.906 | 0.236 | -0.38 | 0.706 |
| Rttrans | 1.113 | 0.227 | 0.53 | 0.599 | 1.477** | 0.288 | 2 | 0.046 |
| Rtsafsec | 0.962 | 0.234 | -0.16 | 0.873 | 1.198 | 0.279 | 0.78 | 0.437 |
| Rtinfo | 0.863 | 0.205 | -0.62 | 0.535 | 0.798 | 0.181 | -0.99 | 0.32 |
| Rtict | 1.231 | 0.242 | 1.06 | 0.291 | 1.548** | 0.291 | 2.32 | 0.02 |
| Rtcul | 0.953 | 0.245 | -0.19 | 0.852 | 1.976*** | 0.487 | 2.76 | 0.006 |
| Rtcity | 1.777*** | 0.378 | 2.7 | 0.007 | 2.004*** | 0.403 | 3.46 | 0.001 |
| d_CO | 1.877 | 1.090 | 1.09 | 0.278 | 2.336 | 1.307 | 1.52 | 0.13 |
| d_IS | 1.260 | 0.629 | 0.46 | 0.644 | 2.062 | 0.980 | 1.52 | 0.128 |
| d_IJ | 1.000 | 0.585 | 0 | 1.000 | 1.618 | 0.888 | 0.88 | 0.381 |
| _cons | 1.410 | 1.724 | 0.28 | 0.778 | 0.019*** | 0.023 | -3.31 | 0.001 |
Note: Dependent variable: Categorical values, where 1 = Will not revisit, 2 = Probably, 3 = Yes (will revisit). (*), (**) and (***) represent 10%, 5% and 1% significance levels, respectively.
OCA respondents were excluded from the regression analysis because all of them said that they plan to revisit Indonesia (there was no variation in their responses).
Source: Derived from the survey data (2018)
Respondents' favorable evaluation of local culture and people is revealed to augment their inclination toward future repeat visits notably. Whenever respondents appreciate the local cultures, these might increase their enjoyment of the visitation experience, thereby fostering a predisposition for revisitation or exploration of alternative locales within Indonesia. This finding supports Yusuf (2017), who proposed the role of sports tourism in serving as a platform for the exhibition of local cultures, consequently bolstering indigenous entrepreneurial endeavors. As these visitors make repeated visitations in the future, they may also create reciprocal relationships over the extended duration.
The favorable perception of Indonesian urban centers significantly influences visitors' inclination to undertake subsequent visits, exerting the most pronounced impact. All other factors are constant; an elevation in respondents' appraisal of Indonesian cities enhances the probability of their future revisit to Indonesia by a factor of 2.01. However, to put it differently, dissatisfaction with city public service, traffic, and sceneries decreases respondent's likelihood of revisiting. Such a finding is consistent with that of Beerli and Martin (2004), who state that public infrastructures and sceneries are among the attributes determining the perceived destination image, leading to higher satisfaction and the likelihood of return to the host destination.
In addition to the variables above, the results suggest that the respondents' demographic attributes, such as international status, gender, age, and origin country (whether ASEAN or non-ASEAN), do not significantly correlate with their inclination to revisit. Other variables, such as duration of stay, geographical location (either Jakarta or Palembang), perception regarding safety-security, and adequacy of information provision, do not possess any statistically meaningful association to revisit Indonesia in subsequent instances.
5. Conclusions
The 2018 AG garnered significant international participation and tourist interest, attracting widespread global media coverage. This event was anticipated to have short-term and long-term effects on Indonesia's tourism industry, particularly sports tourism. In the short term, the influx of international attendees increased spending on tourist attractions and other amenities during their stay in Indonesia. In the medium long term, the event may enhance Indonesia's global positive image, potentially attracting more international visitors. Further, the AG attendees' positive experiences influenced their perceptions of Indonesia, impacting their likelihood of revisiting the country.
The survey finds that most international respondents regarded the organization of the 2018 AG as successful, with feedback for improvements spanning various aspects such as accommodation and food, telecommunications and internet access, transportation arrangements, information availability, safety and security, Indonesian culture, and host cities. Pleasant experiences contributed to a favorable shift in respondents' perceptions of Indonesia, potentially influencing their inclination to revisit the country. The statistical analysis revealed that aspects of event operations, such as information provision and transportation arrangements, significantly influenced respondents' propensity to return, alongside their positive views of Indonesian culture and cities. Additionally, of the control variables, previous visits to Indonesia were found to have a significant, albeit negative, effect on revisitation, suggesting that increased familiarity with the country may lessen the desire to return for traveling purposes on a long-stay plan.
To summarize, the 2018 AG may increase Indonesia's international tourists in the long run, aligning with a previous study by Shonk (2006) and Vegara-Ferri et al. (2018), who reported that attendees' satisfaction may correlated with repeated visitation. However, policymakers and the organizing committee should address the dissatisfaction observed in the survey by continually improving the provision of information, public transportation services, telecommunication and internet, and security and safety, including health safety and standards following the 2020 COVID-19 pandemic. The potential long-term benefits of hosting sports events for the tourism sectors and the economy can be materialized and maximized by addressing those issues. Considering the critical findings of the study, similar studies need to be conducted for future sports events. Such a study aims to help the country create better externalities of the event on the overall economy. Future studies can investigate the importance of domestic visitors in stimulating economic activity and variations of revisit intention of athletes and officials across sports disciplines.
Acknowledgment
This study is a part of the 2018 Asian Games Economic Impact Analysis Project by the National Development Planning Agency/Ministry of National Development Planning (Bappenas), the Republic of Indonesia. We thank Australia's Department of Foreign Affairs and Trade for their support. We also thank Devina Anindita, Hamdan Bintara, Uka Wikarya, Nurindah W. Hastuti, Ainul Huda, Devianto, Moslem Afrizal, Wahyu Pramono, Nalindro Nusantoro, Srie Mustika Rahayu and the survey team for their contribution in data collection and processing.
References
- Anastasopoulos, P. G. (1992). Tourism and attitude change: Greek tourists visiting Turkey. Annals of tourism research, 19(4), 629-642.
- Baade, R. A., & Matheson, V. A. (2004). The quest for the Cup: assessing the economic impact of the World Cup. Regional studies, 38(4), 343-354.
- Barajas, A., Coates, D., & Sanchez-Fernandez, P. (2016). Beyond retrospective assessment. Sports event economic impact studies as a management tool for informing event organization. European Research on Management and Business Economics, 22(3), 124-130.
- Beerli, A., & Martin, J. D. (2004). Factors influencing destination image. Annals of tourism research, 31(3), 657-681.
- Bethapudi, A. (2013). The role of ICT in tourism industry. Journal of applied economics and business, 1(4), 67-79.
- Brown, G., Smith, A., & Assaker, G. (2016). Revisiting the host city: An empirical examination of sport involvement, place attachment, event satisfaction and spectator intentions at the London Olympics. Tourism management, 55, 160-172.
- Case, R., Dey, T., Hobbs, S., Hoolachan, J., & Wilcox, A. (2010). An examination of sporting event direct-spending patterns at three competitive levelsTaylor & Francis. Symposium conducted at the meeting of the Journal of Convention & Event Tourism
- Case, R., Dey, T., Lu, J., Phang, J., & Schwanz, A. (2013). Participant spending at sporting events: An examination of survey methodologiesTaylor & Francis. Symposium conducted at the meeting of the Journal of Convention & Event Tourism
- Chen, N., & Funk, D. C. (2010). Exploring destination image, experience and revisit intention: A comparison of sport and non-sport tourist perceptions. Journal of Sport Tourism, 15(3), 239-259.
- Chogahara, M., & Yamaguchi, Y. (1998). Resocialization and continuity of involvement in physical activity among elderly Japanese. International review for the sociology of sport, 33(3), 277-289.
- Davis, J. A. (2012). The Olympic Games effect: How sports marketing builds strong brands: John Wiley & Sons.
- Delpy, L. (1998). An overview of sport tourism: Building towards a dimensional framework. Journal of vacation marketing, 4(1), 23-38.
- Dongfeng, L. (2013). Major sports events, destination image and intention to revisit from the foreign tourist's perspective. International Journal of Sports Marketing & Sponsorship, 14(3).
- Fourie, J., & Santana-Gallego, M. (2011). The impact of mega-sport events on tourist arrivals. Tourism management, 32(6), 1364-1370.
- Fullerton, S., & Merz, G. R. (2008). The four domains of sports marketing: A conceptual framework. Sport Marketing Quarterly, 17(2).
- Gammon, S., & Ramshaw, G. (2013). Heritage, sport and tourism: Sporting pasts–tourist futures: Routledge.
- Gomez-Jacinto, L., Martin-Garcia, J. S., & Bertiche-Haud'Huyze, C. (1999). A model of tourism experience and attitude change. Annals of Tourism Research, 26(4), 1024-1027.
- Haddad, E. A., & Haddad, P. R. (2010). Major sport events and regional development: the case of the Rio de Janeiro 2016 Olympic Games. Regional Science Policy & Practice, 2(1), 79-95.
- Hallmann, K., & Breuer, C. (2010). Image fit between sport events and their hosting destinations from an active sport tourist perspective and its impact on future behaviour. Journal of Sport Tourism, 15(3), 215-237.
- Hallmann, K., Zehrer, A., & Müller, S. (2015). Perceived destination image: An image model for a winter sports destination and its effect on intention to revisit. Journal of Travel Research, 54(1), 94-106.
- Hidayat, M. F., & Maula, B. F. (2019). Buku I: Menakar dampak ekonomi dan sosial penyelenggaraan asian games 2018: Analisis Dampak Ekonomi. Jakarta: Bappenas.
- Higham, J. (2018). Sport tourism development: Channel view publications.
- Hritz, N., & Ross, C. (2010). The perceived impacts of sport tourism: An urban host community perspective. Journal of Sport Management, 24(2), 119-138.
- Huang, S., & Hsu, C. H. (2009). Effects of travel motivation, past experience, perceived constraint, and attitude on revisit intention. Journal of travel research, 48(1), 29-44.
- Kaplanidou, K., & Vogt, C. (2007). The interrelationship between sport event and destination image and sport tourists' behaviours. Journal of Sport Tourism, 12(3-4), 183-206.
- Kasimati, E. (2003). Economic aspects and the Summer Olympics: a review of related research. International journal of tourism research, 5(6), 433-444.
- KPMG. (2018). The Economic Impact of Major Sports Events: Analysis of Hong Kong's 2017 major sports event calendar and outlook for the future: KPMG. Retrieved from https://assets.kpmg/content/dam/kpmg/cn/pdf/en/2018/09/the-economic-impact-ofmajor-sports-events.pdf
- Kurtzman, J., & Zauhar, J. (2005). Sports tourism consumer motivation. Journal of Sport Tourism, 10(1), 21-31.
- Lee, C.-K., Mjelde, J. W., & Kwon, Y. J. (2017). Estimating the economic impact of a mega-event on host and neighboring regions. Leisure Studies, 36(1), 138-152.
- Mammadov, R. (2012). The importance of transportation in tourism sector Symposium conducted at the meeting of the 7th Silk Road International Conference "Challenges and opportunities of sustainable economic development in Eurasian countries
- Maula, B. F., Rahmania, D., Martak, Y. F., Annazah, N. S., Muthia, A. C., Robiani, B., . . . Aulia, N. (2019). Buku III: Menakar dampak ekonomi dan sosial penyelenggaraan asian games 2018: Studi Kasus Dampak terhadap UMKM. Jakarta: Bappenas.
- Minister of National Development Planning. (2019). Refleksi satu tahun pasca Asian Games 2018 dan rencana peningkatan prestasi olahraga indonesia. Jakarta.
- Müller, A., BÍRÓ, M., Ráthonyi, Ó., Ráthonyi, G., Széles, K. G., Boda, E., . . . Andras, A. (2016). Economic impacts of sports events. Studia Universitatis Babes-Bolyai Educatio Artis Gymnasticae, 61(4), 85-95.
- OCA. (2019). 18th Asian Games Jakarta-Palembang 2018. Retrieved 2020,
- Orbis Research. (2018). Sports tourism market estimated to be worth US$800 billion globally according to new research report. Retrieved April 10, 2020,from https://www.whatech.com/marketresearch/industrial/archive/436642-sports-tourism-market-estimated-to-be-worth-us-800 billion-globally-according-to-new-research-report.
- Osti, L., Disegna, M., & Brida, J. G. (2012). Repeat visits and intentions to revisit a sporting event and its nearby destinations. Journal of Vacation Marketing, 18(1), 31-42.
- Palrão, T., & Filipe, J. A. (2017). Sport events tourism: an approach to the Portuguese case. Sport events tourism: an approach to the Portuguese case(2), 1320-1335.
- Revindo, M. D., Siregar, C. H., Widyasanti, A. A., Anindita, D., Hastuti, N. W., Hambali, S., . . . Research, S. (2019). Spending of sports event participants and tourists: Evidence from the 2018 Asian Games.
- Revindo, M. D., Widyasanti, A. A., Siregar, C. H., Anindita, D., Hastuti, N. W., & Hambali, S. (2019). Long-Term Effect of Mega Sports Event on Host Country's Tourism: Evidence From the Jakarta-Palembang 2018 Asian Games. Institute for Economic and Social Research.
- Revindo, M. D., Widyasanti, A. A., Nusantoro, N., & Siregar, C. H. (2023). Sports Event Satisfaction and Word-of-Mouth Intention: Evidence from the 2018 Asian Games International Participants and Spectators.
- Ritchie, B. W., & Adair, D. (2004). Sport tourism: Interrelationships, impacts and issues (Vol. 14): Channel View Publications.
- Roche, S., Spake, D. F., & Joseph, M. (2013). A model of sporting event tourism as economic development. Sport, Business and Management: An International Journal.
- Sato, M., Jordan, J. S., Kaplanidou, K., & Funk, D. C. (2014). Determinants of tourists' expenditure at mass participant sport events: a five-year analysis. Current Issues in Tourism, 17(9), 763-771.
- Schwark, J. (2007). Sport tourism: introduction and overview. European Journal for Sport and Society, 4(2), 117-132.
- Shonk, D. J. (2006). Perceptions of service quality, satisfaction, and the intent to return among tourists attending a sporting event. The Ohio State University.
- Solberg, H. A., & Preuss, H. (2007). Major sport events and long-term tourism impacts. Journal of Sport Management, 21(2), 213-234.
- Sönmez, S. F., & Graefe, A. R. (1998). Determining future travel behavior from past travel experience and perceptions of risk and safety. Journal of travel research, 37(2), 171-177.
- Sorupia, E. (2005). Rethinking the role of transportation in tourismCiteseer. Symposium conducted at the meeting of the Proceedings of the Eastern Asia Society for Transportation Studies
- Standeven, J., & Knop, P. (1999). Sport Tourism, Human Kinetics. USA Human Kinetics, USA.
- Technavio Research. (2020). Sports Tourism Market 2019-2023. Retrieved April 10, 2020,from https://www.whatech.com/market-research/industrial/archive/436642-sports-tourismmarket-estimated-to-be-worth-us-800-billion-globally-according-to-new-research-report.
- Vegara-Ferri, J. M., Saura, E. M., López-Gullón, J. M., Sánchez, G. F. L., & Angosto, S. (2018). The touristic impact of a sporting event attending to the future intentions of the participants. Journal of Physical Education and Sport, 18, 1356-1362.
- Weed, M., & Bull, C. (2004). Sports Tourism: Participants. Policy and Providers. Oxford: Elsevier.
- Wicker, P., Hallmann, K., & Zhang, J. J. (2012). What is influencing consumer expenditure and intention to revisit? An investigation of marathon events. Journal of Sport Tourism, 17(3), 165- 182.
- Widyasanti, A. A., Lestari, T. K., Esko, S., Hidayat, M. F., Yudhistira, M. H., Kusumaatmadja, R., . . . Rahmania, D. (2019). Buku IV: Menakar dampak ekonomi dan sosial penyelenggaraan asian games 2018: Pemanfaatan Big Data. Jakarta: Bappenas.
- Wikarya, U., Widyasanti, A. A., Revindo, M. D., Siregar, C. H., & Dewi, C. E. (2022). Impact of international sports event on local businesses: Insight from the stallholders and official partners of the 2018 Asian Games. JEJAK: Jurnal Ekonomi dan Kebijakan, 15(2), 336-353.
- Yusuf, T. (2017). Impact of Sport Tourism on the Host Community: A Case Study of Nigerian Universities' Games. Journal of Tourism Research, 104.
- Zhang, Y., Lee, D., Judge, L. W., & Johnson, J. E. (2014). The relationship among service quality, satisfaction, and future attendance intention: The case of Shanghai ATP Masters 1000. International Journal of Sports Science, 4(2), 50-59.