
1. Introduction
Tourism plays a crucial role in the economic development of a country (Cárdenas-García & Sánchez-Rivero, 2015; Khan et al., 2020), including Indonesia. In the era of digitalization and information technology advancement, the internet has emerged as a key platform influencing the mindset and behavior of individuals, particularly among Indonesian netizens (Syahputra, & Hafiar, 2019). Netizens, actively engaging in the online world, possess significant potential in shaping opinions, travel trends, and preferences (Park et al., 2009; Chen 2022).
In the context of tourism, netizens play a substantial role (Germann Molz, 2005) in determining popular travel destinations, defining travel trends, and sharing their experiences online (Zhang et al., 2022; Prisgunanto, 2020). Understanding the in-depth preferences of netizens towards tourism becomes crucial for the development and marketing of travel destinations.
This research is particularly significant in light of global pandemics such as COVID-19, which has altered travel paradigms and habits. Changes in consumer behavior and tourism preferences are highly relevant in responding to shifts in social and economic environments. The study aims to identify the primary factors influencing Indonesian netizens' choices of travel destinations, how they obtain information about these destinations, and the extent to which netizens influence the overall perception of a travel destination among the wider community.
Furthermore, this research acknowledges the insights of previous researchers. According to Prisgunanto (2020), the internet and social media increasingly influence travel decisions, with netizens not only seeking information but also sharing experiences, recommending places, and providing reviews that can impact a destination's image. Wang et al. (2021) highlights netizens' trust in fellow internet users' reviews and recommendations over promotional efforts by tourism agencies or travel companies. Faraj (2022) emphasize the importance of understanding netizens' preferences in optimizing tourism destination marketing strategies, utilizing social media data analysis to gain valuable insights into consumer behavior and market trends.
By integrating these perspectives from previous researchers, the background of the study "Preferences of Indonesian Netizens Towards Tourism" becomes more comprehensive and structured, providing a robust foundation for further investigation. this study also wanted to test whether preference attributes were also influenced by demographic variables or not? Given that individual differences affect overall preferences (Regan & Horn, 2005).
2. Theoretical Foundation
Tourist behavior is the result of complex interactions between internal factors such as motivation, attitudes, beliefs and external factors including economic conditions, health and safety environments, and sociocultural influences (Andrades et al., 2015; Chebli & Said, 2020). According to Chebli & Said (2020), tourist behavior emerges through the processing of environmental stimuli, which are assessed based on personal preferences, values, and internal characteristics. This evaluation process is further influenced by external circumstances that shape perception and ultimately guide decisions.
An individual's travel decision-making is thus embedded within a broader life context, influenced by surrounding social networks, personal beliefs, cultural values, religious background, and financial capacity (Hassani & Moghavvemi, 2019; Hidayah, 2019, 2021). Tourists often compare available options and select destinations based on a set of attributes that align with their preferences and perceived benefits (Decrop, 2000; Amir et al., 2014; Gupta et al., 2019). These preferences, when shaped by positive attitudes, can lead to strong behavioral intentions (Hellier et al., 2003; Overby & Lee, 2006; Seo et al., 2017).
Tourist preferences themselves are multi-dimensional and have been widely studied across various travel attributes, such as choice of facilities and services (Moschis & Ünal, 2008; Kim et al., 2010), accommodation types (Chan & Baum, 2007; Lieux et al., 1994), modes of travel arrangement (Wong & Kwong, 2004), technology needs (Cai et al., 2004), preferred activities (Agrusa & Kim, 2008; Littrell et al., 2004), and experience design (Tran & Ralston, 2006). The destination itself also plays a pivotal role in preference formation (Amir et al., 2014; Sharma et al., 2014).
In times of crisis, such as the Covid-19 pandemic, significant shifts in tourist behavior have been documented. Tourists tend to avoid group travel and crowded spaces, delay travel plans until safety is assured, and become more aware of the importance of hygiene and health standards in destination
environments (Chebli & Said, 2020). The need for travel insurance, open environments, and reduced physical contact has emerged as dominant preferences. Travel businesses are urged to adopt improved hygiene practices to rebuild consumer trust and confidence.
Safety, as a basic psychological need (Maslow, 1943), becomes central in the consumer's evaluation process. Tourists tend to adopt risk-minimizing strategies in their decision-making, such as avoiding air travel, opting for car-based trips (Fall & Massey, 2005), favoring last-minute bookings (Hystad & Keller, 2008), and prioritizing nature-based or ecotourism experiences (Higgins-Desbiolles, 2020). This growing orientation toward low-risk and flexible tourism reveals a deep integration between perceived environmental risks and behavioral adaptation.
Building on this foundation, the conceptual model of tourist preferences in contemporary literature incorporates both destination product attributes (e.g., accommodation, services, transportation, activities, and experiences) and contextual variables such as crisis-related concerns (e.g., travel distance, group size, safety, and health measures) (Chen et al., 2020; Chebli & Said, 2020). These models highlight that, especially during uncertain periods, preferences are not formed in isolation but rather through a dynamic negotiation between personal dispositions and external risks
Therefore, a comprehensive understanding of tourist behavior must consider both the stable aspects of preference (e.g., cultural and psychological influences) and the situational variables that emerge in response to crises or disruptions. This dual-layered framework is essential to guide destination managers and tourism stakeholders in developing adaptive strategies that remain responsive to evolving consumer needs.
3. Methods
3.1 Data collection and sample
This study employed a survey design, distributing online questionnaires through social media platforms such as personal websites, Facebook, WhatsApp, and Instagram to Indonesian netizens from June 23 to November 30, 2020. A convenience sampling method (non-probability sampling) was employed. Through various filters and screening questions, a sample of 1,008 respondents was obtained. This provided a sufficient overview of the population whilst accommodating a limited research budget. The questionnaire's temporal framework only refers to conditions after the end of COVID-19, not to conditions before and during COVID-19.
The survey contained 16 questions, 4 questions for the respondent's demographic profile (age, gender, origin, income) and 12 questions for the preferences of Indonesian netizens toward tourism. Before testing the validity and reliability, the research instrument was first assessed by two experts, to ensure that the items designed for the questionnaire were fit for use. Furthermore, the results of the assessment of the two experts were tested using Kappa, the results of which are presented in Table 1.
| Symmetric Measures | ||||||||
|---|---|---|---|---|---|---|---|---|
| Asymptotic | Approximate | |||||||
| Value | Standard Errora | Approximate Tb | Significance | |||||
| Measure of Agreement | Kappa | .636 | .328 | 2.733 | .006 | |||
| N of Valid Cases | 16 | |||||||
Table 1. Inter Rater Test Results
Source: Own data processing (2023)
From the table above, it can be seen that the Kappa Coefficient Value is 0.636 with an Approximate Significance of 0.005 or P <0.05. This means that the expert's assessment of this research instrument is a substantial agreement category (Landis & Koch, 1977), so it is feasible to proceed to the validity and reliability testing process. Because the research data is in the form of a nominal scale, the validity test is carried out using the Kendall Tau-b test, the results of which are presented in Table 2 below.
Table 2. Results of Testing the Validity of Research Instruments
| No | Questionnaire Items for Preference Attributes | Kendall's Tau-b Correlation Coefficient | Sig. (2- tailed) |
|---|---|---|---|
| 1 | Planned resumption of travel | .154** | 0.000 |
| 2 | Types of destination | .272** | 0.000 |
| 3 | Source of information | .375** | 0.000 |
| 4 | Tour planning | .270** | 0.000 |
| 5 | Planned group travel | .228** | 0.000 |
| 6 | Booking | 0.048 | 0.063 |
| 7 | Travel distance/coverage | .161** | 0.000 |
| 8 | Main attractions | .129** | 0.000 |
| 9 | Main activities | .472** | 0.000 |
| 10 | Length of stay | .159** | 0.000 |
| 11 | Transportation | .296** | 0.000 |
| 12 | Accommodation | .383** | 0.000 |
**. Correlation is significant at the 0.01 level (2-tailed).
Source: Own data processing (2023)
Table 3. Research Instrument Reliability Testing Results
| Reliability Statistics | ||||||
|---|---|---|---|---|---|---|
| Cronbach's Alpha | Cronbach's Alpha Based on Standardized Items | N of Items | ||||
| .625 | .586 | 12 | ||||
Source: Own data processing (2023)
From Table 3 it can be seen that of the 12 questionnaire items tested, there were 11 questionnaire items that were declared valid according to the Kendal Tau-b test, and only one item was declared invalid. Given the relatively limited number of items, this invalid item is still used in this study, by providing treatment in the form of redaction so that it is not confusing and easier to understand by respondents. Meanwhile, the instrument reliability testing used Cronbach's Alpha, the results of a. Not assuming the null hypothesis.
b. Using the asymptotic standard error assuming the null hypothesis.
*. Correlation is significant at the 0.05 level (2-tailed).
which are presented in Table 4. The test results show the Cronbach Alpha value of 0.625 which means that this instrument has a fairly good reliability (Arikunto 2008).
3.2 Measurement scale
The number of questionnaire items used in the study with a total of 16 questions, 4 questions for the demographic profile of the respondents (age, gender, origin, income) were designed on a nominal scale. Meanwhile, 12 questions for Indonesian netizens toward tourism were designed on an ordinal scale, because respondents were asked to rank the choices provided.
The 12 parameters used in this study are based on a synthesis of various previous studies regarding tourist preferences that can influence the decision to visit a tourism destination, both during times of crisis and normal times. For parameters Planned Resumption of Travel, Planned Group Travel, and Travel Distance/Coverage, from Chebli & Said (2020) and Chen et al. (2020). For the Types of Destination, Main Attractions, and Main Activities indicators, parameters were used from Felix et al. (2020), Littrell et al. (2004), and Tran & Ralston (2006). For the Source of Information indicator, Hidayah (2021) and Wong & Kwong (2004). For the Booking, Transportation, and Accommodation indicators, they were from Chan & Baum (2007), Lieux et al. (1994), Fall & Massey (2005), Moschis & Ünal (2008). For Length of Stay, they were from Huang & Min (2002) and Hystad & Keller (2008).
3.3 Data analysis
The preferences of Indonesian netizens toward tourism were analysed using the Relevant Sample Test, namely Kendall Concordance. Meanwhile, to test the relationship between demographic variables and travel preferences for Indonesian netizen, the Friedman Test and Kendall's W statistical tests were used. Test processing and data analysis in this study using the IBM SPSS.24 software tools.
The age ranges used for the analysis are: < 25 years (Gen-Z); 26-40 years (Gen-Y/Millennials); 41- 60 years (Gen-X); and > 61 years (Baby Boomers). The Chi-square (χ^2) value is calculated by comparing the observed frequency (Oi) with the expected frequency (Ei), if done manually using the formula:
\[\sum_{i=1}^k \frac{(O_i - E_i)^2}{E_i}\]
4. Finding & Discussion
4.1 Preferences of Indonesian toward tourism
To ensure that the general description of the preferences of Indonesian netizen for traveling presented in figure 1 is reliable, it is necessary to conduct statistical testing. The following Table 4 presents the test results regarding the preferences of Indonesian netizen for traveling, which is an average ranking of the various choices regarding the various questions above according to the Friedman Test and Kendall'W Test.
Table 4. Results of Statistical Testing on Preferences of Indonesian Netizen Towards Tourism
| _ | \(\overline{\mathbf{F}}\) | Friedman Test | Kendall's W Test | ||||||
|---|---|---|---|---|---|---|---|---|---|
| Questions | Option Answere | Asymp . Sig. | Mean Rank | Kendal l's W | Asymp . Sig. | ||||
| (1) | (2) | (3) | (4) | (5) | (6) | (7) | (8) | ||
| 1. | Types of | - Natural tourism | 1.82 | \ / | ( ) | 1.82 | ( ) | ( ) | |
| tourist | - Culture tour | 3.70 | 3.70 | ||||||
| destinations | – Urban / Urban Tourism | 4.17 | 4.17 | ||||||
| that will be | - Country Tourism | 4.00 | 4.00 | ||||||
| visited? |
| 4.80 | 2422.0 | 0.000 | 4.80 | 0.244 | 0.0000 | ||
| - Religious / Religious Tourism | 5.32 | 2422.0 | 0.000 | 5.32 | 0.344 | 0.0000 | |||
| Educational / Educational Tourism | 5.65 | 5.65 | |||||||
| - Business | 6.54 | 6.54 | |||||||
| 2. | What sources | - Personal experience | 2.58 | 2.58 | |||||
| of information |
| 2.66 | 2.66 | ||||||
| do you most refer to when |
| 3.68 | 3.68 | ||||||
| traveling? | - Visitor Guide | 5.84 | 5.84 | ||||||
| - News / Magazines / | 5.88 | 5.88 | |||||||
| Editorial | 5013.0 | 0.000 | 0.497 | 0.0000 | |||||
| 6.16 | 001010 | 0.000 | 6.16 | 0.127 | 0.0000 | |||
| 7.42 | 7.42 | |||||||
| 8.58 | 8.58 | |||||||
| 5.43 | 5.43 | |||||||
| 8.26 | 8.26 | |||||||
| - Travel Agents / Agencies | 9.51 | 9.51 | |||||||
| 3. | How do you | Buy a tour package | 1.76 | 1.76 | |||||
| plan your trip? |
| 1.24 | 273.7 | 0.000 | 1.24 | 0.272 | 0.0000 | ||
| 4. | With whom | - Alone | 2.00 | 2.00 | |||||
| will you be |
| 1.33 | 912.1 | 0.0000 | 1.33 | 0.452 | 0.0000 | ||
| traveling? |
| 2.67 | 712.1 | 0.0000 | 2.67 | 0.132 | 0.0000 | ||
| 5. | What kind of | - Online ordering | 1.25 | 1.25 | |||||
| ٥. | booking will | 9 | 2.19 | 2.19 | |||||
| be made? | - Manual ordering (offline) | 2.56 | 921.7 | 0.0000 | 2.56 | 0.457 | 0.0000 | ||
| 2.30 | 2.30 | |||||||
| 6. | Where are | Within the city / district | 1.80 | 1.80 | |||||
| 0. | your priority |
| 1.96 | 1.96 | |||||
| destinations? | province) | 1.70 | 1.70 | ||||||
| 2.59 | 1279.5 | 0.0000 | 2.59 | 0.423 | 0.0000 | |||
| - Overseas | 3.65 | 3.65 | |||||||
| 7. | What tourist | - Natural (mountains, forests, | 1.27 | 1.27 | |||||
| • | attractions will | craters, beaches, seas, etc.) | |||||||
| you choose? |
| 2.70 | 1351.9 | 0.0000 | 2.70 | 0.447 | 0.0000 | ||
| Friedman Test | Kendall's W Test | |||||||
|---|---|---|---|---|---|---|---|---|
| Questions | Option Answere | Mean Chi- Rank Square | Asymp | Mean Rank | Kendal 1's W | Asymp | ||
| (1) | (2) | (3) | (4) | . Sig. (5) | (6) | (7) | . Sig. (8) | |
| (-) | Amusement park (theme park, spill market, karaoke, etc.) | 2.74 | (") | (*) | 2.74 | (1) | (%) | |
| 3.29 | 3.29 | ||||||
| 8. What tourism | - See the sights | 2.17 | 2.17 | |||||
| activities will be carried out? |
| 4.39 | 4.39 | |||||
| 3.92 | 3.92 | ||||||
| 5.73 | 5.73 | ||||||
| - Culinary / eating & drinking | 4.13 | 4.13 | ||||||
| 5.74 | 3409.2 | 0.0000 | 5.74 | 0.376 | 0.0000 | ||
| – Nightlife | 8.16 | 8.16 | ||||||
| 6.08 | 6.08 | ||||||
| - Shopping | 7.39 | 7.39 | ||||||
| 7.29 | 7.29 | ||||||
| 9. How long will | - Less than 24 hours (a day) | 1.97 | 1.97 | |||||
| you be |
| 1.87 | 1.87 | |||||
| traveling? | - 1 week | 2.66 | 2451.2 | 0.0000 | 2.66 | 0.608 | 0.0000 | |
| - 2 weeks | 3.76 | 3.76 | ||||||
| – 1 month | 4.74 | 4.74 | ||||||
| 10. What |
| 2.90 | 2.90 | |||||
| transportation | - Train / electric train / LRT | 2.86 | 2.86 | |||||
| will you use for your trip? | – Bus | 3.91 | 1410.6 | 0.0000 | 3.91 | 0.280 | 0.0000 | |
| 101 your trip: | - Ship / Cruise | 5.00 | 1410.0 | 5.00 | ||||
| 4.02 | 4.02 | ||||||
| – Private car | 2.30 | 2.30 | ||||||
| 11. What type of |
| 3.11 | 3.11 | |||||
| accommodatio |
| 3.06 | 3.06 | |||||
| n will you choose du |
| 4.64 | 4.64 | |||||
| your trip? | - Homestay | 4.06 | 4.06 | |||||
| your aip. |
| 4.71 | 2691.5 | 0.0000 | 4.71 | 0.334 | 0.0000 | |
| – Villa | 4.69 | 4.69 | ||||||
| – Caravan | 7.02 | 7.02 | ||||||
| 6.38 | 6.38 | ||||||
| 7.35 | 7.35 | ||||||
Source: Own data processing (2023)
From Table 4 above, we can see that the influence of demographic factors on the sub-attributes of travel preferences varies widely. However, from Table 4 above, it can be said that the demographic variable that most dominantly affects the sub-attributes of travel preferences is the gender variable, followed by the variable of regional origin. Meanwhile, age and income variables were relatively less dominant in influencing the tourism preference sub-attributes.
From the above findings as presented in figure 1 and the test results as presented in Table 4, it can be concluded that Indonesian netizens prefer to avoid the risk in their tourism activities. This can be seen from their preference patterns who prefer really safe times for traveling, prefer places that are less risky, such as not lingering in destinations, preferring open places such as nature, culture and rural, more choose tourism activities and facilities that have minimal direct contact. This shows that they are more careful and choose the safety of their souls than choosing pleasure as has been discovered by (Djalante et al., 2020).
Thus, the findings of this study further emphasize the importance of the concept of tourist needs which shows that safety is one of the crucial properties for a consumer (Maslow, 1943). The consumer anticipates a number of disadvantages that arise from the choice of products, so his/her consumption process will consist of developing a strategy to choose a low-risk alternative. Indeed, the perception of risk is of paramount importance in the tourism decision-making process (Sönmez & Graefe, 1998; Floyd, Gibson, Pennington-Gray, & Thapa, 2004; Chebli & Said, 2020).
4.2 Relationship between demographic and tourism preference attributes
Figure 1 below presents a summary of the test results using the Chi Square Test regarding the relationship between the attributes of travel preferences and demographic variables. The arrow in Figure 2 shows the Contingency Coefficient Approximate Significance. Where, the P value <0.05 indicates a significant test result, which means that there is a significant relationship between demographic variables and travel preference attributes. Meanwhile, the value of P> 0.05 indicates insignificant test results, which means that there is no significant relationship between demographic variables and the attributes of travel preferences.
Some information that can be obtained from Figure 1 about the relationship between demographic variables and travel preference attributes, including: (1) In general, gender does not have a significant effect on the travel preferences of Indonesian citizens, except in terms of choosing a traveling partner, choosing the type of booking to be made, and in choosing a tourist destination; (2) Age has a significant effect on the travel preferences of Indonesian netizens, except for the choice of tourist attractions and the choice of accommodation type; (3) The origin of the area has a significant effect on the travel preferences of Indonesian citizens, except in terms of timing for traveling, types of tourist destinations to be visited, sources of information most used as a reference for traveling, with whom to travel, selection of tourist activities to be carried out, and choice of accommodation types; (4) In general, income does not have a significant effect on the travel preferences of Indonesian netizens, except in terms of the source of information that is most used as a reference for traveling, types of tourist destinations to be visited, tourist activities to be carried out, and the choice of accommodation types.
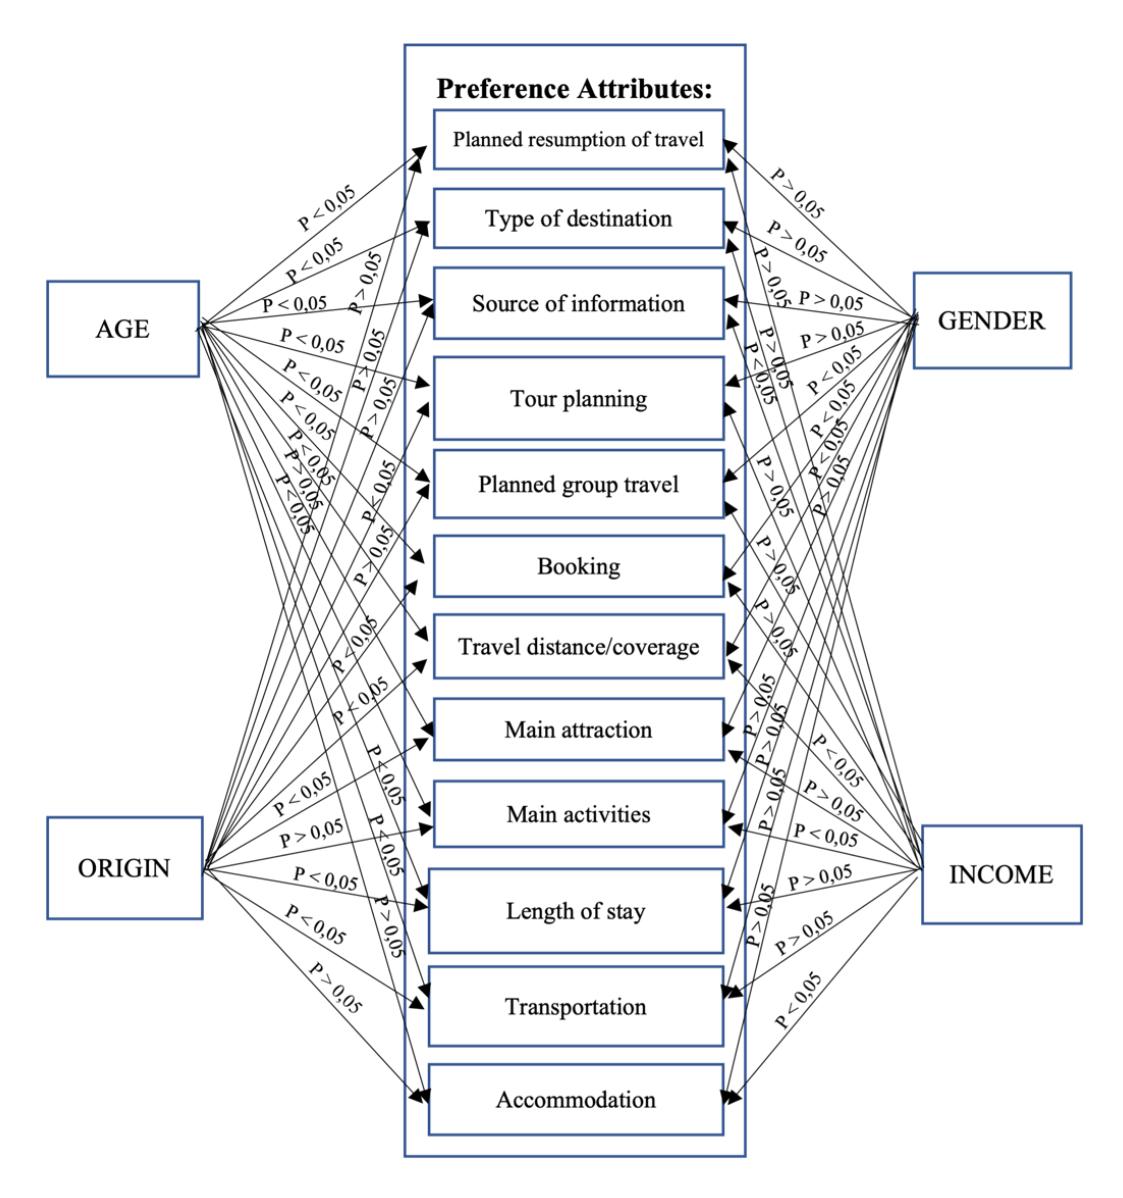
Figure 1. The Relationship Between Demographic Variables and Travel Preference Attributes Source: Own data processing (2023)
To get more complete information about the relationship between demographic variables and the sub-attributes of travel preferences, it can be seen in Table 5 below. This is a summary of the results of testing the relationship between demographic characteristics and travel preference sub-attributes, using the Pearson Chi-Square and Cramer's V test statistics.
From Table 5, it is known that overall, the gender variable has no effect on preference attributes, except for attributes related to planned group travel (traveling partners), types of booking to be made, and travel distance (travel coverage). In other words, there is no significant difference between men and women in terms of travel preferences during the new normal life, except for the preferences concerning planned group travel (traveling partners), types of booking to be made, and travel distance (travel coverage).
| Demography Preference Attributes | Gender | Age | Origin | Income | |
|---|---|---|---|---|---|
| 1. | Planned resumption of travel | Not related | Related | Not related | Not related |
| 2. | Types of destination | Not related | Related | Not related | Not related |
| 3. | Source of information | Not related | Related | Not related | Related |
| 4. | Tour planning | Not related | Related | Related | Not related |
| 5. | Planned group travel | Related | Related | Not related | Not related |
| 6. | Booking | Related | Related | Related | Not related |
| 7. | Travel distance/coverage | Related | Related | Related | Related |
| 8. | Main attractions | Not related | Not related | Related | Not related |
| 9. | Main activities | Not related | Related | Not related | Related |
| 10. | Length stay | Not related | Related | Related | Not related |
| 11. | Transportation | Not related | Related | Related | Not related |
| 12. | Accommodation | Not related | Not related | Not related | Related |
Table 5. The Relationship Between Demographics and Tourism Preference Attributes
Note: There is a relationship between preference attributes and demographics if the value of the Approximate Significance of the Contingency Coefficient is <0.05.
Source: Own data processing (2023)
In contrast to the gender variable, the overall age variable affects the preference attributes, except for the attributes related to the choice of tourist attractions and the choice of accommodation type. This means that there are significant differences among age groups in terms of preference attributes, except for the attributes regarding the choice of tourist attractions and the choice of accommodation type.
Meanwhile, the origin variable affects several preference attributes, namely tour planning, types of booking to be carried out, travel distance (travel coverage), tourist attractions to be selected, length of stay, and transportation to be used. However, it has no effect on several other attributes, namely planned resumption of travel, types of destination, sources most referenced, traveling partners, tourist activities to be carried out, and the type of accommodation to choose.
Furthermore, the income variable has a significant effect on most of the travel preference attributes, except for the attributes of information sources, travel distance (travel coverage), main activities to be carried out, and the type of accommodation to choose. This indicates that Indonesian netizens with certain income categories show significant differences in travel preferences, except for the attributes of information sources, travel distance (travel coverage), tourist activities to be carried out, and the type of accommodation to choose.
The results of this study are in line with research conducted by Oh et al. (2004), which found that there are different groups prevalent in certain categories of participation in shopping activities, and that age, sex, and travel typology are significant factors influencing preference patterns. In this case, travel typology, age, and sex can serve as useful indicators for configuring tourist profiles.
Some of the findings from this study are also consistent with other research. For example, Zulhikam (2012) found that age, income, and education variables significantly influence preferences in choosing halal food products. Similarly, Latifah (2018) showed that demographics affect the preferences and behaviour of the Surabaya Muslim middle class in shaping the potential for halal hospitals.
These findings also highlight those individual differences largely determine a person's preferences. As stated by Regan & Horn (2005), individual differences affect overall preferences (traits or nature), although they have only a small but significant effect on mood comparisons. A depressed mood, for instance, is most strongly associated with a preference for nature.
5. Conclusion and Implicatons
Based on the research results, it can be concluded that Indonesian netizens generally avoid traveling until the crisis is over. They tend to choose natural tourist attractions relatively close to home, plan trips through online bookings, and travel with family members. They prefer using private vehicles for trips of up to two days and choose affordable accommodations. The impact of demographic factors on travel preferences varies widely, with gender being the most influential factor, followed by region of origin. In contrast, age and income have relatively smaller influences on travel preferences. Their preferences indicate a desire to travel only if it is truly safe, a preference for low-risk destinations where they will not stay long, a preference for open environments such as nature, culture, and rural areas, and a preference for tourism activities and facilities that minimize direct contact.
Based on the research findings, there are several important theoretical and practical implications for tourism destination management, particularly after crisis situations. Theoretically, the results of this study enrich our understanding of tourist behavior in crisis contexts by confirming that risk perception plays a central role in travel decision-making. Indonesian tourists' preference for outdoor destinations, short trips by private vehicle, and activities that minimize physical contact demonstrates the importance of integrating risk perception and value-based decision-making approaches in the study of tourist behavior. In this context, tourists consider not only the attractiveness of the destination but also aspects of safety, comfort, and flexibility. These findings also contribute to the development of tourism market segmentation theory, where demographic factors such as gender and region of origin are shown to be more significant than age or income level in influencing travel preferences. Thus, this study opens up new opportunities for exploring the concept of socioculturalbased tourism behavior that is contextualized to Indonesian society.
Practically, the main implications are for tourism destination managers in designing adaptive strategies to changing tourist preferences. First, destination managers need to prioritize the development and promotion of local destinations that are outdoor and easily accessible. Strengthening the image of a safe, open, and crowd-free destination is crucial for building tourist trust. Second, it is crucial to provide facilities and services that support independent, contactless travel, such as online reservation systems, self-guided tours, and the implementation of strict health protocols. Third, marketing strategies need to be targeted at gender-based and regionally targeted tourist segments, for example by providing tour packages tailored to women, families, or specific local communities. Fourth, considering the duration and type of trip, managers are advised to offer short, flexible tour packages, such as one-day trips or weekend getaways, which are more suited to the needs and comfort of postcrisis travelers. Finally, strengthening risk communication through social media and other digital channels is crucial for increasing tourist awareness of destination safety and reinforcing positive perceptions of the travel experience offered. Thus, the findings of this study not only contribute to the development of theories of tourist behavior in the context of a crisis but also provide strategic direction that destination managers can implement to respond adaptively and sustainably to changing tourism demand dynamics.
The limitation of this research is only done by cross section data with only one month of distributing online questionnaires. this is due to limited funds in using the online questionnaire platform so that during that time we were only able to collect around a thousand samples. Another survey later in the year may show whether preferences have remained consistent or changed. A follow-up survey also needs to be carried out with a longitudinal approach through literature studies or perhaps also by conducting in-depth interviews of the findings in this study in order to reveal other things that cannot be disclosed through online questionnaires. In addition, it is also necessary to carry out further research to strengthen the theory of preferences, especially in the field of tourism which is able to produce strong dimensions of tourist preferences.
References
- Agrusa, J., & Kim, S. S. (2008). Understanding preferences and characteristics of Japanese tourists to Hawaii. Tourism Analysis, 13(5-6), 485-497. DOI: 10.3727/108354208788160487.
- Amir, S., Osman, M. M., Bachok, S., & Ibrahim, M. (2014). Understanding of Tourists Preferences Pattern: A Study In Melaka, Malaysia. Planning Malaysia, 12(3).
- Andriotis, K., Agiomirgianakis, G., & Mihiotis, A. (2007). Tourist vacation preferences: The case of mass tourists to Crete. Tourism analysis, 12(1-2), 51-63. DOI: 10.3727/108354207780956672.
- Arikunto, S. (2008). Penelitian tindakan kelas. PT Bumi Aksara.
- Cai, L. A., Feng, R., & Breiter, D. (2004). Tourist purchase decision involvement and information preferences. Journal of vacation Marketing, 10(2), 138-148. DOI: 10.1177/135676670401000204.
- Cárdenas-García, P. J., & Sánchez-Rivero, M. (2015). Tourism and economic development: Analysis of geographic features and infrastructure provision. Current Issues in Tourism, 18(7), 609-632.
- Chebli, A. (2020). The impact of Covis-19 on tourist consumption behaviour: a perspective article. Journal of Tourism Management Research, 7(2), 196–207. DOI: 10.18488/journal.31.2020.72.196.207.
- Chen, K., Enger, W., Yu, J., & Zhang, C. (2020). Hitting the road again: How Chinese travelers are thinking about their first trip after COVID-19. McKinsey & Company.
- Chen, X. (2022, January). Post-00 Netizens Preferences with Regards to the Use of Internet Entertainment Content—An Analysis Based on "2019 App Contact Behavior Survey of New Potential People". In Innovative Computing: Proceedings of the 4th International Conference on Innovative Computing (IC 2021) (pp. 1121-1126). Singapore: Springer Nature Singapore.
- Cheng, W., Tian, R., & Chiu, D. K. (2024). Travel vlogs influencing tourist decisions: information preferences and gender differences. Aslib Journal of Information Management, 76(1), 86-103.
- Decrop, A. (2000). Personal aspects of vacationers' decisionmaking processes: An interpretivist approach. Journal of Travel & Tourism Marketing, 8(4), 59-68. DOI: 10.1300/J073v08n04_04.
- Dimanche, F., & Andrades, L. (Eds.). (2015). Tourism in Russia: a management handbook. Emerald Group Publishing.
- Djalante, R., Lassa, J., Setiamarga, D., Sudjatma, A., Indrawan, M., Haryanto, B., & Warsilah, H. (2020). Review and analysis of current responses to COVID-19 in Indonesia: Period of January to March 2020. Progress in disaster science, 6, 100091. DOI: 10.1016/j.pdisas.2020.100091.
- European Travel Commission. (2019). Study on the South-East Asian outbound travel market with a focus on Europe as a tourism destination. Market Vision Research and Consulting Services.
- Fall, L. T., & Massey, J. E. (2006). The significance of crisis communication in the aftermath of 9/11: A national investigation of how tourism managers have re-tooled their promotional
- campaigns. Journal of Travel & Tourism Marketing, 19(2-3), 77-90. DOI: 10.1300/J073v19n02_07.
- Faraj, M. (2022). The impact of understanding tourists' preferences on optimizing tourism outcome in Lebanese rural destinations. Lebanese Science Journal, 23(1), 78.
- Felix, E. O., Kim, S. S., & Choi, Y. (2020). Understanding senior tourists' preferences and characteristics based on their overseas travel motivation clusters. Journal of Travel & Tourism Marketing, 37(2), 246–257. DOI: 10.1080/10548408.2020.1740136.
- Germann Molz, J. (2005). Getting a "flexible eye": Round-the-world travel and scales of cosmopolitan citizenship. Citizenship Studies, 9(5), 517–531.
- Gössling, S., Scott, D., & Hall, C. M. (2020). Pandemics, tourism and global change: a rapid assessment of COVID-19. Journal of sustainable tourism, 29(1),1-20. DOI: 10.1080/09669582.2020.1758708.
- Gupta, V., Sajnani, M., & Gupta, R. K. (2020). Street foods: contemporary preference of tourists and its role as a destination attraction in India. International Journal of Culture, Tourism and Hospitality Research, 14(1), 136-154. DOI: 10.1108/IJCTHR-07-2018-0092.
- Hassani, A., & Moghavvemi, S. (2020). Muslims' travel motivations and travel preferences: The impact of motivational factors on Islamic service, hedonic and product preferences. Journal of Islamic Marketing, 11(2), 344-367. DOI: 10.1108/JIMA-11-2018-0215.
- Hellier, P. K., Geursen, G. M., Carr, R. A., & Rickard, J. A. (2003). Customer repurchase intention: A general structural equation model. European journal of marketing, 37(11/12), 1762-1800. DOI: 10.1108/03090560310495456.
- Hidayah, N. (2021). Pemasaran destinasi pariwisata berkelanjutan di era digital: Targeting, positioning, branding, selling, marketing mix, internet marketing. Kreasi Cendekia Pustaka.
- Hidayah, N. (2019). Pemasaran destinasi pariwisata. Alfabeta.
- Higgins-Desbiolles, F. (2020). Socialising tourism for social and ecological justice after COVID-19. Tourism Geographies, 1–14. DOI: 10.1080/14616688.2020.1757748.
- Hoque, A., Shikha, F. A., Hasanat, M. W., Arif, I., & Hamid, A. B. A. (2020). The effect of Coronavirus (COVID-19) in the tourism industry in China. Asian Journal of Multidisciplinary Studies, 3(1), 52-58.
- Huang, J. H., & Min, J. C. (2002). Earthquake devastation and recovery in tourism: The Taiwan case. Tourism Management, 23(2), 145-154. DOI: 10.1016/S0261-5177(01)00051-6.
- Hystad, P. W., & Keller, P. C. (2008). Towards a destination tourism disaster management framework: Long-term lessons from a forest fire disaster. Tourism Management, 29(1), 151–162. DOI: 10.1016/j.tourman.2007.02.017.
- Khan, A., Bibi, S., Lorenzo, A., Lyu, J., & Babar, Z. U. (2020). Tourism and development in developing economies: A policy implication perspective. Sustainability, 12(4), 1618.
- Kim Lian Chan, J., & Baum, T. (2007). Motivation factors of ecotourists in ecolodge accommodation: The push and pull factors. Asia Pacific Journal of Tourism Research, 12(4), 349-364. DOI: 10.1080/10941660701761027.
- Kim, B. P., McCleary, K. W., & Kaufman, T. (2010). The new generation in the industry: Hospitality/Tourism students' career preferences, sources of influence and career choice
- factors. Journal of Hospitality & Tourism Education, 22(3), 5-11. DOI: 10.1080/10963758.2010.10696979.
- Landis, J. R., & Koch, G. G. (1977). The measurement of observer agreement for categorical data. biometrics, 159-174. DOI: 10.2307/2529310.
- Latifah, L. U. L. U. K. (2018). Pengaruh demografi sosial ekonomi dan lingkungan terhadap preferensi dan perilaku middle class muslim surabaya dalam membentuk potensi halal hospital. Universitas Islam Negeri Sunan Ampel.
- Lieux, E. M., Weaver, P. A., & McCleary, K. W. (1994). Lodging preferences of the senior tourism market. Annals of Tourism Research, 21(4), 712-728. DOI: 10.1016/0160-7383(94)90079-5.
- Littrell, M. A., Paige, R. C., & Song, K. (2004). Senior travellers: Tourism activities and shopping behaviours. Journal of vacation marketing, 10(4), 348-362. DOI: 10.1177/135676670401000406.
- Maslow, A. H. (1943). A theory of human motivation. Psychological review, 50(4), 370. DOI: 10.1037/h0054346.
- Moschis, G. P., & Ünal, B. (2008). Travel and leisure services preferences and patronage motives of older consumers. Journal of Travel & Tourism Marketing, 24(4), 259-269. DOI: 10.1080/10548400802156711.
- OECD. (2020). OECD tourism trends and policies 2018. OECD Publishing.
- Oh, H., Kim, B. Y., & Shin, J. H. (2004). Hospitality and tourism marketing: recent developments in research and future directions. International Journal of Hospitality Management, 23(5), 425-447. DOI: 10.1016/j.ijhm.2004.10.004.
- Otoo, F. E., Kim, S., & Choi, Y. (2020). Understanding senior tourists' preferences and characteristics based on their overseas travel motivation clusters. Journal of Travel & Tourism Marketing, 37(2), 246-257. DOI: 10.1300/J073v15n02_02.
- Overby, J. W., & Lee, E. J. (2006). The effects of utilitarian and hedonic online shopping value on consumer preference and intentions. Journal of Business research, 59(10-11), 1160-1166. DOI: 10.1016/j.jbusres.2006.03.008.
- Park, M. K., Jang, J. H., Lee, S. H., & Brayley, R. (2009). Tourism and the N generation in a dynamically changing society: The case of South Korea. In Tourism and generation Y (pp. 85–97). CABI.
- Prisgunanto, I. (2020). Social media and visit decision to tourist destinations: Measuring the impact of instagram on expatriates in Indonesia. Jurnal Komunikasi: Malaysian Journal of Communication, 36(1), 495-508.
- Regan, C. L., & Horn, S. A. (2005). To nature or not to nature: Associations between environmental preferences, mood states and demographic factors. Journal of Environmental Psychology, 25(1), 57– 66. DOI: 10.1016/j.jenvp.2005.01.001.
- Seo, S., Yun, N., & Kim, O. Y. (2017). Destination food image and intention to eat destination foods: a view from Korea. Current Issues in Tourism, 20(2), 135-156. DOI: 10.1080/13683500.2014.934210.
- Sharma, T., Sehrawat, A., & Chauhan, A. (2014). Domestic tourism destination preferences of Indian youth. Himalayan Journal of Contemporary Research, 3(1).
- Sigala, M. (2020). Tourism and COVID-19: Impacts and implications for advancing and resetting industry and research. Journal of Business Research, 117, 284–289. DOI: 10.1016/j.jbusres.2020.06.015.
- Sönmez, S. F., & Graefe, A. R. (1998). Determining future travel behavior from past travel experience and perceptions of risk and safety. Journal of travel research, 37(2), 171-177. DOI: 10.1177/004728759803700209.
- Syahputra, I., & Hafiar, H. (2019). Activities of netizens on social media and religious spirituality of Indonesian millennials in the era of new media. The International Journal of Religion and Spirituality in Society, 9(1), 57.
- Tran, X., & Ralston, L. (2006). Tourist preferences influence of unconscious needs. Annals of tourism research, 33(2), 424-441. DOI: 10.1016/j.annals.2005.10.014.
- Wang, Q., Zhao, W., Yang, J., Wu, J., Xue, S., Xing, Q., & Yu, P. S. (2021). C-DeepTrust: A contextaware deep trust prediction model in online social networks. IEEE Transactions on neural networks and learning systems, 34(6), 2767-2780.
- Wen, Z., Huimin, G., & Kavanaugh, R. R. (2005). The impacts of SARS on the consumer behaviour of Chinese domestic tourists. Current Issues in Tourism, 8(1), 22-38. DOI: 10.1080/13683500508668203.
- Wong, C. K. S., & Kwong, W. Y. Y. (2004). Outbound tourists' selection criteria for choosing allinclusive package tours. Tourism management, 25(5), 581-592. DOI: 10.1016/j.tourman.2003.06.002.
- World Tourism Organization & Tourism Australia. (2013). Key outbound tourism markets in South-East Asia – Indonesia, Malaysia, Singapore, Thailand and Vietnam. UNWTO. DOI: 10.18111/9789284415076.
- Zhang, H., Yang, Y., & Bai, B. (2022). The effects of photo-sharing motivation on tourist well-being: The moderating role of online social support. Journal of Hospitality and Tourism Management, 51, 471-480.
- Zulhikam, A. (2012). Pengaruh faktor demografi terhadap preferensi ibu rumah tangga Muslim untuk memilih produk pangan halal. [Undergraduate thesis, UIN Alauddin Makassar].