
1. Introduction
Tourist expenditure is affected by intricate aspects including socio-demographic attributes, travel itinerary, psychological influences, and satisfaction with the place (Cozzio et al., 2021). The primary factors influencing tourists include income, accommodation type, trip purpose, group size, and country of origin, whereas psychological factors including spending inclination significantly influence spending behaviours at a destination (Agarwal & Yochum, 1999; Štefko et al., 2022). Contentment with the variety of amenities at a site can enhance visitor expenditure, although not all facility features influence satisfaction (Disegna & Osti, 2016; Jurdana & Frleta, 2017). Expenditure distribution among categories such as housing, food, shopping, and transportation fluctuates according to personal tastes and group dynamics, with food frequently preferred after transportation expenses
(Mudarra-Fernández et al., 2019). Information sources can affect accommodation expenditures but exert a diminished influence on shopping expenses, especially official information sources from the service providers (Park et al., 2020). Advanced modelling techniques can elucidate the variability in tourist expenditure and demonstrate that spending choices are interconnected across categories (Pellegrini et al., 2021). Comprehending visitor expenditure necessitates the incorporation of various elements, including economic, psychological, and experiential considerations, to guide destination management and marketing initiatives (Wanga & Davidsonb, 2010).
International tourism is vital to the Indonesian economy, greatly impacting GDP, employment generation, and foreign exchange revenue with international tourist arrivals totalling 15.81 million in 2018 and exhibiting an upward trajectory prior to the COVID-19 pandemic (Azizurrohman et al., 2021). Visa exemption rules have augmented foreign tourist arrivals by approximately 5% drawing visitors to locations beyond established tourist hotspots like Bali (Yudhistira et al., 2021). The calibre of international tourists in Indonesia is superior among business travellers, as shown by travel expenditure, with most foreign tourists originating from ASEAN nations compared to others (Agustina et al., 2021). Economic growth and a favourable exchange rate are primary catalysts for foreign tourist visits, although inflation seems to exert just a negligible influence (Rifai & Kurniawan, 2023). Challenges persist, including the uneven distribution of tourists around the region, insufficient international connectivity, infrastructural deficiencies, and poor promotion of lesser-known destinations (Supriono et al., 2017). Predictive models, including local polynomial regression and backpropagation algorithms, have demonstrated significant accuracy in anticipating visitor arrivals, facilitating policy planning (B. S. Pratama et al., 2024). The COVID-19 epidemic precipitated a significant reduction in tourist arrivals; however, the economy has experienced a substantial resurgence in inbound tourism, with airports functioning as the principal entry point for many international visitors (Sawitri et al., 2021). The viewpoints of international travellers underscore their contentment with Indonesian tourism, their engagements, and their prospective travel goals, offering significant insights for enhancing the sector (Maryamah et al., 2023).
Outbound tourism from ASEAN nations is influenced by a combination of economic, cultural, and psychological variables alongside regional integration and global uncertainty. ASEAN tourists exhibit a robust motivation for travel influenced by socio-psychological and cultural factors with minimal variance across demographic profiles indicating a persistent and uniform desire for travel within the area (Hinlayagan & Olivar, 2023). Economic factors including exchange rates and price competitiveness significantly influence tourism; tourists react more favourably to advantageous currency fluctuations with destinations like Singapore gaining from relative price advantages, while countries such as the Philippines are urged to improve their tourism promotion strategies (Nguyen, 2021). Free trade agreements and regional collaboration have enhanced intra-ASEAN travel simplifying the process for residents to visit adjacent nations (Heriqbaldi et al., 2023). Outbound tourism preferences differ by source country with travellers from China, Japan, and South Korea exhibiting unique patterns which are associated with the tourism competitiveness of ASEAN destinations (Pang & Zhu, 2018). The interplay between outbound and incoming tourism is interdependent with disruptions in one nation's visitor movements frequently reverberating throughout the region underscoring the necessity for coordinated policies and the liberalization of tourism (Ajisaputra et al., 2023). ASEAN's outbound tourism is strong yet susceptible to economic fluctuations, policy alterations, and regional stability, highlighting the necessity for strategic management and cooperation among member states (Untari, 2019).
Data about tourist arrivals from ASEAN nations to Indonesia indicates a notable recovery trend post-COVID-19 epidemic (Indonesia Statistics, 2024). In 2020 and 2021, the influx of tourists from all ASEAN nations underwent a significant reduction owing to travel restrictions and lockdown measures. For instance, Malaysia which initially recorded 980.118 tourists in 2020 decreased to 480.723 in 2021. Beginning in 2022, nearly all nations experienced a steady rise with Malaysia and
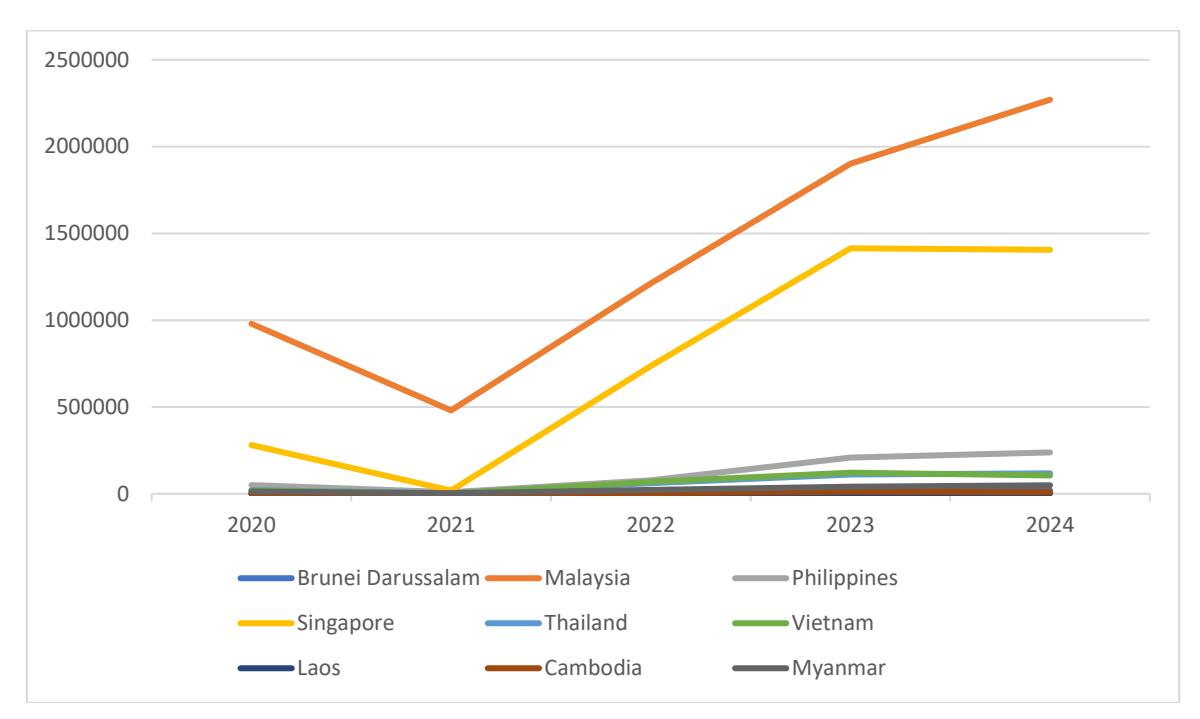
Figure 1. Indonesia Inbound Tourist from ASEAN Source: Indonesia Statistics (2025)
Singapore being the primary contributors. In 2024, Malaysia welcomed 2.27 million tourists whereas Singapore accounted for 1.4 million representing a minor decline relative to 2023. This signifies that Indonesia continues to be a preferred destination for tourists from adjacent nations particularly those with geographical and cultural affinity. Conversely, certain nations such Vietnam and Cambodia had a decline in tourist arrivals in 2024 relative to 2023 despite the overall favourable trend. Vietnam's arrivals decreased from 121.879 in 2023 to 104.901 in 2024 and Cambodia's declined from 12.611 to 10.497. Simultaneously, Brunei Darussalam and Myanmar saw significant growth with Brunei's visitor arrivals escalating from 1.351 in 2023 to 19.811 in 2024.
The Boston Consulting Group (BCG) Matrix supports the tourism sector by enabling destination or tourist attraction management to evaluate their business standing about relative market share and market growth (Aprilia et al., 2023). Employing the BCG Matrix, managers can ascertain if their location is classified as a star, cash cow, question mark, or dog, so enabling the formulation of suitable development strategies to enhance the competitiveness and sustainability of tourism operations. For example, an analysis conducted by Sabaya et al (2023) illustrates that the BCG Matrix is effective in determining strategies for survival, development, or rebranding, as well as in identifying the strengths, opportunities, weaknesses, and dangers of tourist locations. Moreover, the BCG Matrix facilitates data-driven decision-making including resource allocation, investment prioritization, and marketing strategy adjustments, so enhancing the responsiveness of tourism destinations to market fluctuations, especially during crises such as the COVID-19 pandemic ( Escoto et al., 2021). Moreover, the BCG Matrix can be strategically employed to aid tourism sites in enduring, thriving, and enhancing their contributions to the local economy (Mardiana, 2012).
Studies indicate that tourists typically distribute their expenditures across many primary areas, including lodging, dining, retail, transportation, and leisure activities (Amir et al., 2015). Within these categories, housing, food and beverage, and shopping predominantly account for expenditures, but transportation and entertainment generally receive a lesser portion. In Turkey, expenditures by tourists on food, beverages, and accommodation constitute the predominant category, whilst tourism services receive the least financial allocation (Akcadag & Bozkurt, 2021). The allocation of tourist expenditure is affected by multiple factors, such as trip attributes and socio-demographic characteristics (Ab Rahman et al., 2023). The duration of stay, purpose of trip (such as leisure or business), and kind of accommodation substantially affect expenditure patterns. Moreover, income level, group size, and country of tourists significantly influence their expenditure patterns and category allocations (Santos & Vieira, 2012). For instance, affluent tourists may allocate greater expenditures to opulent lodgings and upscale dining establishments, whereas budget-conscious travellers may emphasize economical transportation and retail options. Destination attributes significantly influence expenditure patterns. The attractions, infrastructure, and local economy of a place can account for up to 50% of the variance in expenditure at prominent tourist sites (Artal-Tur et al., 2023). For instance, locales with dynamic nightlife may stimulate increased entertainment expenditure, whereas areas renowned for shopping centers or markets typically exhibit elevated retail spending. Moreover, attractions in proximity to a place can affect tourists' expenditure distribution, since they may explore adjacent sites (Brida et al., 2023). This behavior illustrates the intricacy of tourist expenditure, wherein individual preferences and travel context interact.
This study seeks to examine ASEAN tourist expenditure patterns in Indonesia through the BCG Matrix framework to ascertain the competitive standing of each source nation. This report categorises countries into the Star, Cash Cow, Question Mark, and Dog quadrants and offers strategic recommendations to improve destination competitiveness, optimise resource allocation, and implement data-driven marketing policies. The findings are anticipated to aid stakeholders in maximising tourism earnings, especially from ASEAN markets that are geographically and culturally close to Indonesia.
2. Literature Review
Literature on tourist spending indicates that tourist spending behavior is influenced by a combination of economic, demographic, and psychological factors. Variables such as income, trip purpose, accommodation type, and group size have been shown to be key determinants of the amount and distribution of spending (Massidda et al., 2022). Furthermore, psychological factors such as motivation and spending propensity also play a significant role in shaping tourists' consumption decisions (Alfarhan et al., 2023). Another study confirmed that destination satisfaction also influences spending levels, although not all facility attributes have the same impact (Phan et al., 2024). In general, tourist spending tends to be concentrated on accommodation, food and beverages, and shopping, with variations influenced by individual preferences and trip characteristics (Wang et al., 2006).
In the context of international tourism, the ASEAN region exhibits strong dynamics as both a source and destination market. Economic growth, exchange rate stability, and regional integration are key factors driving tourist mobility between ASEAN countries (Hor, 2021). Furthermore, social, cultural, and psychological motivations are relatively uniform among ASEAN tourists, indicating stable and sustainable market potential (Nugraha & Naylah, 2023). In Indonesia, ASEAN tourists are a major contributor to international visits and tourism foreign exchange, supported by visa-free policies and geographical and cultural proximity (Yudhistira et al., 2021). However, challenges such as unequal tourist distribution, limited connectivity, and lack of promotion of alternative destinations remain obstacles to optimizing this market potential (Supriono, 2017).
To analyze the strategic position of tourist markets, the BCG Matrix approach is widely used in tourism studies. This matrix classifies markets or products based on growth rates and relative market share, thus assisting in strategic decision-making regarding investment and development (Hossain & Kader, 2020). In the tourism sector, the BCG Matrix has proven effective in identifying destination
development priorities and formulating marketing strategies that adapt to market dynamics (Aprilia et al., 2023). This approach enables more efficient and data-driven resource allocation, particularly in the face of rapid market changes, such as those following the COVID-19 pandemic (Bernal Escoto et al., 2021). Thus, the integration of tourist expenditure analysis and the BCG Matrix approach provide a relevant framework for understanding and optimizing market-based tourism strategies.
3. Methodology
This study utilises data from the Indonesian Statistics Agency for the years 2023 and 2024, encompassing ten variables from ASEAN countries that have been combined. These variables denote the aggregate expenditures of international tourists during their travels. Expenditures are classified into ten categories:
- 1. Accommodation: all costs associated with lodging and meals that are integral to the accommodation experience;
- 2. Food and Beverage: all expenditures related to food and beverages throughout the trip;
- 3. Domestic Flights: costs associated with flights within Indonesia throughout the journey;
- 4. Local Transportation: costs incurred for local transportation utilised in Indonesia, specifically land and maritime/ferry transit;
- 5. Shopping: expenditures for essentials during the stay in Indonesia and costs for keepsakes acquired in Indonesia for home;
- 6. Entertainment, recreation, and tour guide services encompass activities such as karaoke, sightseeing, and admission to zoos, museums, commercial tourist attractions, and arts and cultural performances as well as tour guide services. These expenses are those directly incurred by respondents or outside local tour packages;
- 7. Health and Beauty encompass expenditures related to wellness and aesthetics, including spa costs;
- 8. Courses/Training refers to expenditures related to courses or training programs;
- 9. Local Tour Packages refer to expenditures for tour packages acquired during one's stay in Indonesia;
- 10. Others are those incurred beyond the aforementioned charges.
The author employs the Boston Consulting Group (BCG) research by categorising these characteristics into four quadrants; star, question mark, cash cow, and dog (Bondarenko, 2022; Gorb et al., 2022; Pan, 2023). The BCG Matrix is a strategic instrument commonly employed to evaluate a company's product portfolio or business unit. This matrix aids in determining investment, development, or divestment strategies for assets by classifying items or units according to their market growth rate and relative market share. This matrix features a 2x2 quadrant with two axes: the vertical axis represents Market Growth Rate indicating market attractiveness, while the horizontal axis denotes Relative Market Share reflecting the product's or unit's strength relative to competitors. The BCG Matrix aids in resource allocation, strategic planning, and assists organisations in balancing investments between new and old goods (Hossain & Kader, 2020; Mohajan, 2018). This matrix continues to be widely utilised and has been modified to address contemporary concerns, such as sustainability and dynamic market analysis (Chiu & Lin, 2020).
To construct the BCG Matrix, two indicators were calculated: market growth rate and relative market share. The market growth rate was calculated by comparing tourism revenue between 2023 and 2024 for each ASEAN country. Relative market share was calculated by dividing the market share of each country by the highest market share within the ASEAN tourist market. These two indicators were then plotted on the BCG Matrix to classify countries into four quadrants: Stars (high growth–high
share), Cash Cows (low growth–high share), Question Marks (high growth–low share), and Dogs (low growth–low share).
4. Results
This section presents the empirical results derived from the analysis of ASEAN tourist expenditure and market performance in Indonesia. The results include expenditure patterns, market growth rates, and relative market share calculations used to position ASEAN countries within the BCG Matrix framework. The expenditure data represents the mean aggregation of 10 categories; accommodation, beverages, domestic flights, local transportation, shopping and souvenirs, entertainment, health and beauty, courses/training, local tour packages, and others as illustrated in table 1. The table displays the average cost per individual across 10 categories.
Two fundamental concepts in corporate analysis and marketing strategy are growth rate and relative market share, especially when employing methodologies like the Boston Consulting Group (BCG) Matrix. The growth rate of a market, product, or company is a percentage that reflects the speed of its expansion over time. The yearly growth rate is commonly employed to quantify it. This is crucial as enterprises can anticipate future demand and understand market dynamics through growth rates. Companies may augment their investment in a rapidly growing market to enhance their profits. Relative market share refers to the comparison of a company's or product's market share with that of its principal competitors within the same industry. Relative market share in the BCG Matrix is often calculated by dividing the firm's market share by the highest market share within the industry. The relative market share is 0.5 when a company's market share is 10% and that of its largest competitor is 20%. The relative market share of a firm or product is a crucial indicator of its competitiveness in the market. Firms with a greater market share than their competitors are more strategically positioned to generate profits and endure against the competition. The formula is as follows:
Growth Rate Formula Relative Market Share Formula VPN-VPN1 VPN VPN1 VPPN1
Note:
VPN= Sales volume last year VPN1= Previous year sales volume
VPPN=Competitor's last year's sales volume
Table 1. Expenditure per person
| Net Revenue (in usd) | ||||
|---|---|---|---|---|
| Nation | 2023 | 2024 | ||
| Brunei | 943.73 | 1064.9 | ||
| Malaysia | 591.03 | 693.07 | ||
| Philippines | 768.43 | 1005.24 | ||
| Singapore | 929.82 | 707.69 | ||
| Thailand | 683.27 | 1107.35 | ||
| Vietnam | 760.41 | 949.14 | ||
| Laos | 803.27 | 1201.27 | ||
| Cambodia | 803.27 | 1167.76 | ||
| Myanmar | 803.07 | 820.59 | ||
Source: Indonesia Statistics (2023; 2024)
Table 2. Market Growth, Market Share in the Previous Year, Highest Competitor Share, and Relative Market Share
| Nationality | Net Revenue (in dollar) | Highest | Relative | |||
|---|---|---|---|---|---|---|
| 2023 | 2024 | Market | Market | Competitor | Market | |
| Growth | Share 2023 | Share | Share | |||
| Brunei | 12757342.14 | 21096733.9 | 65% | 0.7% | 51% | 0.013406207 |
| Malaysia | 1123691059 | 1573654247 | 40% | 50.5% | 1% | 74.59231625 |
| Philippines | 160953810.9 | 239659268.4 | 49% | 7.7% | 1% | 11.3600176 |
| Singapore | 1315181110 | 994515341.6 | -24% | 31.9% | 1% | 47.14072549 |
| Thailand | 76380020.22 | 130881018.6 | 71% | 4.2% | 1% | 6.203852178 |
| Vietnam | 92678010.39 | 99565735.14 | 7% | 3.2% | 1% | 4.719485756 |
| Laos | 2727904.92 | 3544947.77 | 30% | 0.1% | 1% | 0.168033013 |
| Cambodia | 10130037.97 | 12257976.72 | 21% | 0.4% | 1% | 0.581036704 |
| Myanmar | 32861624.4 | 40387798.62 | 23% | 1.3% | 1% | 1.914410013 |
Source: Researcher (2025)
The following findings (Table 2) were determined by researchers based on market growth, market share in the previous year, highest competitor share, and relative market share. Furthermore, net revenue is derived from expenditure per person and the total number of tourists for that year.
Malaysia and Singapore are the primary sources of tourists to Indonesia. In 2023, Malaysia held a 50.5% market share, generating net revenues of $1.12 billion, which rose to $1.57 billion in 2024. Moreover, Malaysia and Singapore ranked among the three largest nations in 2024. Malaysia accounted for 16.6 percent of tourists, while Singapore comprised 10.1 percent of the total foreign tourist arrivals in Indonesia. Specifically, Malaysia, India, and Australia represented the greatest number of nationalities arriving at Ngurah Rai Airport. Australia's supremacy is attributed to the introduction of a new flight route to Ngurah Rai commencing in March 2024. In 2023, Singapore generated a substantial revenue of $1.31 billion, although contributed 24% in 2024, amounting to $994 million. Nonetheless, Malaysia and Singapore constitute the largest contingent of international tourists arriving at Soekarno-Hatta International Airport, alongside China.
The Philippines had a 49% increase (from $160 million to $239 million), reflecting heightened interest among Filipino tourists in Indonesia. Nonetheless, its market share is limited (7.7%), indicating significant potential to draw additional tourists through more assertive marketing strategies. The "Wonderful Indonesia" branding strategy, endorsed by the Indonesian Embassy in Manila, has contributed to heightened interest among Filipino tourists, resulting in stable and rising tourist numbers (Ajisaputra et al., 2023). Thailand experienced significant increase (71%, from $76 million to $130 million), while its market share remained at 4.2%. To enhance this figure, many techniques may be employed, including bolstering consumption values, particularly to engage young Thai visitors via electronic word-of-mouth (eWOM) (Ramadhania et al., 2021).
Vietnam experienced a growth of merely 7% (from $92.6 million to $99.5 million), holding a market share of 3.2%. The subdued increase may stem from the absence of direct flight connections or the assumption that Indonesia is less appealing than Thailand or Malaysia. The inbound tourism sector can develop more packages to entice Vietnamese tourists to Indonesia, including the historical tourism related to Vietnamese people in Batam (J. Pratama & Aprianto, 2022). Cambodia experienced a growth of 21% (from $10.1 million to $12.2 million), however its market share remains minimal at 0.4%. A method to attract Cambodian tourists, akin to the prior approach, could involve developing cultural tourism packages for places with analogous cultural heritage to Indonesia (Khairiyah, 2020) or targeting comparable market segments (Grace & Laserna, 2021), including Siem Reap.
Brunei had a 65% increase in growth, rising from $12.7 million to $21 million, the most among ASEAN nations. Nonetheless, its market share is merely 0.7%, suggesting that despite the substantial expenditure of Bruneian tourists (perhaps attributable to high-net-worth individuals), the number of arrivals remains limited. Enhancing this volume, cross-border tourism between Brunei Darussalam and Indonesia in the Borneo region presents considerable potential to augment the movement of tourists, goods, and services via Cross-Border Tourism (CBT) initiatives (Alas & Anshari, 2021), notwithstanding various challenges including political support, insufficient infrastructure, and feeble collaboration between the two nations. Bilateral collaboration via the Joint Commission Bilateral Cooperation (JCBC) has facilitated a rise in tourism activities, notably the inauguration of a direct aircraft route from Bandar Seri Begawan to Balikpapan (Maureen & Choirunnisa, 2020). This facilitates Bruneian travellers' exploration of locations in Kalimantan, Indonesia. The emphasis of tourism development between the two nations encompasses ecotourism, including national parks and historical monuments, and halal tourism to appeal to Muslim travellers (Parahiyanti, 2023).
Laos experienced a 30% increase, rising from $2.7 million to $3.5 million, while Myanmar saw a 23% growth, escalating from $32.8 million to $40.3 million; however, their market shares remained minimal at 0.1% and 1.3%, respectively. The primary impediments are probably the absence of direct flights and insufficient promotion. Marketing tactics leveraging the Indonesian diaspora can be executed by integrating tourism components into diplomatic efforts, exemplified by Indonesian language instruction for foreign speakers in Laos (Raharja, 2023). In Myanmar, culinary diplomacy can be utilized by incorporating local food into city branding to enhance visitor attraction and bolster the local economy (Htet et al., 2024).
5. Discussion
The BCG Matrix classification provides important strategic implications for Indonesia's tourism development, particularly in managing ASEAN tourist markets with different growth dynamics and market shares. Each quadrant represents distinct strategic priorities for policymakers and tourism stakeholders. The quadrant positioning of each ASEAN nation's expenditure is illustrated in figure 2.
Improvements need to be made to the follow-up tactics for each quadrant of the BCG Matrix by adopting a strategy that is both more comprehensive and quantitative. Malaysia, Philippines, Thailand, Vietnam, and Myanmar are all considered to be Star countries. The fundamental objective for these countries is to preserve their market dominance while simultaneously improving tourist loyalty. It is necessary for the government and the tourism industry to work together in order to develop personalised tourism experiences. These experiences should include the provision of culturally and religiously-based services, such as halal food, transportation that is friendly to Muslims, and attractions that are tailored to the preferences of each individual nation. Expansion of loyalty programmes is possible through the formation of strategic alliances, which may include providing special discounts to customers who use credit cards or certain travel apps. In addition, the establishment of direct flight routes to alternative locations such as Yogyakarta, Lombok, or Labuan Bajo can attract visitors to explore multiple places.
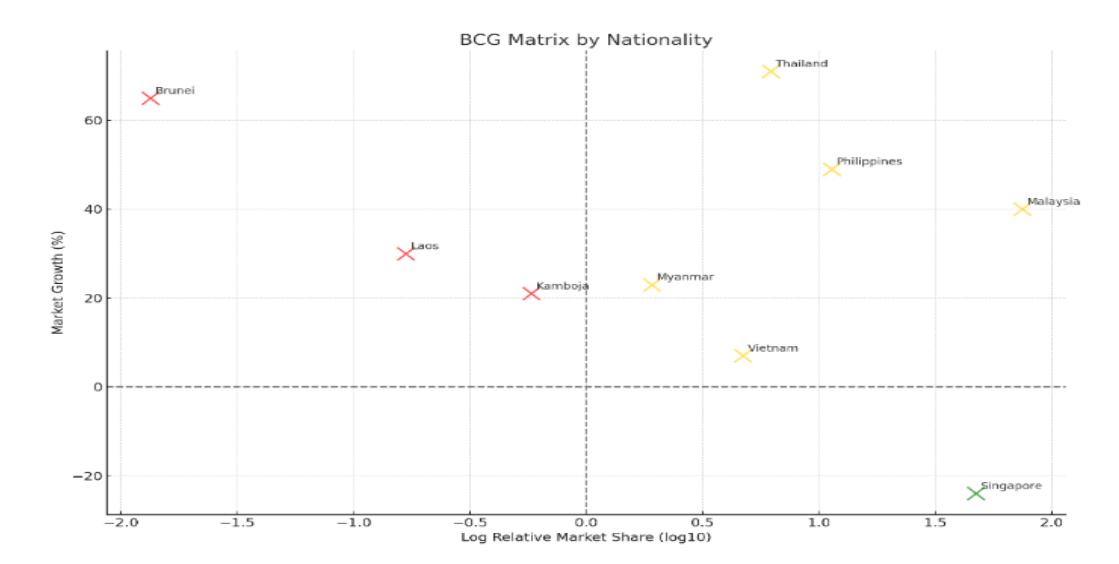
Figure 2. BCG Matrix Source: Researcher (2025)
Improvements need to be made to the follow-up tactics for each quadrant of the BCG Matrix by adopting a strategy that is both more comprehensive and quantitative. Malaysia, Philippines, Thailand, Vietnam, and Myanmar are all considered to be Star countries. The fundamental objective for these countries is to preserve their market dominance while simultaneously improving tourist loyalty. It is necessary for the government and the tourism industry to work together in order to develop personalised tourism experiences. These experiences should include the provision of culturally and religiously-based services, such as halal food, transportation that is friendly to Muslims, and attractions that are tailored to the preferences of each individual nation. Expansion of loyalty programmes is possible through the formation of strategic alliances, which may include providing special discounts to customers who use credit cards or certain travel apps. In addition, the establishment of direct flight routes to alternative locations such as Yogyakarta, Lombok, or Labuan Bajo can attract visitors to explore multiple places.
In the case of Singapore, which is the only country in the Cash Cow quadrant, the strategy ought to centre on effectively maximising revenue without making major investments. There is a tendency for Singaporean tourists to place a high value on convenience and efficiency; therefore, it is recommended that contactless payment options, online check-in, and support for both English and Mandarin be improved. Attracting them can be accomplished by offering short trip packages that feature premium themes such as wellness retreats, golf tourism, or gourmet experiences. Additionally, it is necessary to stimulate the upselling of business-class services, premium accommodations, or unique experiences (private tours). In addition, repeat visitor programmes that are implemented through email marketing or seasonal discounts can help to retain their visits, while family segments and expatriate segments may represent potential markets that have not yet been approached.
In the meantime, countries that come with a question mark (Brunei, Laos, and Cambodia) need to undergo a comprehensive review to establish whether they have the potential to become Stars or are not worth preserving. A market research study ought to be carried out to identify the primary obstacles, which may include a lack of promotion, restricted access to transportation, or a low attraction of the location. For example, targeting students, religious tourists, or the diaspora could be examples of niche marketing methods that could be used as potential solutions. Additionally, the government ought to build partnerships with local travel agents in these nations and provide
incentives such as subsidies for airfare or tour packages for groups. Experimenting with new destinations that have cultural linkages, such as halal tourism campaigns to Aceh for Brunei or ecotourism packages to Kalimantan for Laos, could be an appealing variant of the alternative.
It is also essential to take into consideration initiatives for regional collaboration, particularly for countries that are marked with a question mark. By way of illustration, the creation of combination travel packages between Thailand and Laos or Malaysia and Brunei could potentially boost the attraction of these destinations. To add insult to injury, the utilisation of digital technologies such as virtual tours or campaigns conducted through over-the-top (OTT) platforms can effectively communicate with prospective tourists who are not familiar with Indonesian sites. If growth does not improve after the implementation of strategic measures, it is worthwhile to consider redistributing resources to other industries that are more productive.
Monitoring and assessment on a consistent basis are necessary to guarantee that this plan will be successful. It is important to conduct regular analyses of key performance indicators (KPIs), which include the number of visits, the duration of stay, and the amount of money spent by tourists. Additionally, feedback from industry players and tourists from other countries ought to be utilised as a baseline for potential enhancements. The tourist potential of each ASEAN country may be maximised by Indonesia through the utilisation of a dynamic and data-driven approach. This includes both established countries such as Singapore and Malaysia as well as growing countries such as Laos and Cambodia.
6. Conclusion
This study indicates that ASEAN tourist expenditure in Indonesia has varied patterns, with Malaysia and Singapore leading in tourism revenue contributions. A BCG Matrix analysis effectively categorised tourist source countries into four strategic quadrants: Stars (Malaysia, Philippines, Thailand, Myanmar, and Vietnam), Cash Cows (Singapore), and Question Marks (Brunei, Laos, Cambodia). These data suggest that while several countries, like Brunei and Thailand, are undergoing swift expansion, their market share remains comparatively limited requiring targeted initiatives to enhance tourist visitation and expenditure.
This research underscores the necessity for a tailored strategy in the growth of Indonesian tourism. In the Stars quadrant, plans must prioritise enhancing tourist loyalty and broadening culture-oriented services. Concurrently, Cash Cows like Singapore must enhance income by optimising premium tour packages and improving service efficiency. Countries in the Question Marks quadrant necessitate more assertive market penetration strategies, including niche promotions and regional partnerships, but those in the Dogs quadrant may demand a reassessment of resource distribution. Future study can enhance the analysis by incorporating external elements such as visa policies and individual tourist preferences to formulate a more comprehensive approach.
References
Ab Rahman, S. A., Bachok, S., & Mahamod, L. H. (2023). EFFECTS OF TRAVEL CHARACTERISTICS ON TOURISM EXPENDITURE: A CASE STUDY OF MALAYSIA YOUNG OUTBOUND TOURISTS. Planning Malaysia, 21(1). DOI: 10.21837/PM.V21I25.1233.
Agarwal, V. B., & Yochum, G. R. (1999). Tourist spending and race of visitors. Journal of Travel Research, 38(2). DOI: 10.1177/004728759903800211.
- Agustina, N., Puspita, C. D., Arifatin, D., & Yordani, R. (2021). Application of Logistic Regression to Determine the Quality of Foreign Tourists to Indonesia. Journal of Physics: Conference Series, 1863(1). DOI: 10.1088/1742-6596/1863/1/012029.
- Ajisaputra, A., Soesetyo, H. A., & Juniarsa, N. (2023). Analisis Kontribusi Negara ASEAN dalam Menunjang Pariwisata Berkelanjutan di Indonesia. Jurnal EMA, 8(1). DOI: 10.51213/ema.v8i1.317.
- AKCADAG, M., & BOZKURT, T. (2021). Determining Consumers' Expenditure Types in Tourism Marketing: Turkey Example. The Eurasia Proceedings of Educational and Social Sciences, 22. DOI: 10.55549/epess.1040604.
- Alas, Y., & Anshari, M. (2021). Initiating brunei cross-border tourism (bcbt) as a gateway to borneo. International Journal of Asian Business and Information Management, 12(3). DOI: 10.4018/IJABIM.20210701.oa2.
- Alfarhan, U. F., Olya, H., & Nusair, K. (2023). How do prosperity and aspiration underlie leisure tourism expenditure patterns? Tourism Economics, 29(3). DOI: 10.1177/13548166211064215.
- Amir, S., Osman, M. M., Bachok, S., & Ibrahim, M. (2015). Understanding Domestic and International Tourists' Expenditure Pattern in Melaka, Malaysia: Result of CHAID Analysis. Procedia - Social and Behavioral Sciences, 172. DOI: 10.1016/j.sbspro.2015.01.386.
- Aprilia, S., Lionora, C. A., & Aprilistyan, S. F. (2023). Formulating Strategy Through Boston Consulting Group Matrix In The Tourism Industry. Barista : Jurnal Kajian Bahasa Dan Pariwisata, 10(02). DOI: 10.34013/barista.v10i02.1255.
- Artal-Tur, A., Navarro-Azorín, J. M., & Alamá-Sabater, L. (2023). The role of destination contextual effects in driving the expenditure of tourists: a multilevel spatial modelling approach. Regional Studies, 57(7). DOI: 10.1080/00343404.2022.2110578.
- Azizurrohman, M., Hartarto, R. B., Lin, Y.-M., & Nahar, F. H. (2021). The Role of Foreign Tourists in Economic Growth: Evidence from Indonesia. Jurnal Ekonomi & Studi Pembangunan, 22(2). DOI: 10.18196/jesp.v22i2.11591.
- Badan Pusat Statistik Indonesia. (2022). Statistik Indonesia Tahun 2022. Badan Pusat Statistik, 1101001.
- Bernal Escoto, B. E., Montero Delgado, N. I., & Rivera Aguirre, F. A. (2021). Strategic analysis of sustainable tourism in Baja California against COVID-19. Sustainability (Switzerland), 13(7). DOI: 10.3390/su13073948.
- Bondarenko, V. G. (2022). APPLICATION OF COMPUTER ENGINEERING IN FINANCIAL CALCULATIONS. Collection of Scientific Publications NUS, 488(1). DOI: 10.15589/znp2022.1(488).8.
- Brida, J. G., Lanzilotta, B., & Moreno, L. (2023). Compositional tourists' expenditure: Modeling through Dirichlet regression. Tourism Economics, 29(6). DOI: 10.1177/13548166221108819
- Chiu, C. C., & Lin, K. S. (2020). Rule-Based BCG Matrix for Product Portfolio Analysis. In Studies in Computational Intelligence (Vol. 850). DOI: 10.1007/978-3-030-26428-4_2.
- Cozzio, C., Tokarchuk, O., & Maurer, O. (2021). The effect of price bundling on tourists' extra expenditure: a mental budget approach. In Current Issues in Tourism (Vol. 24, Issue 20). DOI: 10.1080/13683500.2020.1849045.
- Disegna, M., & Osti, L. (2016). Tourists' expenditure behaviour: The influence of satisfaction and the dependence of spending categories. In Tourism Economics (Vol. 22, Issue 1). DOI: 10.5367/te.2014.0410.
- Gorb, O., Dorohan-Pysarenko, L., Yehorova, O., Yasnolob, I., & Doroshenko, A. (2022). Boston Consulting Group Matrix: Opportunities for Use in Economic Analysis. Scientific Horizons, 25(7). DOI: 10.48077/SCIHOR.25(7).2022.10.15.
- Grace, M., & Laserna, H. (2021). Service Quality Assessment Of Selected Heritage Sites in Cambodia, Indonesia, And Philippines By Tourists Towards The Development Of Service Delivery Improvement Plan Multicultural Education. In Multicultural Education (Vol. 7).
- Heriqbaldi, U., Esquivias, M. A., & Agusti, K. S. (2023). The role of cultural distance in boosting international tourism arrivals in ASEAN: a gravity model. Consumer Behavior in Tourism and Hospitality, 18(1). DOI: 10.1108/CBTH-12-2021-0288.
- Hinlayagan, K., & Olivar, K. (2023). The Socio-Psychological and Cultural Motives of ASEAN Tourist. Archives of Business Research, 11(1). DOI: 10.14738/abr.111.13695.
- Hor, C. (2021). Tourism Endowments, Institution Quality, and Inbound Tourists: A Panel Analysis of ASEAN. Tourism and Hospitality, 2(2). DOI: 10.3390/tourhosp2020013.
- Hossain, H., & Kader, M. A. (2020). An Analysis on BCG Growth Sharing Matrix. International Journal of Contemporary Research and Review, 11(10). DOI: 10.15520/ijcrr.v11i10.848.
- Htet, T., Husni, M. F. D., & Apriliani, F. D. (2024). Crafting urban identities: Local cuisine and city branding in Indonesia and Myanmar. Journal of City: Branding and Authenticity, 2(1), 30–51. DOI: 10.61511/jcbau.v2i1.2024.914.
- Khairiyah, N. (2020). MENEROPONG MUSLIM SIEM REAP DI KAMBOJA. An-Nufus, 2(2). DOI: 10.32534/annufus.v2i2.1697.
- Majority Does Not Guarantee the Muslim Visitors: Analysis of Halal Tourism Digital Information in Southeast Asian Muslim Majority Countries. (2023). Hong Kong Journal of Social Sciences, 60(No. 60 Autumn/Winter 2022). DOI: 10.55463/hkjss.issn.1021-3619.60.43.
- MARDIANA. (2012). Penawaran Dan Permintaan Pariwisata Istana Siak:Pendekatan Boston Consulting Group Matrix. Jurnal Sosial Ekonomi Pembangunan, 7.
- Maryamah, M., Septiana, R., Hanif, M., Suhalim, C. T., Syamil, F., & Putra, A. D. G. S. (2023). Perspektif Wisatawan Mancanegara (Wisman) Terhadap Pariwisata Indonesia menggunakan Latent Dirichlet Allocation (LDA). PROSIDING SEMINAR NASIONAL SAINS DATA, 3(1). DOI: 10.33005/senada.v3i1.104.
- Massidda, C., Piras, R., & Seetaram, N. (2022). Analysing the drivers of itemised tourism expenditure from the UK using survey data. Annals of Tourism Research Empirical Insights, 3(1). DOI: 10.1016/j.annale.2022.100037.
- Maureen, E. I., & Choirunnisa, M. A. (2020). The Progress of Indonesia-Brunei Darussalam 4 th Joint Commission Bilateral Cooperation. American Journal of Humanities and Social Sciences Research, 1, 242–246. www.ajhssr.com
- Mohajan, H. K. (2018). An Analysis on BCG Growth Sharing Matrix Environment View project Knowledge View project An Analysis on BCG Growth Sharing Matrix. Noble International Journal of Business and Management Research, 2(1).
- Mudarra-Fernández, A. B., Carrillo-Hidalgo, I., & Pulido-Fernández, J. I. (2019). Factors influencing tourist expenditure by tourism typologies: a systematic review. Anatolia, 30(1). DOI: 10.1080/13032917.2018.1495086.
- Nguyen, H. Q. (2021). Elasticity of tourism demand by income and price: evidence from domestic tourism of countries in ASEAN. Cogent Social Sciences, 7(1). DOI: 10.1080/23311886.2021.1996918.
- Nugraha, Y. R. P., & Naylah, M. (2023). Indonesian Tourism Demand by ASEAN Tourist: A Panel Data Analysis. Signifikan: Jurnal Ilmu Ekonomi, 12(1). DOI: 10.15408/sjie.v12i1.29894.
- Pan, X. (2023). An Analysis of the Strategies Applied to the Different Strategic Business Units of the BCG Matrix. Advances in Economics, Management and Political Sciences, 26(1). DOI: 10.54254/2754- 1169/26/20230599.
- Pang, W., & Zhu, S. (2018). A Study on the Outbound Tourism Preferences of China, Japan and South Korea for ASEAN Countries and Its Causes. DOI: 10.2991/iccessh-18.2018.295.
- Park, S., Woo, M., & Nicolau, J. L. (2020). Determinant Factors of Tourist Expenses. Journal of Travel Research, 59(2). DOI: 10.1177/0047287519829257.
- Pellegrini, A., Sarman, I., & Maggi, R. (2021). Understanding tourists' expenditure patterns: a stochastic frontier approach within the framework of multiple discrete–continuous choices. Transportation, 48(2). DOI: 10.1007/s11116-020-10083-2.
- Phan, K. T., Chen, S. H., Lee, J. M., & Pham, C. Van. (2024). Expenditure decisions of international tourists to Taiwan: application of the Heckman two-stage approach. Cogent Social Sciences, 10(1). DOI: 10.1080/23311886.2024.2318870.
- Pratama, B. S., Suryono, A. F., Auliyah, N., & Chamidah, N. (2024). COMPARISON OF LOCAL POLYNOMIAL REGRESSION AND ARIMA IN PREDICTING THE NUMBER OF FOREIGN TOURIST VISITS TO INDONESIA. Barekeng, 18(1). DOI: 10.30598/barekengvol18iss1pp0043-0052.
- Pratama, J., & Aprianto, W. (2022). Perancangan Video Animasi 2D Sejarah Kampung Vietnam Batam. Science Tech: Jurnal Ilmu Pengetahuan Dan Teknologi, 8(1). DOI: 10.30738/st.vol8.no1.a11925.
- Raharja, C. S. (2023). DIPLOMASI BUDAYA INDONESIA MELALUI PROGRAM BIPA (BAHASA INDONESIA BAGI PENUTUR ASING) DI LAOS TAHUN 2016-2022. Jurnal Pena Wimaya, 3(2). DOI: 10.31315/jpw.v3i2.10024.
- Ramadhania, N., Munandar, J., & Tapachai, N. (2021). Destination Choice Intention of Young Tourist: A Comparative Study Between Indonesia and Thailand. DOI: 10.4108/eai.14-9-2020.2304495.
- Rifai, N., & Kurniawan, T. (2023). The Influence of economic growth, exchange rate, and inflation on foreign tourist visits to Indonesia. Journal of Socioeconomics and Development, 6(2). DOI: 10.31328/jsed.v6i2.4860.
- Sabaya, Z. A. R., Lasalewo, T., & Uloli, H. (2023). STRATEGI PENGEMBANGAN USAHA MENGGUNAKAN METODE SWOT DAN BOSTON CONSULTING GROUP MATRIX. RADIAL : Jurnal Peradaban Sains, Rekayasa Dan Teknologi, 11(2). DOI: 10.37971/radial.v11i2.401.
- Santos, C., & Vieira, J. C. (2012). An analysis of visitors' expenditures in a tourist destination: OLS, quantile regression and instrumental variable estimators. Tourism Economics, 18(3). DOI: 10.5367/te.2012.0133.
- Sawitri, R. A. D., Eltivia, N., & Riwajanti, N. I. (2021). Forecasting the number of foreign tourists visiting Indonesia during the Covid-19 Pandemic. Journal of Sustainable Tourism and Entrepreneurship, 2(4). DOI: 10.35912/joste.v2i4.945.
- Smolčić Jurdana, D., & Soldić Frleta, D. (2017). Satisfaction as a determinant of tourist expenditure. Current Issues in Tourism, 20(7). DOI: 10.1080/13683500.2016.1175420.
- Štefko, R., Džuka, J., & Lačný, M. (2022). Psychological Factors of Tourist Expenditure: Neglected or Negligible? Frontiers in Psychology, 13. DOI: 10.3389/fpsyg.2022.942252.
- Supriono, S. (2017). Analisis Deskripsi Potensi Pariwisata Kota Batam Dalam Rangka Menjaring Wisatawan Mancanegara. Jurnal Pariwisata Terapan, 1(2). DOI: 10.22146/jpt.30150.
- Supriono, Topowijono, & Musadieq, M. A. (2017). PROBLEM IDENTIFICATION OF FOREIGN TOURIST DISTRIBUTION IN INDONESIA. Russian Journal of Agricultural and Socio-Economic Sciences, 67(7). DOI: 10.18551/rjoas.2017-07.13.
- Untari, D. T. (2019). Asean tourist in bali, indonesia; trend analysis the implementation of mathematical methods in tourism sector. International Journal of Scientific and Technology Research, 8(12).
- Wang, Y., Rompf, P., Severt, D., & Peerapatdit, N. (2006). Examining and identifying the determinants of travel expenditure patterns. International Journal of Tourism Research, 8(5). DOI: 10.1002/jtr.583.
- Wanga, Y., & Davidsonb, M. C. G. (2010). A review of micro-analyses of tourist expenditure. Current Issues in Tourism, 13(6). DOI: 10.1080/13683500903406359.
- Yudhistira, M. H., Sofiyandi, Y., Indriyani, W., & Pratama, A. P. (2021). Heterogeneous effects of visa exemption policy on international tourist arrivals: Evidence from Indonesia. Tourism Economics, 27(4). DOI: 10.1177/1354816619897150.