
1. Introduction
Transportation has become the backbone in facilitating the movement of goods and people from one place to another, forming a vital network that connects communities globally. Transportation is viewed as the movement of goods and people from their origin to their destination, creating important communication lines connecting various regions (Nasution, 2008). Meanwhile, Transportation is moving people and goods from one place to another with the help of humans or machines, enabling achieving goals with optimal time and cost (Widari, 2010). The development of transportation in the world is very slow, and changes occur gradually until finally, land, sea, and air transportation are created as they are today. Before transportation was discovered, humans traveled on foot, both long and short distances since ancient times. There has been a significant development in transportation requests each year (Permana & Prihatini, 2017). In supporting human activities, transportation is the most important means of transportation, such as shipping goods and services, passenger transportation services, and the economy. The development of the transportation system at this time has been a special concern from various perspectives. Some people utilize the development of transportation technology to facilitate and speed up movement in fulfilling all human life needs (Azis & Asrul, 2014). One of how transportation has been developed is in Jakarta (Indonesia) and Hainan (China).
A bus is a motorized vehicle that carries many passengers, usually more than eight people, including the driver. Buses are used for short, medium, and long-distance travel. Depending on their function, buses can be categorized into several types: city buses, intercity and inter-island buses, intercity buses within one province, tourist buses, and school buses. Physically, buses have larger dimensions than private cars, with varying numbers of seats. Buses are also usually equipped with various facilities such as air conditioning, comfortable seats, toilets, wireless internet, and entertainment systems to enhance the passenger experience. In the transportation sector, buses are an efficient and practical choice for transporting many people at once, reducing congestion, and supporting environmental sustainability by reducing emissions per person compared to private vehicles. Tourist buses are defined as a mode of land transportation designed explicitly for the needs of tourists by providing facilities that provide comfort, safety, and entertainment to passengers.
Tourist Buses have several types of buses consisting of, Mini Bus (Microbus), Medium Bus, Big Bus (Big Bus), Premium Bus (Luxury Bus), Double Decker Bus (Double Decker Bus), Sleeper Bus (Sleeper Bus). The bus used in Indonesia is the Double Decker (Double Decker Bus), which uses the concept of an open-top bus with a capacity of 50-60 passengers to attract more tourists and allow them to enjoy their tour. Using tourist buses is only intended for visitors who have tourist destinations, thus reducing the use of private vehicles for tourist purposes. The same thing applies to transportation in Hainan, China. Transportation Passenger tourism Hainan is a type of Medium Bus with a capacity of 20-35 passengers; this bus is a public transportation service specifically designed to facilitate tourist travel to various popular destinations on Hainan Island, China. This tourist bus usually has a route that connects major tourist attractions such as beaches, natural parks, cultural areas, and other tourist attractions, such as Sanya Bay, Yalong Bay, Wuzhizhou Island, and Nanshan Cultural Zone. The phenomenon of tourist buses in Indonesia and Hainan is a new experience that can present experiential marketing to visitors, increasing tourist satisfaction.
Experiential marketing is a strategy that encourages consumers to engage through their five senses (sense), emotions (feel), creative thinking (think), physical actions, behaviors, and lifestyles (act). It also enables them to connect with social contexts, cultures, and ways of life that reflect the brand, combining sensations, emotions, thoughts, and actions into meaningful experiences (Jannah et al., 2014). Experiential marketing is characterized by five main components, including Sense ( The Five Senses), a kind of experience that seems to give consumers experiences using their five senses—eyes, ears, tongue, skin, and nose. Through goods and services; Feel (Feelings) is a category of experience that is displayed to customers' emotions and sentiments in order to affect their mood; Think (Way of thinking) is a kind of experience that seems to foster problem-solving skills and encourages customers to use their imaginations; One kind of experience that seems to affect behavior and lifestyle is Action (Habit); another is Relate (Relationship), which emphasizes the development of favorable perceptions in the minds of consumers (Bisnari 2015).
Tourist satisfaction refers to an individual's emotional response after evaluating the actual experience against their prior expectations. (Philip, & Kevin, 2009) So, tourist satisfaction is a condition where desires or wishes, hopes, and needs can be met according to the expectations desired by the tourist. Tourist satisfaction is the leading indicator of the success of a tourist destination. In Indonesia's tourism context, tourist satisfaction is influenced by various factors, such as service quality, facilities, accessibility, tourist attractions, and experiences gained during the trip. With its natural and cultural wealth, Indonesia has great potential to attract domestic and international tourists. However, tourist satisfaction remains a significant challenge in managing the tourism sector.
Based on the description above, Experiential Marketing on Tourist Satisfaction on Double Decker Tourist Buses in Jakarta and Hainan, because the existence of Experiential Marketing and Tourist Satisfaction attracts customers to participate in experiencing the experience when using Double Decker Tourist Buses, especially in Jakarta and Hainan. So, a study was conducted with the title: "The Influence of Experiential Marketing on Tourist Satisfaction on Double Decker Tourist Buses in Jakarta and Hainan.
2. Literature Review
2.1. Tourist Bus
Makes it varied tourist buses are defined as a mode of land transportation designed explicitly for the needs of tourists by providing facilities that provide comfort, safety, and entertainment to passengers. Tourist buses function as a means of collective transportation that helps groups of tourists to specific destinations (Nugroho 2019). Meanwhile, Tourist buses are motorized vehicles designed to transport passengers on tourist trips with unique facilities that provide comfort and safety. Groups of tourists usually use this bus to visit various destinations with time and cost efficiency (Suwandi 2018).
2.2. Experiential Marketing
Experiential marketing provides customers with information and opportunities to experience the benefits obtained from the product or service but also arouses emotions and feelings that impact customer loyalty (Andreani, 2007). In detail states that the experience obtained by customers involves several approaches, namely: (1) Sense, style and verbal and visual cues that can convey a full impression are linked to sense. A marketer must select the appropriate hue in accordance with the company profile in order to create a powerful impression, whether through packaging, advertising, or a website. In addition, the right choice of style is also no less important. The combination of shape, color, and other elements form various styles, including minimalist, ornamental, dynamic, and static; (2) Feel (feeling) here is very different from sensory impressions because it related to a person's mood and emotional state. It's not just about beauty, but also about mood and emotions that can evoke happiness or even sadness.Think by thinking can stimulate a person's intellectual ability and creativity. Therefore, marketers need to be careful when taking the 'think' approach and not be provocative and excessive because it can be detrimental. Making customers think differently will result in them taking a different position. Sometimes, the position taken is contrary to the marketer's expectations; (3) Think can stimulate a person's intellectual abilities and creativity. Therefore, marketers need to be careful when applying a 'thinking' approach and should not be provocative or excessive, as this can be detrimental. Making customers think differently will cause them to take a different position. Sometimes, the position taken is contrary to the marketer's expectations; (4) Act is related to actual behavior and a person's lifestyle. This is related to how to get people to do something and express their lifestyle. There are various ways to communicate 'Act,' but the means must be carefully and appropriately selected to evoke the desired experience; and (5) Relate is related to culture and reference groups that can shape social identity. Marketers must be able to develop social identities for their customers through the products (goods or services) they offer.
2.3. Tourist Satisfaction
Tourist satisfaction is a benchmark for a company's success in providing consumer services. Satisfaction or dissatisfaction is a person's pleasure or disappointment from comparing their impression of a tourism product's accurate or actual performance with the expected performance (Sangadji and Sopiah, 2013). Consumers who are satisfied with the products or services purchased and used will return to use the services or products offered, building consumer loyalty (Zeithaml and Bitner 2013). Customer satisfaction is the extent to which tourist expectations perceive a product level. State that customer satisfaction is a person's feelings of satisfaction or disappointment that arise from comparing their perceived performance of a product (or result) with their expectations. (Kotler and Keller 2011). The attributes that make up satisfaction consist of the following:Suitability of Tourist Expectations Is the level of suitability between the product performance expected by the customer and that felt by the customer, including:
- a) Tourist Expectation Fulfillment is defined as the extent to which the performance of tourism products and services corresponds to or exceeds tourists' initial expectations. This construct reflects tourists' evaluations of the products received, the quality of services delivered by employees, and the adequacy of supporting facilities. Expectation fulfillment occurs when tourists perceive that the products meet their anticipated standards, the services provided by employees are satisfactory, and the available facilities effectively support the overall tourism experience.
- b) Repeat Business refers to tourists' intention to revisit or repurchase tourism-related products and services in the future. This intention is influenced by tourists' satisfaction with employee services, their perception of the value and benefits obtained from the tourism product, and the sufficiency of supporting facilities. When tourists experience consistent service quality and perceive meaningful value, they are more likely to develop repeat visitation intentions, indicating loyalty toward the destination or service provider.
- c) Willingness to Recommend describes tourists' inclination to recommend tourism products or services they have experienced to friends or family members. This inclination is shaped by satisfaction with service quality, the availability of adequate supporting infrastructure, and the perceived value gained from the tourism experience. Tourists who perceive high levels of fulfillment and satisfaction tend to engage in positive word-of-mouth communication, which plays a significant role in influencing others' travel decisions.
Therefore, the indicators of tourist satisfaction are conformity with tourist expectations, interest in returning to the tourist location, and recommendation of the tourist location to others.
3. Methods
This research employs the Smart PLS 3.2.9 software to do SEM analysis in a quantitative manner. Quantitative research is a research method based on positivism philosophy, which is used to study a specific population or sample; sampling techniques are generally conducted randomly, data collection
uses research instruments, and data analysis is quantitative/statistical to test predetermined hypotheses (Sugiyono 2018).
3.1. Data Collection
In determining the number of samples, researchers can use the criteria of the number of indicators multiplied by 5 (five) to 10 (ten) (Hair et al. 2013). Then, utilizing the Structural Equation Model (SEM) equation determines the recommended number of samples in the example, ranging from 100 -200 pieces. In this study, the number of indicators is 30, so if multiplied by 5, the number of samples is 150 respondents. The respondents for Indonesian tourist buses were 150, and Hainan China tourist buses were 150, so the total number of respondents was 300.
3.2. Data Analysis Methods
The research data collection technique used in this study was nonprobability sampling. Nonprobability sampling is an element in the population that does not have an equal chance of being selected as a sample (Ghozali 2016). Therefore, the number of people involved is unknown. The Sampling technique used is purposive sampling. The sample consists of people who can provide the desired information, whether they are the only ones who know or they meet the criteria determined by the researcher.
3.3. Framework and Hypothesis
The hypothesis in this study consists of five hypotheses that adjust to the five concepts of Tourist Buses in Jakarta City, Indonesia, with Sanya City, Hainan, China. The focus of this research is to compare tourist buses in Indonesia and Hainan, China, to examine experiential marketing, which consists of sense, think, feel, act, and relate.
Hypothesis of Indonesian Tourist Buses, including:
- H1: The Sense Variable of Tourist Buses in Jakarta City has a positive effect on the satisfaction of Indonesian tourists.
- H2: The Feel Variable of Tourist Buses in Jakarta City has a positive effect on the satisfaction of Indonesian tourists.
- H3: The Think Variable of Tourist Buses in Jakarta City has a positive effect on the satisfaction of Indonesian tourists.
- H4: The Act Variable of Tourist Buses in Jakarta City has a positive effect on the satisfaction of Indonesian tourists.
- H5: The Relate Variable of Tourist Buses in Jakarta City has a positive effect on the satisfaction of Indonesian tourists.
The hypothesis of Urban Tourism in Sanya, Hainan, China, including:
- HI: The Sense Variable of Tourist Buses in Sanya/Hainan has a positive effect on the satisfaction of Indonesian tourists.
- H2: The Feel Variable of Tourist Buses in Hainan has a positive effect on the satisfaction of Indonesian tourists.
- H3: The Think Variable of Tourist Buses in Hainan positively affects Indonesian tourists' satisfaction.
- H4: The Act Variable of Tourist Buses in Hainan positively affects Indonesian tourists' satisfaction.
- H5: The variable related to tourist buses in Hainan positively affects Indonesian tourists' satisfaction.
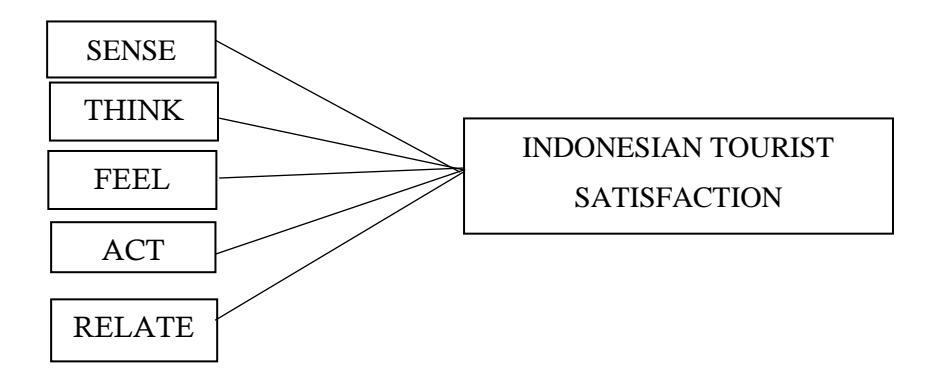
Figure 1. Framework
4. Discussion
In path analysis, hypothesis testing is used to determine the hierarchical position of each variable in a sequence of causal linkages as well as the causal relationships between several variables. The outcomes of computations utilizing regression analysis and evaluating the suggested hypothesis serve as the foundation for responding to inquiries regarding the relationship between variables. The beta coefficient, also known as the standard coefficient, shows path coefficients. Using particular criteria and significance values (probabilities), decisions are made on whether to test hypotheses. The path coefficients found are not significant if the probability is greater than 0.05, in which case Ho is accepted and H1 is rejected. On the other hand, Ho is rejected or H1 is accepted if the probability value is less than 0.05, indicating that the path coefficients found are significant.
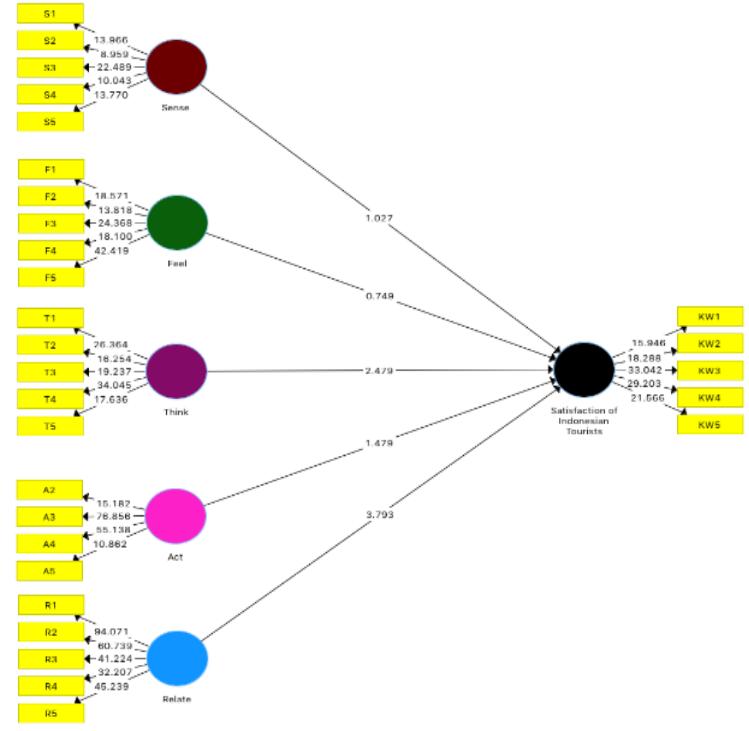
Figure 2. Bootstrapping Results of Tourist Buses in Indonesia Hypothesis Testing Source: Results of data processing with Smart PLS 3.2.9 Software (2024)
Table 1. Validity Test, Reliability Test, Average Variance Extracted (Ave) Test, Composite Reliability Test for Indonesian Tourism Bus
| Variable/Indicator | Loading Factor | AVE | CR | Cronbach's Alpha | Information | ||
|---|---|---|---|---|---|---|---|
| Tourist Buses in Indonesia | |||||||
| Sense | 0.605 | 0.885 | 0.841 | Reliable | |||
| S1 | 0.762 | Valid | |||||
| S2 | 0.768 | Valid | |||||
| S3 | 0.812 | Valid | |||||
| S4 | 0.758 | Valid | |||||
| S5 | 0.789 | Valid | |||||
| Feel | 0.682 | 0.914 | 0.883 | Reliable | |||
| F1 | 0.852 | Valid | |||||
| F2 | 0.744 | Valid | |||||
| F3 | 0.874 | Valid | |||||
| F4 | 0.763 | Valid | |||||
| F5 | 0.887 | Valid | |||||
| Think | 0.651 | 0.903 | 0.865 | Reliable | |||
| T1 | 0.816 | Valid | |||||
| T2 | 0.767 | Valid | |||||
| T3 | 0.779 | Valid | |||||
| T4 | 0.878 | Valid | |||||
| T5 | 0.791 | Valid | |||||
| Act | 0.767 | 0.929 | 0.897 | Reliable | |||
| A2 | 0.860 | Valid | |||||
| A3 | 0.937 | Valid | |||||
| A4 | 0.944 | Valid | |||||
| A5 | 0.748 | Valid | |||||
| Relate | 0.873 | 0.972 | 0.964 | Reliable | |||
| R1 | 0.963 | Valid | |||||
| R2 | 0.947 | Valid | |||||
| R3 | 0.939 | Valid | |||||
| R4 | 0.922 | Valid | |||||
| R5 | 0.900 | Valid | |||||
| Indonesian Tourist satisfaction | 0.624 | 0.892 | 0.849 | Reliable | |||
| KW1 | 0.743 | Valid | |||||
| KW2 | 0.727 | Valid | |||||
| KW3 | 0.846 | Valid | |||||
| KW4 | 0.834 | Valid | |||||
| KW5 | 0.794 | Valid | |||||
Source: Results of data processing with Smart PLS 3.2.9 Software (2024)
The results of this table explain the Validity Test, Reliability Test, Average Variance Extracted (AVE) Test, and Composite Reliability Test for tourist buses in Indonesia.
Table 2. Tourist Buses in Indonesia Hypothesis Testing Direct Effect Output of Partial Least Square
| Hypothesis Test | Original Sample Estimate | Standard Deviation | P Value | Hypothesis | |
|---|---|---|---|---|---|
| H1 | "Sense" Tourist Buses in Indonesia have a positive impact on | 0.085 | 0.083 | 0.305 | H1 Rejected |
| H2 | satisfaction of Indonesian tourists. "Feel" Tourist Buses in Indonesia have a positive impact on satisfaction of Indonesian tourists. | 0.051 | 0.067 | 0.454 | H2 Rejected |
| H3 | "Think" Tourist Buses in Indonesia have a positive impact on | 0.215 | 0.087 | 0.013 | H3 Accepted |
| H4 | satisfaction of Indonesian tourists. " Act" Tourist Buses in Indonesia have a positive impact on satisfaction of Indonesian tourists. | 0.121 | 0.082 | 0.140 | H4 Rejected |
| H5 | "Relate" Tourist Buses in Indonesia have a positive impact on satisfaction of Indonesian tourists. | 0.424 | 0.112 | 0.000 | H5 Accepted |
Source: Results of data processing with Smart PLS 3.2.9 Software (2024)
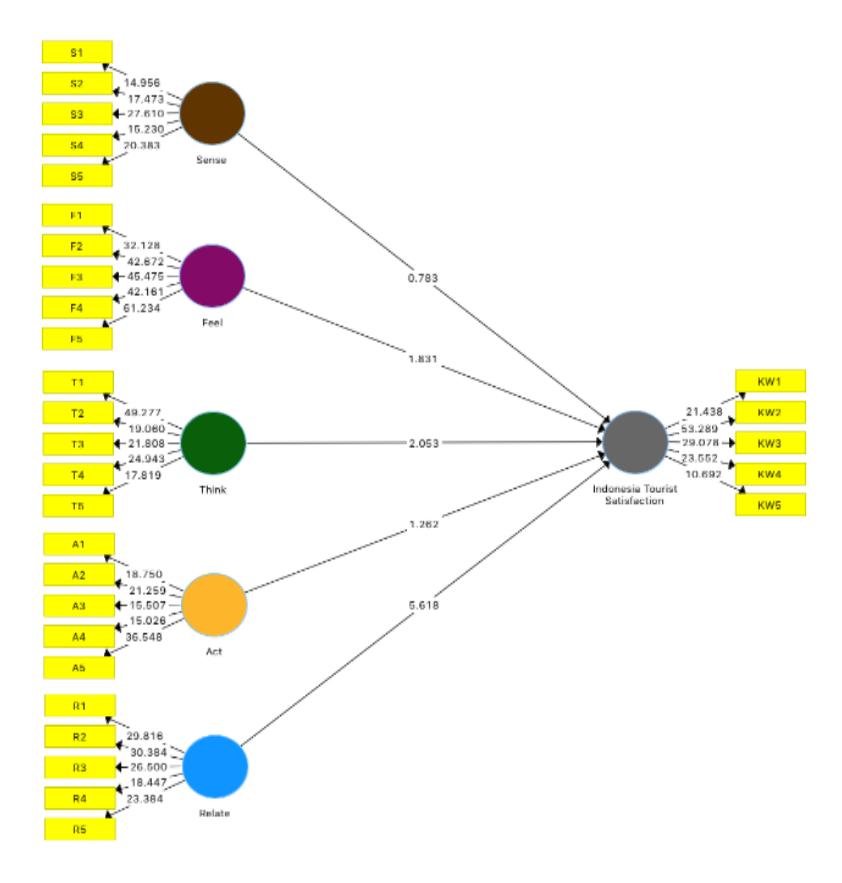
Figure 3. Bootstrapping Results of Tourist Buses in Hainan China Hypothesis Testing Source: Results of data processing with Smart PLS 3.2.9 Software (2024)
Table 3. Validity Test, Reliability Test, Average Variance Extracted (Ave) Test, Composite Reliability Test for Hainan China Tourist Bus
| Variable / indicator | Loading factor | AVE | CR | Cronbach's Alpha | Infomation |
|---|---|---|---|---|---|
| Tourist Buses in Hainan China | |||||
| Sense | 0.641 | 0.899 | 0.861 | Reliable | |
| S1 | 0.771 | Valid | |||
| S2 | 0.819 | Valid | |||
| S3 | 0.811 | Valid | |||
| S4 | 0.800 | Valid | |||
| S5 | 0.802 | Valid | |||
| Feel | 0.858 | 0.968 | 0.959 | Reliable | |
| F1 | 0.928 | Valid | |||
| F2 | 0.941 | Valid | |||
| F3 | 0.944 | Valid | |||
| F4 | 0.887 | Valid | |||
| F5 | 0.929 | Valid | |||
| Think | 0.659 | 0.906 | 0.870 | Reliable | |
| T1 | 0.880 | Valid | |||
| T2 | 0.771 | Valid | |||
| T3 | 0.790 | Valid | |||
| T4 | 0.825 | Valid | |||
| T5 | 0.788 | Valid | |||
| Act | 0.630 | 0.894 | 0.851 | Reliable | |
| A1 | 0.752 | Valid | |||
| A2 | 0.845 | Valid | |||
| A3 | 0.718 | Valid | |||
| A4 | 0.761 | Valid | |||
| A5 | 0.879 | Valid | |||
| Relate | 0.705 | 0.922 | 0.893 | Reliable | |
| R1 | 0.881 | Valid | |||
| R2 | 0.897 | Valid | |||
| R3 | 0.886 | Valid | |||
| R4 | 0.710 | Valid | |||
| R5 | 0.810 | Valid | |||
| Indonesian Tourist Satisfaction | 0.637 | 0.897 | 0.855 | Reliable | |
| KW1 | 0.735 | Valid | |||
| KW2 | 0.895 | Valid | |||
| KW3 | 0.815 | Valid | |||
| KW4 | 0.792 | Valid | |||
| KW5 | 0.742 | Valid |
The results of this table explain the Validity Test, Reliability Test, Average Variance Extracted (Ave) Test, and Composite Reliability Test for Hainan tourist buses in China.
Table 4. Tourist Buses in Hainan China Hypothesis Testing Direct Effect Output of Partial Least Square Partial Least Square
| Hypothesis Test | Original Sample Estimate | Standard Deviation | P Value | Hypothesis | |
|---|---|---|---|---|---|
| H1 | "Sense" Tourist Buses in Hainan | 0.056 | 0.072 | 0.434 | H1 Rejected |
| China has a positive impact on the | |||||
| satisfaction of Indonesian tourists. | |||||
| H2 | "Feel" Tourist Buses in Hainan | 0.102 | 0.056 | 0.068 | H2 Rejected |
| China has a positive impact on the | |||||
| satisfaction of Indonesian tourists. | |||||
| H3 | "Think" Tourist Buses in Hainan | 0.145 | 0.071 | 0.041 | H3 Accepted |
| China has a positive impact on the | |||||
| satisfaction of Indonesian tourists. | |||||
| H4 | "Act" Tourist Buses in Hainan | 0.113 | 0.090 | 0.207 | H4 Rejected |
| China has a positive impact on the | |||||
| satisfaction of Indonesian tourists. | |||||
| H5 | "Relate" Tourist Buses in Hainan | 0.542 | 0.096 | 0.000 | H5 Accepted |
| China has a positive impact on the | |||||
| satisfaction of Indonesian tourists. |
Source: Results of data processing with Smart PLS 3.2.9 Software (2024)
In path analysis, hypothesis testing is used to determine the hierarchical position of each variable in a sequence of causal linkages as well as the causal relationships between several variables. The findings of the calculation using regression analysis serve as the foundation for addressing the issue of the influence between variables while also testing the hypothesis. The beta coefficient (standardized coefficient) shows the path coefficient. Using the criteria and a significant value (probability), the hypothesis is tested. Ho is accepted or H1 is rejected if the likelihood is greater than 0.05, indicating that the route coefficient found is not significant. Conversely, if the probability value is less than 0.05, Ho is rejected or H1 is approved, indicating that the route coefficient obtained is significant.
4.1. X1 Sense
H1: The Sense Variable of Tourist Buses in Jakarta City and Hainan China, has a positive effect on the satisfaction of Indonesian tourists
The senses create sensory experiences through sight, hearing, touch, taste, and smell, providing impressions of beauty, pleasure, and satisfaction through stimulation, processes, and consequences. (Schmitt 1999) in (Jatmiko, R. D., & Andharini, S. N. 2013). Tourist satisfaction Based on the results, the original sample estimate for Sense is 0.085, with a standard deviation of 0.083. Still, the P-value is 0.305 because the p-value is> 0.05, and the hypothesis is rejected. This shows that in the "Sense" variable, tourists are not influenced by elements that stimulate their senses, such as bus interior design, aroma, sound, or lighting. These factors may not significantly increase the overall satisfaction of tourists in the tourist bus service studied, or tourists tend to prioritize other aspects of the tourists' travel experience.
Based on the results of Hainan China, the original sample estimate for Sense is 0.056 with a standard deviation of 0.072. Still, the P-Value is 0.434 because the p-value> 0.05, the hypothesis is rejected: "Sense (X1) does not affect tourist satisfaction on the Indonesian and Hainan Tourist Buses". The results of the same study conducted by Fetty (2024) and Sagitarini (2017), who conducted a study entitled The Influence of Experiential Marketing on Tourist Satisfaction at the Martha Christina Tiahahu Literacy Park stated that Sense for consumers functions to differentiate one product from another, to motivate buyers to act, and to form value in the product or service in the minds of consumers. This indicates that elements that stimulate tourists ' senses, such as bus interior design, aroma, sound, or lighting, do not significantly affect tourist satisfaction. These factors are unlikely to be the main focus in determining tourists' overall satisfaction with the tourist bus services studied. Tourists prioritize other aspects more relevant to their needs or experiences during the trip. The reasons why the "Sense" variable does not significantly affect tourist satisfaction may be due to several things. Tourists on Hainan tour bus services may prioritize functional aspects, such as travel comfort, safety, and service efficiency, rather than elements that stimulate the senses, such as interior design, lighting, aroma, or sound. In addition, the "Sense" elements tend to be considered as additional factors that have little effect on the core travel experience. This may also reflect that tourists have lower expectations for the aesthetic aspects of Hainan tour buses, so this element does not significantly impact their satisfaction.
4.2. X2 Feel
H2: The Feel Variable of Tourist Buses in Jakarta City and Hainan China, has a positive effect on the satisfaction of Indonesian tourists.
Feel can touch inner feelings and emotions to generate affective experiences so that there is a sense of joy and pride (Schmitt 1999) in (Jatmiko, R. D., & Andharini, S. N. 2013). Companies must consider consumers' or customers' moods and emotional conditions when touching inner feelings. Experiential marketing of the tourist bus variable "Feel" does not affect tourist satisfaction. Based on the results, the original sample estimate for Feel is 0.051 with a standard deviation of 0.067, but the P-value is 0.454 because the p-value> 0.05, the hypothesis is rejected. These results indicate that the emotional aspect intended to be built through the "Feel" variable does not significantly impact tourist satisfaction. Although experiential marketing strategies often involve creating a comfortable, friendly, or pleasant atmosphere to influence tourists' feelings, these elements did not significantly increase their level of satisfaction in this study. Most likely, tourists focus more on other factors that are more functional or cognitive than the emotional experience provided by Indonesian tourist bus services.
Based on Hainan China's Results, the original sample estimate for Sense is 0.102 with a standard deviation of 0.056. Still, the P-Value is 0.068 because the p-value>0.05, the hypothesis is rejected: "Feel (X2) does not affect tourist satisfaction on Jakarta and Hainan Tour Buses". Hainan tour buses may not provide enough space to create a deep emotional experience, so "Feel" stimuli such as emotional comfort, travel atmosphere, or extraordinary impressions during the trip do not significantly impact. Second, tourists tend to focus on practical elements such as physical facilities and service efficiency, so emotional aspects become less relevant, and travel by tour bus may not be specifically designed to trigger certain emotions.
4.3. X3 Think
H3: The Think Variable of Tourist Buses in Jakarta City and Hainan China, has a positive effect on the satisfaction of Indonesian tourists
Experiential Think. The essence of think marketing is to demand creative thinking from consumers about companies and brands. Thinking can stimulate a person's intellectual ability and creativity (Schmitt 1999) in (Jatmiko, R. D., & Andharini, S. N. 2013). The tourism bus marketing variable "Think" affects tourist satisfaction. Based on the results, the original sample estimate for Think is 0.215 with a standard deviation of 0.087 at a p-value of 0.013 and a standard p-value <0.05, so the hypothesis is accepted. These results indicate that the cognitive aspect offered by the "Think" variable has a significant positive impact on tourist satisfaction. The "Think" element in experiential marketing involves aspects that stimulate tourists' thinking or analytical power, such as interesting information or innovative methods to deliver services. With this cognitive stimulation, tourists may feel more involved and mentally challenged, increasing tourist satisfaction with Indonesian bus services.
Based on the results of Hainan China, the original sample estimate for Sense is 0.145, with a standard deviation of 0.071. Still, the P-value is 0.041 because the p-value>0.05, and the hypothesis is rejected: "Think (X3) affects tourist satisfaction on the Jakarta and Hainan Tour Bus". The variable that affects tourist satisfaction on the Hainan Tour Bus can be explained in several ways. "Think" involves experiences encouraging tourists to think creatively, realize specific values, or re-evaluate their experiences with the services provided. In the context of a tour bus, this element can appear through educational information, new experiences designed to stimulate tourists' thinking, or travel presentations that involve engaging narratives, such as tour guides providing in-depth insights into the places visited
4.4. X4 Act
H4: The Act Variable of Tourist Buses in Jakarta City and Hainan China, has a positive effect on the satisfaction of Indonesian tourists
Act marketing is designed to create consumer experiences about the physical body, lifestyle, and interactions with others (Schmitt 1999) in (Jatmiko, R. D., & Andharini, S. N. 2013). The variable "Act" does not affect tourist satisfaction in experiential marketing of tourist buses. Based on the results, the original sample estimate for Act is 0.121 with a standard deviation of 0.082 at a p-value of 0.140, but the p-value> 0.05, so the hypothesis is rejected. This shows that in the "Act" aspect, actions or activities involving tourists do not have a significant impact on tourist satisfaction.
Based on the results of Hainan China, the original sample estimate for Sense is 0.113, with a standard deviation of 0.090. Still, the P-value is 0.207 because the p-value is>0.05, and the hypothesis is rejected. "Act (X4) does not affect tourist satisfaction on Jakarta and Hainan Tour Buses." "Act" focuses on creating experiences that encourage changes in customer behavior, lifestyle, or interaction with the service. However, this element may be less relevant in the context of tour bus services because tourists use the service more as a means of transportation or a temporary experience, not as a platform to change their habits or lifestyles. Physical facilities or specific activities on the bus are limited and do not have a significant long-term impact. Tourists may focus more on the overall travel experience rather than the particular elements influencing their behavior or habits.
4.5. X5 Relate
H5: The Relate Variable of Tourist Buses in Jakarta City and Hainan China, has a positive effect on the satisfaction of Indonesian tourists
Relate marketing is a combination of think, feel, sense, and act marketing that aims to connect individuals with something outside themselves, with other people, other social groups in work, ethnicity, or lifestyle, and even with a broader social scope, such as country, society, and culture (Schmitt 1999) in (Jatmiko, R. D., & Andharini, S. N. 2013). Experiential marketing bus pariwisata indonesia variable "Relate" affects tourist satisfaction. Based on the results of the original sample estimate for Relate, it is 0.424 with a standard deviation of 0.112 at a p-value of 0.000 and a standard p-value <0.05, so the hypothesis is accepted. In relation, there is an influence in establishing social relationships with tourists, such as interacting with tour guides or fellow tourists, so that relationships/relationships are created, such as social interaction. The experience of social interaction is what makes a positive and memorable experience so that tourist satisfaction arises.
Based on the results of Hainan China, the original sample estimate for Sense is 0.542, with a standard deviation of 0.096. Still, the P-Value is 0.000 because the p-value >0.05, the hypothesis is rejected: "relate (X5) does not affect tourist satisfaction on the Jakarta and Hainan Tour Bus". "Relate" can emerge through the experience of sharing a trip with fellow tourists, effective communication between service providers and tourists, or storytelling that strengthens the cultural identity or tourist destination. Tourists feel more emotionally connected when they feel part of a community or have experiences relevant to their values.
5. Conclusion
From the results of this study, not all elements of experiential marketing significantly influence tourist satisfaction on tourist buses in Indonesia and Hainan, China. Of the five experiential marketing variables analyzed Sense, Feel, Think, Act, and Relate only Think and Relate were proven to have a significant effect on tourist satisfaction in both countries. This finding indicates that aspects involving cognitive stimulation (Think) as well as social relationships or a sense of togetherness (Relate) are essential in enhancing tourist satisfaction.
The Think and Relate variables showed the same influence on both Indonesian and Hainan tourist The thinking experience plays a vital role in tourist satisfaction and is created, for example, when a tour guide provides knowledge about the places visited, such as streets, landmarks, or buildings. Meanwhile, the connected experience is developed through communication and interaction among fellow tourists.
Table 5. Hypothesis Conclusion
| Testing Hypothesis Test | Indonesia | Hainan, China | |||
|---|---|---|---|---|---|
| Estimate | P-Value | Estimate | P-Value | ||
| H1 | "Sense" Tourist Buses in Indonesia | 0.085 | 0.305 | 0.056 | 0.434 |
| and Hainan Chaina has a positive | |||||
| influence on Indonesian Tourist | |||||
| satisfaction | |||||
| H2 | "Feel" Tourist Buses in Indonesia | 0.051 | 0.454 | 0.102 | 0.068 |
| and Hainan China has a positive | |||||
| influence on Indonesian Tourist | |||||
| satisfaction | |||||
| H3 | "Think" Tourist Buses in | 0.215 | 0.013 | 0.145 | 0.041 |
| Indonesia and Hainan China has a | |||||
| positive influence on Indonesian | |||||
| Tourist satisfaction | |||||
| H4 | "Act" Tourist Buses in Indonesian | 0.121 | 0.140 | 0.113 | 0.207 |
| and Hainan China has a positive | |||||
| influence on Indonesian Tourist | |||||
| satisfaction | |||||
| H5 | "Relate" Tourist Buses in | 0.424 | 0.000 | 0.542 | 0.000 |
| Indonesia and Hainan China has a | |||||
| positive influence on Indonesian | |||||
| Tourist satisfaction | |||||
In both contexts, the "Think" and "Relate" variables significantly influence tourist satisfaction. In Indonesia, tourist buses are supported by experienced tour guides who create unique experiences and provide valuable knowledge during the trip. Similarly, in Hainan, the Think variable shows the same
impact, where bilingual tour guides fluent in Indonesian and English help tourists understand explanations without language barriers, thus enriching their experience.
The relate aspect reflects the creation of social interaction and mutual understanding between tourists, which contributes directly to satisfaction. Overall, this study confirms that experiential marketing significantly affects tourist satisfaction in both countries. Pleasant and memorable experiences during tourist bus trips can strengthen positive perceptions of the destinations visited as well as the transportation services used.
References
- Andreani, F. (2007). Experiential Marketing (Sebuah Pendekatan Pemasaran). Jurnal Manajemen Pemasaran, 2(1).
- Azis, I., & Asrul, A. (2014). Dampak Perkembangan Transportasi. Dalam Budi Santoso (Ed.), Perkembangan teknologi dan masyarakat modern (pp. 75–90).
- Bisnari, S. (2015). Experiential marketing: Strategi pemasaran modern untuk membangun loyalitas konsumen.
- Dhevi, N. P. W. S. (2021). Pengaruh brand image, promosi dan kualitas pelayanan terhadap keputusan penggunaan jasa pada Fast Boat Sekar Jaya. Doctoral dissertation, Universitas Mahasaraswati Denpasar.
- Dimyati, M. (2014). Peranan Experiential Marketing dan Kepuasan Pasien dalam Menciptakan Loyalitas Pasien Rumah Sakit Fatimah Banyuwangi. Jurnal Ekonomi Akuntansi dan Manajemen, 13(2).
- Hair, J. F., Black, W. C., Babin, B. J., & Anderson, R. E. (2013). Multivariate data analysis. Essex: Pearson Education Limited.
- Jannah, N., Farida, A., & Yuniarti, E. (2014). Pengaruh experiential marketing terhadap kepuasan dan loyalitas pelanggan di restoran Fast Food X Kota Malang. Jurnal Administrasi Bisnis, 48(3), 239–250.
- Jatmiko, R. D., & Andharini, S. N. (2013). Analisis experiential marketing dan loyalitas pelanggan jasa wisata (Studi pada Taman Rekreasi Sengkaling Malang). Jurnal Manajemen dan Kewirausahaan, 14(2), 128–137.
- Kotler, P., & Keller, K. L. (2009). Marketing management (14th ed.). Pearson.
- Kotler, P., & Keller, K. L. (2011). Marketing management. New Jersey: Pearson Education.
- Mahendra, M., Putra, I. N. T. D., & Bagiastra, I. K. (2024). Pengaruh bukti fisik (tangible) dan daya tanggap (responsiveness) terhadap kepuasan wisatawan Desa Wisata Dusun Sade Kabupaten Lombok Tengah. Journal of Responsible Tourism, 3(3), 1213–1222.
- Nasution, M. (2008). Transportasi dan pembangunan. Yogyakarta: Andi.
- Nugroho, A. (2019). Manajemen transportasi pariwisata. Yogyakarta: Gadjah Mada University Press.
- Permana, A., & Prihatini, S. (2017). Tren permintaan transportasi di Indonesia. Transportasi dan Logistik Indonesia, 3(1), 25–38.
- Prajitno, S. B. (2013). Metodologi Penelitian Kuantitatif. Jurnal UIN Sunan Gunung Djati Bandung, 1– 29.
- Pratama, R. A., Rahayu, S., & Yamalay, F. (2022). Pengaruh citra merek dan promosi terhadap loyalitas wisatawan melalui variabel intervening kepuasan wisatawan Danau Shuji di Kabupaten Muara Enim. Jurnal Nasional Manajemen Pemasaran & SDM, 3(3), 119–128.
Sangadji, E. M., & Sopiah. (2013). Perilaku konsumen: Pendekatan praktis. Yogyakarta: Penerbit Andi.
Sugiyono. (2018). Metode penelitian kombinasi (mixed methods). Bandung: CV Alfabeta.
Suwandi, S. (2018). Peran transportasi dalam pengembangan pariwisata di Indonesia. Jakarta: Gramedia.
Wibowo. (2023, Mei 22). Bus wisata gratis Monas–PIK beroperasi setiap hari mulai 22 Mei. Retrieved from https://travel.kompas.com/read/2023/05/22/180000327/bus-wisata-gratis-monas-pikberoperasi-setiap-hari-mulai-22-mei-2023
Widari, S. (2010). Konsep dasar transportasi. Transportasi Indonesia, 5(2), 45–55.
Zeithaml, V. A., & Bitner, M. J. (2013). Services marketing: Integrating customer focus across the firm. New York: McGraw-Hill Education.