1. Introduction
The global tourism industry plays a crucial role in economic development, contributing 10.4% to the global GDP and generating over 330 million jobs worldwide in 2022 (Wickramasinghe & Naranpanawa, 2023). Post-pandemic tourism has experienced a resurgence, with emerging markets like Sri Lanka becoming prime destinations due to their rich cultural heritage, tropical landscapes, and growing appeal among international tourists. The global tourism industry has been significantly impacted by the COVID-19 pandemic, but destinations with diverse natural and cultural offerings, such as Sri Lanka, have seen a surge in visitor interest as the world gradually recovers (Wijesekara et al., 2022). Among key tourist markets, Russian travelers have become increasingly significant. Russian outbound tourism has seen substantial growth, with over 22.5 million international trips made in 2022 (Azmi et al., 2023), significantly impacting global tourism economies, including Sri Lanka. This growing interest calls for a deeper understanding of the factors driving Russian tourists' decisions.
Sri Lanka, renowned for its natural beauty, tropical climate, and rich cultural heritage, has emerged as a popular destination among a growing number of Russian tourists in recent years (Mooser et al., 2022). With its diverse landscapes, ancient cultural sites, and warm hospitality, the island nation has become an increasingly attractive travel option for Russian travelers seeking new and unique experiences. According to the Sri Lanka Tourism Development Authority, Russian tourist arrivals increased by 206% between 2018 and 2023 (SLTDA, 2023), making Russia one of the top three source markets. While leisure and vacation remain the primary purposes for travel, the motivations behind these visits are diverse and complex, driven by both internal and external factors. Understanding these factors is crucial for the development of targeted marketing strategies that can enhance satisfaction and destination loyalty.
Despite extensive research on tourism motivations, several important gaps remain in the literature. First, most prior studies examining push–pull travel motivations have focused on destinations in Europe, North America, or Southeast Asia, with limited attention given to emerging tourism destinations such as Sri Lanka. Second, research specifically examining Russian tourists remains scarce, despite Russia being one of the fastest-growing inbound tourist markets to Sri Lanka in recent years. Third, existing studies often examine travel motivation and loyalty independently, while the mediating role of tourist satisfaction in linking these constructs remains underexplored in postpandemic tourism contexts. Addressing these gaps is important for understanding how evolving tourist motivations influence destination loyalty in emerging destinations recovering from the COVID-19 pandemic. The objectives of this study are (1) To examine the influence of push travel motivations on tourist satisfaction among Russian tourists visiting Sri Lanka; (2) To evaluate the impact of pull travel motivations on tourist satisfaction; (3) To analyze the effect of tourist satisfaction on destination loyalty; and (4) To investigate the mediating role of tourist satisfaction in the relationship between travel motivations and destination loyalty.
This study aims to fill these gaps by examining the influence of both push and pull factors on Russian tourists' satisfaction and loyalty to Sri Lanka as a travel destination. Push factors, such as the desire to escape routine and enhance self-esteem, are internal motivations that compel tourists to travel. Pull factors, such as Sri Lanka's favorable climate, beaches, and historical sites, attract tourists to a specific destination. This study employs Partial Least Squares Structural Equation Modeling to analyze the direct and indirect effects of these motivators on satisfaction and loyalty.
2. Literature Review
2.1. Push and Pull Motivations in Tourism
The push-pull framework of tourism motivation, originally developed by Dann in 1977 (Cengizci et al., 2020), is a widely used approach to understand why individuals travel. Push motivations refer to internal, psychological factors that compel individuals to seek travel experiences, such as escaping routine, enhancing self-esteem, or fulfilling a desire for novelty. In contrast, pull motivations are external factors, including the attractions, climate, and cultural uniqueness of a destination, that draw individuals to specific locations (Nikjoo & Ketabi, 2015). This theoretical framework has been applied across diverse cultural contexts, but its application to Russian tourists visiting Sri Lanka remains underexplored.
The push–pull framework has remained one of the most widely applied theoretical approaches in tourism motivation research. While push factors represent internal psychological forces that motivate individuals to travel, pull factors represent the destination attributes that attract tourists to a particular location (Dann, 1977; Crompton, 1979). Subsequent research has demonstrated that these two sets of motivations operate simultaneously rather than independently, shaping both destination choice and travel experience (Klenosky, 2002; Prayag & Ryan, 2012). In the context of contemporary tourism, particularly after the COVID-19 pandemic, internal motivations such as the desire for relaxation, well-being, and escape from daily stress have gained greater importance as travelers increasingly seek meaningful and restorative travel experiences (Wen et al., 2020; Neuburger & Egger, 2021).
Research has consistently shown that travelers are motivated by psychological needs such as relaxation, self-discovery, and social interaction (Iso-Ahola, 1982; Garg & Pandey, 2020; Cengizci et al., 2020; McNeely et al., 2020; Albayrak et al., 2018; Frolova et al., 2017; Nikjoo & Ketabi, 2015; Çetin & Bilgihan, 2015; Šimková & Holzner, 2014). Russian tourists, for example, may seek Sri Lanka as a destination to escape the colder climates of Russia and engage in personal growth or meaningful social exchanges. These intrinsic push factors have been found to strongly influence travel satisfaction.
Pull factors include the tangible and intangible features of a destination, such as its natural beauty, cultural heritage, and tourism infrastructure (Rice & Khanin, 2019; Simpson, 2017; Nikjoo & Ketabi, 2015; Correia et al., 2013). For instance, the beaches of Sri Lanka, its tropical climate, and historical attractions such as ancient Buddhist temples have been identified as key pull factors for international tourists (Gidebo, 2021). However, the relative importance of these factors can vary depending on the tourist's background and travel motivations. Russian tourists, in particular, are drawn to destinations that offer both cultural enrichment and leisure activities.
Although numerous studies have explored push–pull motivations in tourism, most empirical research has focused on well-established destinations in Europe and Southeast Asia (Prayag & Ryan, 2012; Soldatenko & Backer, 2019). Limited research has examined how these motivations influence tourist behavior in emerging tourism destinations such as Sri Lanka. Furthermore, studies focusing specifically on Russian outbound tourists remain relatively scarce despite the increasing importance of this market in global tourism flows (Cengizci et al., 2020). Addressing this gap is important for understanding how internal and external motivations influence travel experiences and behavioral intentions in the post-pandemic tourism environment.
2.2. Travel Satisfaction
Travel satisfaction has been widely examined in tourism research as a key determinant of tourists' post-consumption evaluation of their travel experiences. The concept is often explained through Expectation-Disconfirmation Theory, which suggests that satisfaction arises when actual travel experiences meet or exceed tourists' initial expectations (Oliver, 1980; Oliver & Winer, 1987). When a destination successfully fulfills tourists' expectations, positive emotional responses are generated, leading to higher levels of satisfaction and stronger behavioral intentions such as revisit intentions and recommendations (Song et al., 2012; Su et al., 2020). In tourism research, satisfaction is therefore regarded as tourists' overall evaluation of whether their actual travel experience meets or exceeds their pre-trip expectations, with important consequences for future behavioral intentions. Satisfaction is typically defined as the extent to which the actual travel experience meets or exceeds the traveler's pre-trip expectations (Thong et al., 2020; Khan & Hashim, 2020). High levels of satisfaction often lead to repeat visits, positive word-of-mouth, and greater destination loyalty.
Research has shown that push factors, such as the need for self-fulfillment and relaxation, often result in higher levels of travel satisfaction (Fajriyati et al., 2020; Satyarini et al., 2020; Rice & Khanin, 2019; Park et al., 2018; R & Goel, 2017). Similarly, pull factors, like the availability of recreational activities or the beauty of a destination, are also crucial in enhancing tourists' experiences (Cengizci et al., 2020; Nikjoo & Ketabi, 2015). In Sri Lanka, a combination of pristine beaches, rich cultural heritage, and warm hospitality plays a significant role in creating memorable experiences for Russian tourists.
Prior studies have established the critical relationship between satisfaction and future behavioral intentions. Tourists who are satisfied with their travel experience are more likely to exhibit loyalty, recommend the destination to others, and consider returning (Ardani et al., 2019). The current study seeks to explore the unique intersection of push and pull motivations and their combined effect on satisfaction among Russian tourists in Sri Lanka.
Recent tourism studies have increasingly emphasized the importance of satisfaction as a mechanism linking travel motivations to behavioral outcomes. Motivational factors influence tourists' expectations before the trip, while the actual travel experience determines whether these expectations are fulfilled (Prayag et al., 2017; Su et al., 2020). As a result, satisfaction acts as a critical intermediary through which travel motivations influence subsequent behavioral intentions such as loyalty, revisit intention, and positive word-of-mouth. This relationship suggests a sequential mechanism in which travel motivations shape tourists' expectations before the trip, the travel experience determines satisfaction during the visit, and satisfied tourists subsequently develop loyalty toward the destination. In this sense, satisfaction functions as a psychological evaluation stage that transforms motivational drivers into behavioral outcomes such as revisit intention and positive word-of-mouth (Yoon & Uysal, 2005; Prayag et al., 2017).
2.3. Destination Loyalty
Destination loyalty refers to a tourist's willingness to revisit a destination and recommend it to others, and it is often seen as a critical metric of success in tourism management (Hung et al., 2021; Cengizci et al., 2020). Research on loyalty in tourism has evolved to incorporate multiple dimensions, including cognitive, affective, and conative loyalty (Cruz-Milán, 2023; Tammubua & Surapto, 2021; Resino et al., 2020). Cognitive loyalty is based on a tourist's knowledge and beliefs about a destination, affective loyalty stems from emotional attachments, and conative loyalty reflects behavioral intentions such as returning to the destination.
Destination loyalty has been widely examined as a key indicator of long-term tourism sustainability because loyal tourists are more likely to revisit a destination and recommend it to others (Yoon & Uysal, 2005; Chen & Tsai, 2007). Loyalty in tourism is often conceptualized as a multidimensional construct consisting of cognitive loyalty (beliefs about a destination), affective loyalty (emotional attachment), and conative loyalty (behavioral intention to revisit) (Oliver, 1999; Cruz-Milán, 2023). Understanding the drivers of destination loyalty is therefore crucial for tourism managers seeking to maintain competitive advantage in increasingly competitive tourism markets.
Studies have shown that satisfaction mediates the relationship between travel motivations and loyalty. For example, Sulkaisi et al. (2021) demonstrated that satisfaction significantly influences the likelihood of a tourist recommending a destination to friends and family. In the context of Russian tourists visiting Sri Lanka, satisfaction with the overall travel experience, including aspects such as accommodation, transportation, and local attractions will likely enhance loyalty behaviors such as repeat visits and recommendations.
However, pull motivations, such as attractions and services, may not always directly translate into loyalty. Research by Tammubua and Surapto (2021) suggests that while tourists may be attracted to a destination for its external features, loyalty is more significantly influenced by internal satisfaction, which is shaped by how well the destination meets personal motivations (push factors).
2.4. Theoretical Underpinnings of Push-Pull Motivation and Loyalty
The Push-Pull Motivation Theory (Dann, 1977) has served as a foundational framework in tourism studies, providing insights into how internal desires and external attractions jointly influence travel behavior. Push factors represent intangible motivators like the need for escape, novelty, and selfdevelopment, while pull factors include tangible elements such as climate, cultural heritage, and tourist infrastructure.
Building on the push-pull theory, the Expectation-Disconfirmation Theory (Oliver & Winer, 1987) suggests that satisfaction arises from the comparison between pre-trip expectations and post-trip experiences. When a destination exceeds expectations, tourists are likely to feel satisfied and develop a stronger emotional attachment to the location, leading to increased destination loyalty.
This study extends these theoretical perspectives by examining how push and pull motivations interact to influence satisfaction and loyalty in the unique context of Russian tourists visiting Sri Lanka. The inclusion of cultural and post-pandemic travel nuances adds depth to the understanding of how tourism behaviors may shift in the coming years. Although prior research has established relationships between travel motivations, satisfaction, and destination loyalty, empirical findings remain mixed regarding the direct influence of destination attributes on loyalty behavior. Some studies suggest that pull factors directly influence loyalty, while others argue that their influence is primarily indirect through satisfaction (Yoon & Uysal, 2005; Prayag & Ryan, 2012). These inconsistencies highlight the need for further empirical investigation, particularly in emerging tourism destinations and post-pandemic travel contexts.
Despite extensive research on tourism motivations and tourist behavior, limited empirical work has simultaneously examined travel motivations, tourist satisfaction, and destination loyalty within emerging tourism destinations. First, empirical research examining the relationship between travel motivations, satisfaction, and destination loyalty has largely focused on established tourism destinations, with limited attention given to emerging destinations such as Sri Lanka. Second, studies examining Russian outbound tourists remain relatively scarce despite their increasing importance in global tourism markets. Third, limited research has examined the mediating role of tourist satisfaction in linking travel motivations and destination loyalty in post-pandemic tourism contexts. Addressing these gaps will contribute to a deeper understanding of tourist behavior in emerging tourism destinations recovering from the COVID-19 pandemic.
3. Research Model and Hypotheses
3.1. Research Model
This study's theoretical model integrates the Push-Pull Motivation Theory and Expectation-Disconfirmation Theory to examine the direct and indirect effects of travel motivations on satisfaction and destination loyalty. Push motivations represent intrinsic psychological needs, while pull motivations refer to the external attributes of a destination that attract tourists.
The conceptual framework assumes that both push and pull factors influence travel satisfaction. However, it hypothesizes that satisfaction plays a mediating role between these motivators and destination loyalty. Additionally, the model posits that destination loyalty is primarily driven by the fulfillment of push motivations, mediated by satisfaction. Below, Figure 1 is the conceptual framework that outlines the hypothesized relationships between push/pull motivations, travel satisfaction, and destination loyalty.
3.2. Push Motivations and Travel Satisfaction
Push motivations, such as the desire to escape routine, improve self-esteem, or engage in meaningful social interactions, are intrinsic drivers of tourist behavior. Prior studies have shown that these psychological needs strongly influence tourists' emotional and cognitive responses to travel (Güzel et al., 2020; Nikjoo & Ketabi, 2015; Chindaprasert et al., 2015). Thus, it is expected that push factors will have a positive and significant impact on travel satisfaction,
H1: Push motivations have a significant positive effect on travel satisfaction among Russian tourists in Sri Lanka.
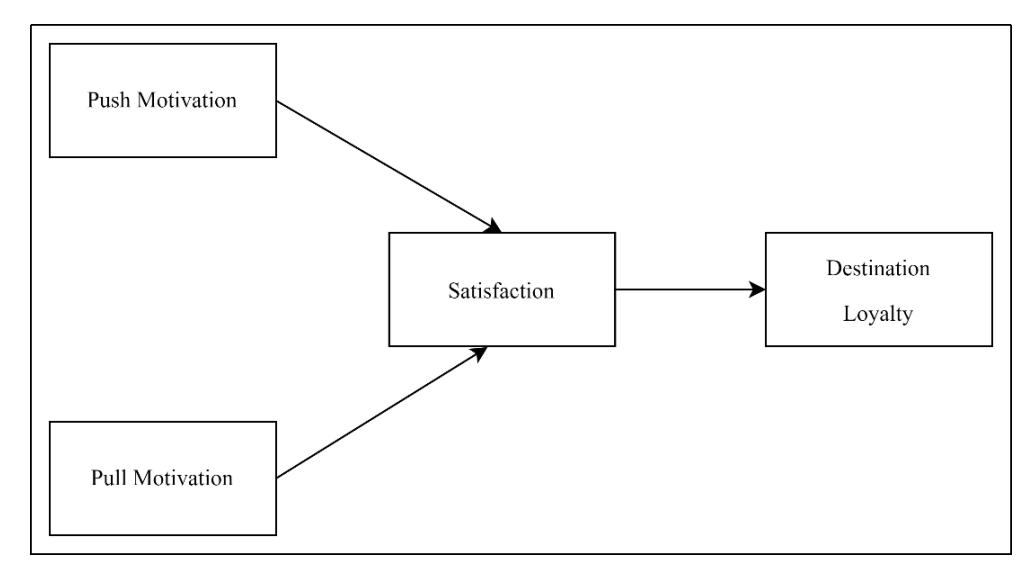
Figure 1. Conceptual Framework
3.3. Pull Motivations and Travel Satisfaction
Pull motivations, such as favorable climate, cultural heritage, and recreational opportunities, are destination-specific attractions that influence tourists' decisions (Cengizci et al., 2020; Rice & Khanin, 2019; Soldatenko & Backer, 2019; Said & Maryono, 2018). These factors create a context that enhances the overall travel experience, leading to greater satisfaction,
H2: Pull motivations have a significant positive effect on travel satisfaction among Russian tourists in Sri Lanka.
3.4. Travel Satisfaction and Destination Loyalty
Satisfaction is considered a key determinant of loyalty in tourism. Tourists who are satisfied with their experiences are more likely to revisit the destination and recommend it to others (Arismayanti et al., 2020; Khan & Hashim, 2020; Fajriyati et al., 2020; Bulatović, 2020). Therefore, it is hypothesized that,
H3: Travel satisfaction has a significant positive effect on destination loyalty among Russian tourists in Sri Lanka.
3.5. Push Motivations, Satisfaction, and Destination Loyalty
Push motivations are expected to influence destination loyalty through satisfaction. Tourists whose psychological needs are fulfilled are more likely to develop a favorable attitude towards the destination, mediated by their satisfaction (Japutra & Keni, 2020; Pestana et al., 2020). Specifically, it is hypothesized that travel satisfaction will mediate the relationship between push motivations and destination loyalty among Russian tourists in Sri Lanka.
H4: Travel satisfaction mediates the relationship between push motivations and destination loyalty among Russian tourists in Sri Lanka.
3.6. Pull Motivations, Satisfaction, and Destination Loyalty
While pull factors enhance satisfaction, they may not directly result in loyalty unless tourists are satisfied with their overall experience (Cengizci et al., 2020; Rice & Khanin, 2019). Hence, the following hypothesis is proposed,
H5: Travel satisfaction mediates the relationship between pull motivations and destination loyalty among Russian tourists in Sri Lanka.
4. Research Methodology and Data Analysis
4.1. Questionnaire Design
The questionnaire used in this study was designed to measure the key variables related to push and pull travel motivations, travel satisfaction, and destination loyalty. All items were measured using a 5 point Likert scale. The design and the variables are grounded in existing literature, ensuring the reliability and validity of the measures. Table 1 summarizes the variables, indicators, specific question items, and their sources.
Table 1. Operationalization Table
| Measurement (Likert Scale) | References | ||
|---|---|---|---|
| 1. | Traveling is reliving good memories | ||
| 2. | Traveling get rid of stress | ||
| (Güzel et al., | |||
| 1. | I'm proud to be a visitor to Sri Lanka | 2020) | |
| 3 = Neutral | (Nikjoo & | ||
| 4 = Agree | Ketabi, 2015) | ||
| 1. | Like to learn new things | (Chindaprasert | |
| 2. | Like to express personal comments | et al., 2015) | |
| the money spent | |||
| 3. | Believe that historical sites play a significant role | (Cengizci et | |
| al., 2020) | |||
| (Rice & Khanin, 2019) | |||
| (Soldatenko & | |||
| Backer, 2019) | |||
| activities such as swimming, sunbathing, surfing, | |||
| snorkeling, or beach sports? | (Said & | ||
| Maryono, | |||
| 2018) | |||
| attractions | |||
| Dependent Variable | |||
| (Arismayanti | |||
| et al., 2020) | |||
| (Khan & | |||
| Hashim, 2020) | |||
| 1. | Will say positive things about Sri Lanka to other | 1 = Strongly Disagree | |
| people | 2 = Disagree | (Fajriyati et al., | |
| 2. | Suggest Sri Lanka to friends and relatives as a | 3 = Neutral | 2020) |
| vacation destination to visit | 4 = Agree | ||
| 3. 4. | Encourage friends and relative to visit Sri Lanka Consider Sri Lanka as your choice to visit in the | 5 = Strongly Agree | (Bulatović, 2020) |
| 3. 4. 2. 3. 4. 3. 4. 1. 2. 1. 2. 4. 1. 2. 3. 4. 1. 2. 3. 4. 1. 2. 3. 4. | Indicators Independent Variable Traveling get away from routine Traveling to have fun It was a dream me to travel Sri Lanka. I feel happy when I am in Sri Lanka If I could I want to spend more time in Sri Lanka Like to exchange comments Like to enjoy talking. Temperature of the country Sustainability practices Historical sites in influencing your choice of travel destination Feel that the historical sites provided value for in attracting tourists to this destination Believe you can learn anything new during your visit to the historical sites Value for money as beach destination Beach is one the major area to select a destination (Reason) You like to participate in any recreational You feel that the beach had a lively and vibrant atmosphere, Tour guides should take care of customer needs you recommend the destination and its hospitality/guide services to friends or family Believe a guide's first impression is important. Tour guides have the knowledge of tourist Satisfy with the variety of attractions available Satisfy with the hotel services and facility Satisfy with the transportation and guide service Satisfy with the overall experience | 1 = Strongly Disagree 2 = Disagree 5 = Strongly Agree 1 = Strongly Disagree 2 = Disagree 3 = Neutral 4 = Agree 5 = Strongly Agree 1 = Strongly Disagree 2 = Disagree 3 = Neutral 4 = Agree 5 = Strongly Agree |
4.2. Methodology
The selection of the push and pull motivational dimensions was guided by prior validated tourism motivation studies. Push motivations were operationalized through three core psychological dimensions: relaxation and escape, self-esteem enhancement, and social interaction, based on established tourism motivation frameworks (Nikjoo & Ketabi, 2015; Güzel et al., 2020). These dimensions represent common intrinsic motivations identified in tourism research. Pull motivations were measured using destination-specific attributes, including climate, historical attractions, beaches, and hospitality services, which have been widely recognized as key factors in the attractiveness of tropical tourism destinations (Cengizci et al., 2020; Rice & Khanin, 2019). While other motivational factors exist in the literature, this study focuses on the most frequently validated dimensions that are particularly relevant to Sri Lanka's tourism context. Including additional motivational constructs would significantly increase model complexity and reduce estimation stability in PLS-SEM; therefore, the study focuses on the most frequently validated motivational dimensions relevant to Sri Lanka's tourism context. The measurement framework was therefore adapted from prior validated models while being contextualized to reflect the characteristics of Sri Lanka as a tropical island destination.
4.3. Data Collection
The data was collected through online and offline surveys, targeting Russian tourists at popular travel destinations in Sri Lanka. The sample size of 384 respondents was determined based on the sample size guidelines proposed by Krejcie and Morgan (1970), which suggest that a minimum sample of 384 is sufficient for large populations at a 95% confidence level. The structured questionnaire had two main sections: the first collected demographic information such as age, gender, education level, and travel history, while the second focused on measuring push and pull travel motivations, as well as travel satisfaction and destination loyalty using a 5-point Likert scale. Table 1 illustrates the demographic breakdown of the respondents.
Table 2. Sample Characteristics (N = 384)
| Demographic | Categories | Percentage |
|---|---|---|
| Gender | Male | 41% |
| Female | 59% | |
| Age | 12 – 27' | 7% |
| 28 – 43 | 46% | |
| 44 – 59 | 37% | |
| 60 – 78 | 10% | |
| 78 + | 0% | |
| Higher education | Without Education | 2% |
| Elementary education | 2% | |
| Secondary education | 19% | |
| University education | 77% | |
| Monthly income | Below 50000 | 9% |
| 50000 - 75000 | 16% | |
| 75000 - 100000 | 21% | |
| Above 100000 | 27% | |
| I do not want to answer | 28% | |
| Profession | Business | 27% |
| Lawyer | 7% | |
| Teacher | 4% | |
| Doctor | 9% | |
| Engineer | 16% | |
| Retired | 2% | |
| State employee | 8% | |
| Unemployed | 2% | |
| Other | 25% |
The demographic profile of the respondents provides valuable insights into the characteristics of Russian tourists visiting Sri Lanka. While the majority were female (59%), the gender distribution was reasonably balanced, with 41% male. This suggests the findings may reflect the preferences and behaviors of both genders. Respondents were predominantly middle-aged, with 37% between 44-59 years old and 56% aged 28-43. This indicates the sample was skewed towards middle-aged tourists, who may have distinct travel preferences, such as concerns for comfort, safety, and leisure. The younger age group, at just 7%, was underrepresented. Most respondents had university-level education, implying they were well-educated and potentially seeking more enriching or experiential tourism. Their financial capacity varied, with 27% earning over 100,000 LKR monthly, while 28% did not disclose income, suggesting diverse spending behaviors. The professional backgrounds were diverse, from business (27%) to healthcare and education, reflecting a broad spectrum of tourists with varied service quality expectations.
4.4. Data Analysis
The researchers analyzed the demographic characteristics of the respondents using descriptive statistics, providing an overview of the sample. They calculated measures of central tendency and dispersion, such as gender, age, education level, and monthly income, to gain insights into the profile of the Russian tourists visiting Sri Lanka.
To ensure the reliability and validity of the measurement scales, the researchers computed Cronbach's alpha for each construct (Hosni et al., 2018; Deyshappriya et al., 2019). They then employed Partial Least Squares Structural Equation Modeling to assess both the measurement model and the structural model (Ko & Stewart, 2002; Kumar & Stauvermann, 2016). The researchers evaluated convergent validity using Average Variance Extracted and Composite Reliability, while discriminant validity was assessed using the Fornell-Larcker criterion and the heterotrait-monotrait ratio (Raykov, 2000). The hypothesized relationships between push and pull motivations, travel satisfaction, and destination loyalty were tested using PLS-SEM. The researchers utilized the bootstrapping technique to compute standard errors and test the significance of the path coefficients. They also evaluated the overall model fit using the Standardized Root Mean Square Residual and calculated the R-squared values to determine the proportion of variance in the dependent variables explained by the independent variables.
5. Results
5.1. Measurement Model Results
The quality of the measurement model was assessed by evaluating the reliability and validity of the constructs. This involved analyzing Cronbach's Alpha, Composite Reliability, Average Variance Extracted, and Heterotrait-Monotrait ratios to ensure the constructs met the necessary statistical thresholds, thereby confirming the model's robustness (Hair et al., 2019). Construct reliability was examined through Cronbach's Alpha and Composite Reliability. As recommended, values exceeding 0.70 for both metrics are considered satisfactory for establishing internal consistency. The results presented in Table 3 demonstrate that all constructs exhibited strong reliability, with Cronbach's Alpha ranging from 0.865 to 0.955 and Composite Reliability surpassing the 0.70 threshold. These findings indicate the constructs were reliably measured, with the items within each construct consistently representing the underlying theoretical concept.
Cronbach's alpha Composite reliability (rho_a) Composite reliability (rho_c) Average variance extracted (AVE) Destination Loyalty 0.955 0.957 0.967 0.881 Satisfaction 0.865 0.871 0.908 0.712 Pull Motivation 0.913 0.919 0.925 0.467 Push Motivation 0.889 0.897 0.908 0.454
Table 3. Reliability and Validity
Convergent validity was assessed using Average Variance Extracted, where values above 0.50 suggest a construct explains more than 50% of the variance in its indicators (Fornell & Larcker, 1981). As shown in Table 3, Satisfaction and Destination Loyalty displayed strong convergent validity, with AVE values of 0.712 and 0.881, respectively. While the AVE for Push Motivation and Pull Motivation were slightly below the 0.50 threshold at 0.454 and 0.467, the high Composite Reliability values compensate for this, According to Fornell and Larcker (1981), AVE values slightly below 0.50 are acceptable when composite reliability exceeds 0.60, indicating these constructs still meet the necessary standards for reliability.
5.2. Discriminant Validity
Discriminant validity was assessed using the Heterotrait-Monotrait ratio, although the HTMT value between Satisfaction and Destination Loyalty slightly exceeds the conservative 0.85 threshold, it remains below the more liberal threshold of 0.90 recommended for conceptually related constructs (Henseler et al., 2015). As presented in Table 4, the HTMT ratios demonstrate that all constructs meet this criterion, with the highest ratio being 0.880 for the relationship between Satisfaction and Destination Loyalty.
These results of Table 4 confirm that the constructs in the model exhibit adequate discriminant validity, indicating they are sufficiently distinct from one another. This further supports the robustness of the measurement model.
5.3. Distribution of Travel Motivation Constructs
Figure 2 presents the distribution of responses for four key constructs—Push Motivation, Pull Motivation, Satisfaction, and Destination Loyalty—measured on a 5-point Likert scale. The violin plots depict the distribution of responses, with the majority concentrated in the upper range, indicating generally strong motivational factors and satisfaction among the Russian tourists.
Destination Loyalty Satisfaction Pull Motivation Push Motivation Destination Loyalty - Satisfaction 0.880 Pull Motivation 0.720 0.866 Push Motivation 0.751 0.757 0.839 -
Table 4. Discriminant Validity - HTMT – Matrix
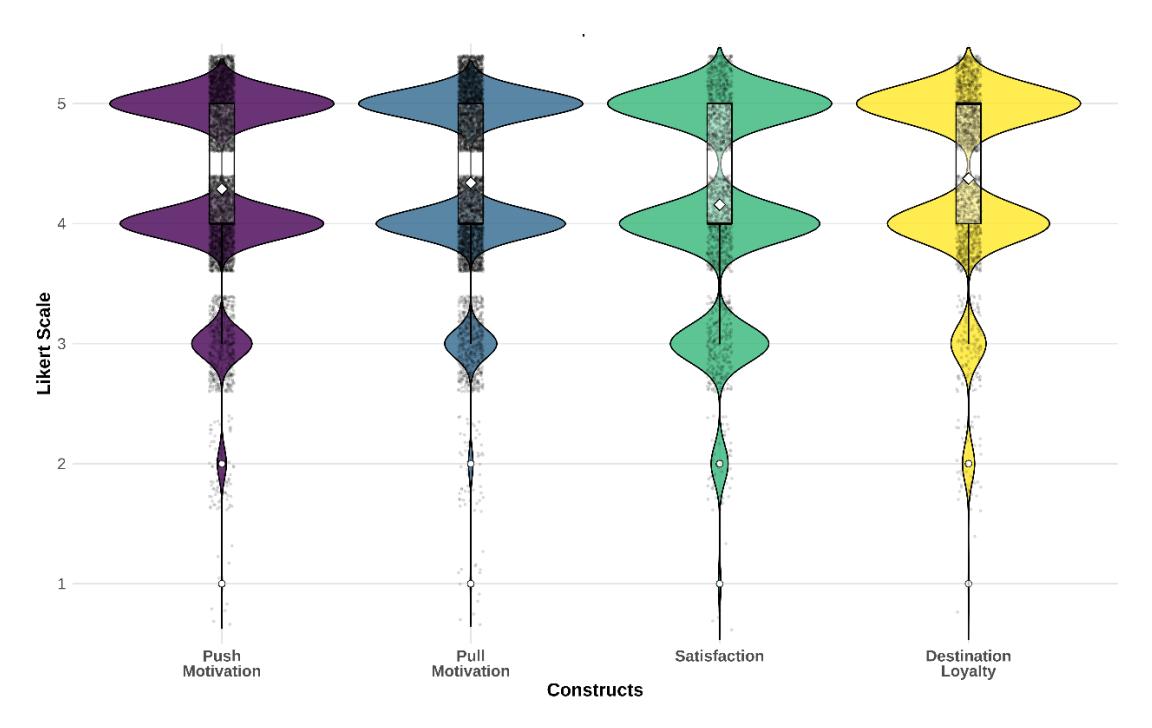
Figure 2. Distribution of dependent and independent variables
The mean and median values for each construct are as follows: Push Motivation (Mean = 4.29, Median = 4), Pull Motivation (Mean = 4.34, Median = 4), Satisfaction (Mean = 4.16, Median = 4), and Destination Loyalty (Mean = 4.38, Median = 5). The distribution shows that Destination Loyalty exhibits the highest concentration at the upper end of the scale, with a median of 5, suggesting a strong inclination for repeat visits. Notably, Pull Motivation scores slightly higher than Push Motivation, implying that external factors, such as Sri Lanka's climate and cultural attractions, have a marginally stronger influence on the travel decisions of the respondents. The Satisfaction construct demonstrates more variability in responses, indicating some mixed experiences among the Russian tourists.
5.4. Structural Model Results
The structural model was evaluated using key model fit indices, including the R² values, Standardized Root Mean Square Residual, and Q² values for predictive relevance. These indices provided insights into the model's fit to the data and the extent to which the independent variables explained the variance in the dependent constructs.
The R² values in Table 5 represent the proportion of variance in the dependent variables accounted for by the independent variables. As per Hair et al. (2019), R² values of 0.75, 0.50, and 0.25 are considered substantial, moderate, and weak, respectively. The R² values for Satisfaction and Destination Loyalty were 0.617 and 0.401, respectively, indicating the model moderately explained the variance in these constructs, suggesting the independent variables had a significant influence.
Table 5. R² values
| Original sample | Sample mean | Standard deviation | T statistics | P values | |
|---|---|---|---|---|---|
| Destination Loyalty | 0.698 | 0.702 | 0.027 | 25.813 | 0.000 |
| Satisfaction | 0.634 | 0.640 | 0.030 | 21.203 | 0.000 |
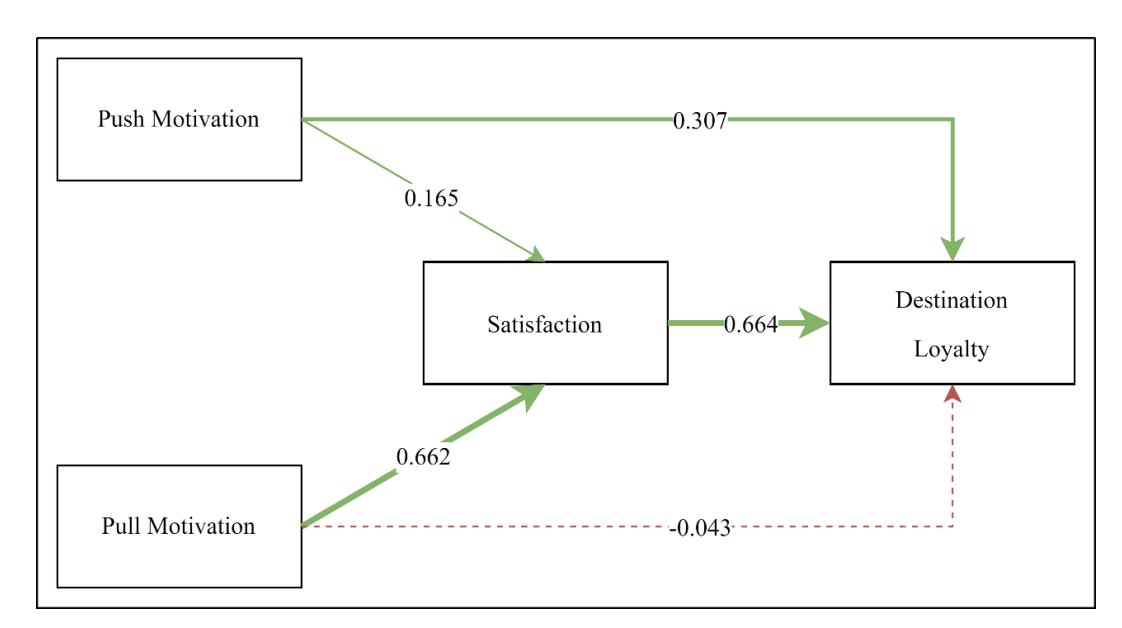
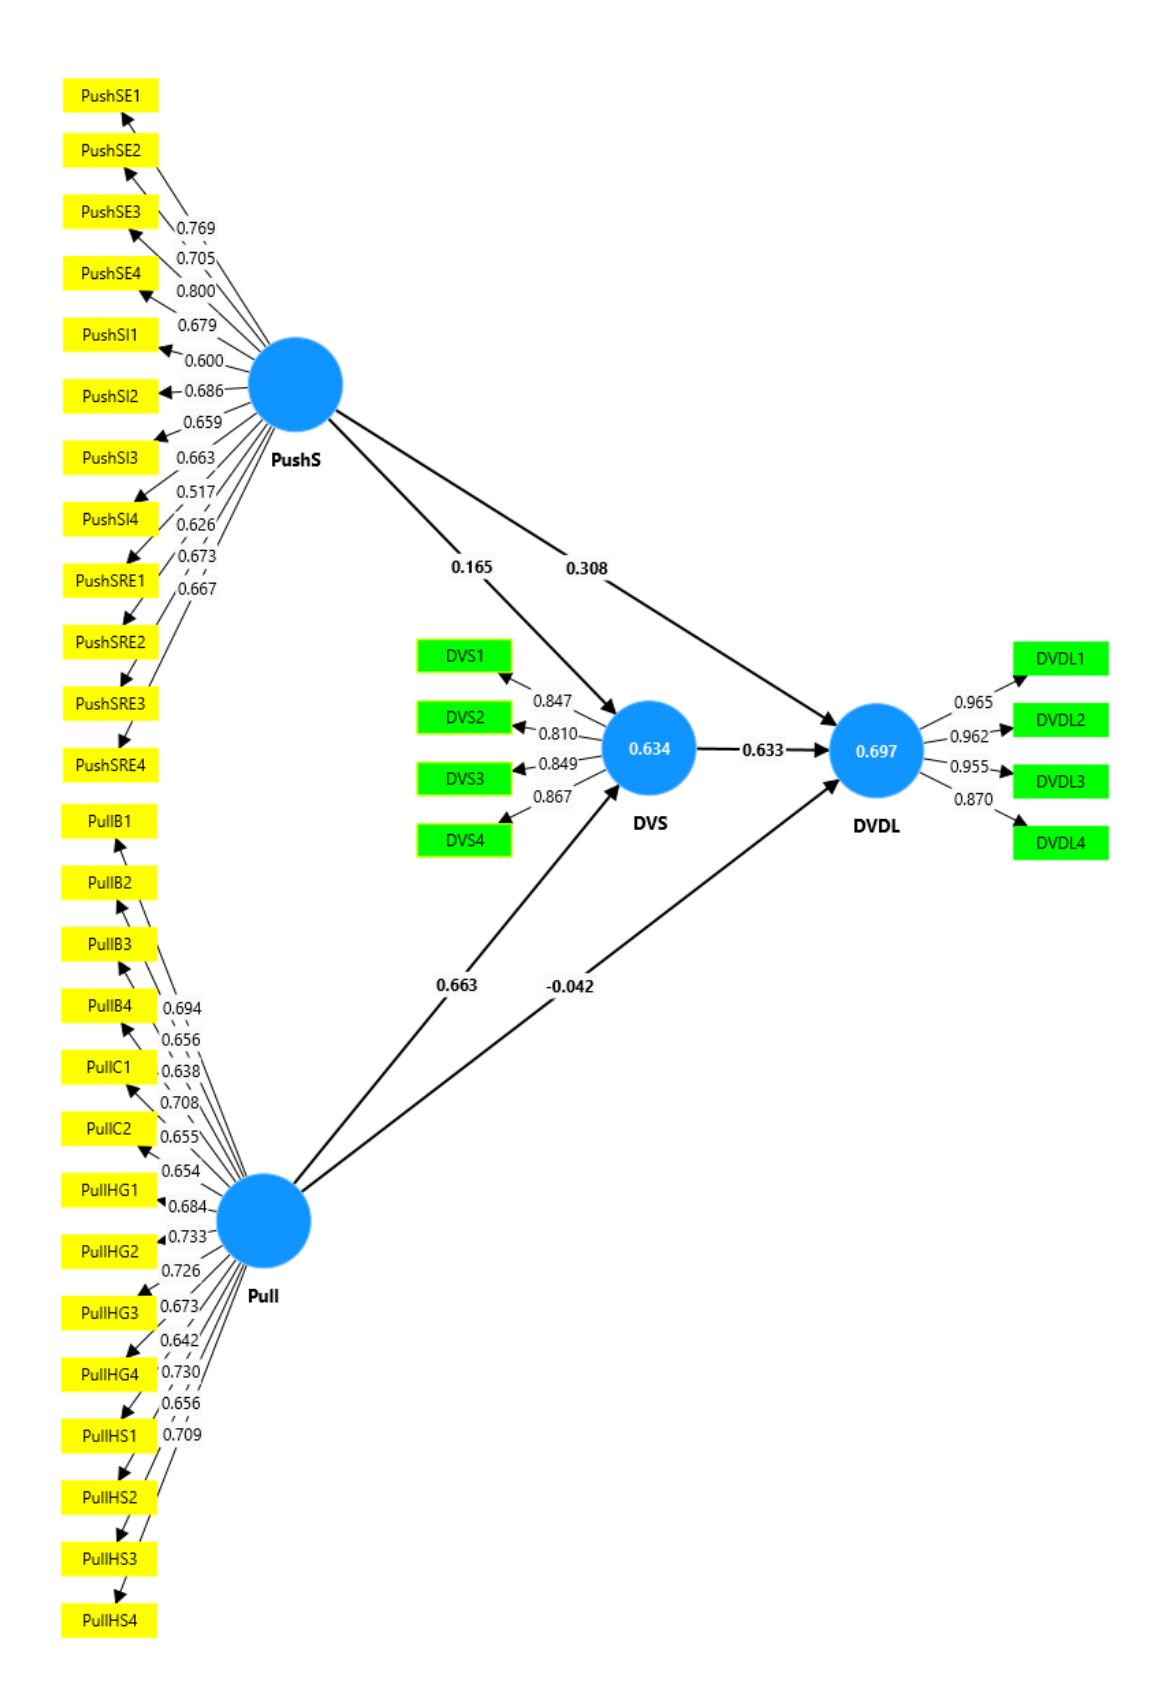
Figure 3. Structural Path Diagram with Coefficients
The Standardized Root Mean Square Residual is a widely used goodness-of-fit measure that evaluates the difference between the observed and predicted correlations in the model. A value below 0.08 is indicative of a well-fitting model (Hu & Bentler, 2009). In this study, the SRMR value was 0.056, confirming the structural model exhibited a strong fit to the data.
The strength of the relationships between the constructs was assessed using the path coefficients. As presented in Figure 3 the path diagram, the relationship between Satisfaction and Destination Loyalty had a path coefficient of 0.633, indicating a strong positive effect. Push Motivation had a direct effect on both Satisfaction and Destination Loyalty, while Pull Motivation strongly influenced Satisfaction but had a negative effect on Destination Loyalty. The model showed that Satisfaction acted as a key mediator between Push/Pull Motivations and Destination Loyalty.
The researchers assessed predictive relevance using Q² values, which were derived through the blindfolding procedure. A Q² value greater than zero indicates the model has predictive relevance for the endogenous constructs (Hair et al., 2019). The Q² values were 0.624 for Satisfaction and 0.542 for Destination Loyalty, as shown in Table 6. These Q² values confirm the model has strong predictive relevance, particularly for Satisfaction, which serves as a critical mediator in the relationship between motivations and loyalty.
To address potential multicollinearity issues, the researchers calculated the Variance Inflation Factor for the independent variables. VIF values below 5 are considered acceptable, indicating no significant multicollinearity. As presented in Table 7, all VIF values were well below the threshold, confirming multicollinearity is not a concern in the model.
Table 6. PLS Predict LV Summary
| Q²predict | RMSE | MAE | |
|---|---|---|---|
| Destination Loyalty | 0.542 | 0.681 | 0.495 |
| Satisfaction | 0.624 | 0.620 | 0.432 |
Table 7. Collinearity Statistics (VIF Values)
| VIF | |
|---|---|
| Satisfaction → Destination Loyalty | 2.729 |
| Pull Motivation → Destination Loyalty | 3.644 |
| Pull Motivation → Satisfaction | 2.448 |
| Push Motivation → Destination Loyalty | 2.523 |
| Push Motivation → Satisfaction | 2.448 |
The combination of the R² values, Standardized Root Mean Square Residual, Q² values, and VIF statistics demonstrates the model exhibits good overall fit and predictive power. The SRMR value of 0.056 indicates a well-fitting model, and the moderate to substantial R² and Q² values further reinforce the model's robustness. Additionally, the path coefficients highlight the significant relationships between Push/Pull Motivations, Satisfaction, and Destination Loyalty, with Satisfaction playing a critical mediating role.
5.5. Hypothesis Testing
The study's hypothesis testing results are presented below, showcasing the intricate relationships between push and pull travel motivations, tourist satisfaction, and destination loyalty. The structural model was evaluated using Partial Least Squares Structural Equation Modeling, and the statistical significance of each hypothesis was assessed through path coefficients, t-values, and p-values. Table 8 summarizes the hypothesis testing outcomes.
As shown in Table 8, the link between push motivations and travel satisfaction is statistically significant (β = 0.165, t = 2.941, p = 0.003). This finding supports H1, indicating that intrinsic factors, such as the desire to escape routine, improve self-esteem, and engage in meaningful social interactions, substantially contribute to higher levels of satisfaction among Russian tourists. This suggests that push motivations play a pivotal role in shaping travel experiences by fulfilling tourists' psychological needs.
Pull motivations were found to have a strong and positive influence on travel satisfaction (β = 0.662, t = 14.102, p < 0.001), supporting H2. This implies that destination-specific factors, such as Sri Lanka's favorable climate, cultural heritage, and recreational opportunities, significantly enhance tourists' satisfaction. These results align with previous research, highlighting the importance of external attributes in shaping the overall travel experience. The results indicate that travel satisfaction significantly influences destination loyalty (β = 0.634, t = 12.721, p < 0.001). As supported by H3, tourists who are satisfied with their travel experiences are more likely to exhibit loyalty behaviors, such as recommending Sri Lanka as a travel destination and planning to revisit in the future. This confirms the critical role of satisfaction in fostering destination loyalty.
The mediation analysis shows that travel satisfaction significantly mediates the relationship between push motivations and destination loyalty (β = 0.105, t = 2.971, p = 0.003). Thus, H4 is supported, suggesting that the fulfillment of intrinsic psychological motivations indirectly enhances destination loyalty through increased satisfaction. Tourists whose push motivations are met are more likely to develop a favorable attitude toward the destination, which translates into loyalty.
Original sample Sample mean Standard deviation T statistics P values Support Satisfaction → Destination Loyalty 0.634 0.633 0.050 12.721 0.000 H3 Pull Motivation → Destination Loyalty -0.043 -0.043 0.063 0.680 0.496 Pull Motivation → Satisfaction 0.662 0.664 0.047 14.102 0.000 H2 Push Motivation → Destination Loyalty 0.307 0.309 0.053 5.829 0.000 Push Motivation → Satisfaction 0.165 0.167 0.056 2.941 0.003 H1 Total Indirect Effects Pull Motivation → Destination Loyalty 0.420 0.420 0.046 9.039 0.000 Push Motivation → Destination Loyalty 0.105 0.105 0.035 2.971 0.003 Specific Indirect Effects Pull Motivation → Satisfaction→ Destination Loyalty 0.420 0.420 0.046 9.039 0.000 H5 Push Motivation → Satisfaction→ Destination Loyalty 0.105 0.105 0.035 2.971 0.003 H4
Table 8. Hypothesis Testing Results
The mediation analysis further reveals that travel satisfaction significantly mediates the relationship between pull motivations and destination loyalty (β = 0.420, t = 9.039, p < 0.001), lending support to H5. Although external pull factors, such as destination attractions and services, initially attract tourists to Sri Lanka, it is the level of satisfaction with these experiences that ultimately fosters destination loyalty. This finding underscores the paramount importance of delivering a consistently satisfying travel experience to ensure repeat visits and positive word-of-mouth promotion of the destination.
6. Discussion and Implications
This study provides vital insights into the travel motivations of Russian tourists visiting Sri Lanka in the post-pandemic era, emphasizing the pivotal roles of push and pull factors in shaping travel satisfaction and destination loyalty. Our findings contribute to the growing body of literature on tourism motivation, offering new perspectives on the application of Push-Pull Motivation Theory and Expectation-Disconfirmation Theory in emerging tourism markets.
The findings of this study are consistent with prior tourism research that highlights the importance of intrinsic travel motivations in shaping tourist satisfaction and loyalty. Similar to the findings of Rice and Khanin (2019), the results indicate that push motivations play a stronger role in influencing destination loyalty compared to pull motivations. Furthermore, the significant mediating role of tourist satisfaction supports the findings of Mohamad et al. (2011), who demonstrated that satisfaction serves as a critical mechanism linking tourist motivations to loyalty intentions. However, the current study extends these findings by demonstrating that in the post-pandemic tourism context, psychological motivations such as relaxation and personal well-being appear to exert a stronger influence on loyalty behavior than destination attributes alone.
The study confirms the significant impact of both push and pull motivations on travel satisfaction, with push factors exerting a stronger influence. This is consistent with prior literature, but our findings extend previous tourism research (Prayag & Ryan, 2012; Rice & Khanin, 2019) by demonstrating how push motivations influence destination loyalty in the specific context of Russian
tourists visiting Sri Lanka during the post-pandemic recovery period. The stronger influence of push factors on destination loyalty, mediated by satisfaction, highlights the increasing importance of intrinsic motivations in shaping travel decisions, especially when tourists are likely prioritizing personal well-being and meaningful experiences over mere destination attractions. This suggests that the Push-Pull framework may require refinement when applied to post-pandemic travel behaviors, where the fulfillment of psychological needs is more dominant in fostering loyalty than in prepandemic tourism studies.
This study supports the Expectation-Disconfirmation Theory by demonstrating that satisfaction mediates the relationship between travel motivations and destination loyalty. However, our findings highlight an interesting divergence from the traditional understanding of pull factors. While external factors like climate and cultural attractions strongly enhance satisfaction, they do not directly drive loyalty unless tourists are deeply satisfied with their experiences. This finding nuances the theory by suggesting that destination loyalty, especially in post-pandemic contexts, is not solely a function of exceeding expectations on external attributes but is significantly influenced by how well personal psychological needs are met. This theoretical advancement is crucial for understanding tourist behavior in the rapidly evolving global tourism landscape.
Our results align with recent studies that indicate a shift in tourist priorities post-pandemic, where safety, well-being, and psychological enrichment have become key drivers of travel behavior. This context-specific understanding of Russian tourists' motivations adds to the limited research on emerging Asian destinations post-pandemic and offers new insights into how intrinsic factors may.
6.1. Implications for Practice and Policy
Tourism marketers in Sri Lanka should leverage the significance of push motivations by developing highly personalized marketing strategies that emphasize psychological fulfillment. Campaigns focusing on themes like self-discovery, relaxation, and escape from routine could be more effective in fostering deeper satisfaction and encouraging repeat visits. Furthermore, leveraging digital platforms to offer tailored travel experiences based on individual preferences could help position Sri Lanka as a destination that caters to tourists' intrinsic needs.
The substantial role of pull motivations in driving satisfaction underscores the need for Sri Lanka to preserve and promote its natural and cultural assets. Destination managers should prioritize sustainable tourism practices that maintain the long-term appeal of these attributes, particularly as global travelers become more conscious of environmental and cultural preservation. Policymakers could introduce regulations that balance tourism growth with the protection of natural and cultural heritage sites, ensuring Sri Lanka remains an attractive and sustainable destination in the long term.
To strengthen destination loyalty, tourism managers should implement strategies that engage satisfied tourists' post-trip. This could include loyalty programs, referral incentives, and targeted communications that encourage repeat visits and positive word-of-mouth recommendations. Given the strong mediation effect of satisfaction, fostering deep and positive emotional experiences during the trip will be crucial for retaining Russian tourists and expanding this market further.
The post-pandemic landscape presents both challenges and opportunities for emerging tourism destinations. Sri Lanka, with its unique blend of cultural and natural attractions, is well-positioned to capture the attention of international tourists, especially from markets like Russia. However, destination managers must also recognize shifting traveler priorities toward well-being and safety. Ensuring that tourism infrastructure and services align with these priorities—through enhanced
hygiene measures, flexible travel policies, and wellness tourism offerings—will be vital in attracting and retaining tourists in the post-pandemic era.
At the policy level, tourism authorities in Sri Lanka should focus on creating a holistic and sustainable tourism strategy that emphasizes the balance between meeting tourist expectations and preserving the nation's cultural and environmental heritage. Strategic investments in tourism infrastructure that enhance both the physical.
6.2. Limitations and Future Research
This study has certain limitations that warrant further investigation. First, the exclusive focus on Russian tourists may constrain the generalizability of the findings to other source markets. Future research could explore how travel motivations vary across diverse nationalities and cultural contexts. Second, the cross-sectional design of the study restricts our ability to assess dynamic changes in travel motivations and satisfaction over time. Longitudinal studies would provide deeper insights into the evolution of these factors, particularly in the context of ongoing global disruptions such as pandemics and geopolitical tensions.
Finally, the current research focused on a single destination, Sri Lanka. Future studies could adopt a comparative approach, examining travel motivations and their impacts across multiple postpandemic destinations in Asia or other emerging tourism regions. Despite these limitations, this study contributes to the growing body of literature on post-pandemic tourist behavior, offering relevant insights for tourism stakeholders in Sri Lanka and other similar destinations.
7. Conclusion
This study provides important insights into the travel motivations of Russian tourists visiting Sri Lanka in the post-pandemic tourism landscape. The results demonstrate that both push and pull motivations significantly influence tourist satisfaction, while destination loyalty is primarily driven by the fulfillment of intrinsic psychological motivations. Tourist satisfaction plays a critical mediating role in transforming travel motivations into loyalty intentions. From a theoretical perspective, the findings extend push–pull motivation theory by highlighting the growing importance of intrinsic motivations in shaping tourist behavior in post-pandemic tourism environments. From a managerial perspective, tourism authorities in Sri Lanka should develop marketing strategies that emphasize relaxation, personal well-being, and unique cultural experiences to enhance tourist satisfaction and loyalty. Future research could extend this work by examining multiple tourist markets or employing longitudinal data to analyze changes in tourist motivations over time.
References
Albayrak, T., Dursun, A. and Ünal, C. (2018). Do tourists have different motivations for online travel purchasing? A segmentation of the Russian market. Journal of Vacation Marketing, 25(4), p.135676671881409. DOI: 10.1177/1356766718814091.
Ardani, W., Rahyuda, K., Giantari, I.G.A.K. and Sukaatmadja, I.P.G. (2019). Customer Satisfaction and Behavioral Intentions in Tourism: A Literature Review. International Journal of Applied Business and International Management, 4(3), pp.84–93. DOI: 10.32535/ijabim.v4i3.686.
Arismayanti, N.K., Budiarsa, M., Bakta, I.M. and Pitana, I.G. (2020). The Satisfaction Index of Tourists Experience Quality: A Case Study In Bali Tourism Destination. Russian Journal of Agricultural and Socio-Economic Sciences, 105(9), pp.67–77. DOI: 10.18551/rjoas.2020-09.08.
- Azmi, S.N., Khan, T., Azmi, W. and Azhar, N. (2023). A panel cointegration analysis of linkages between international trade and tourism: case of India and South Asian Association for Regional Cooperation (SAARC) countries. Quality & Quantity, 57(6). DOI: 10.1007/s11135- 022-01602-7.
- Bulatovic, I. (2020). Testing a holistic model of tourist destination loyalty. Tourism, 68(3), pp.354–358. DOI: 10.37741/t.68.3.8.
- Cengizci, A.D., Başer, G. and Karasakal, S. (2020). Exploring Push and Pull Motivations of Russian Tourists to Turkey. Tourism Review International, 24(2). DOI: 10.3727/154427220x15912253254419.
- Cetin, G. and Bilgihan, A. (2015). Components of cultural tourists' experiences in destinations. Current Issues in Tourism, 19(2), pp.137–154. DOI: 10.1080/13683500.2014.994595.
- Chen, C.-F., & Tsai, D. (2007). How Destination Image and Evaluative Factors Affect Behavioral intentions? Tourism Management, 28(4), 1115–1122. 10.1016/j.tourman.2006.07.007
- Chindaprasert, K., Yasothornsrikul, P. and Esichaikul, R. (2015). The Effects of Motivation and Satisfaction on Destination Loyalty at the Thailand -Laos (PDR) Border. Asia-Pacific Journal of Innovation in Hospitality and Tourism (APJIHT), [online] 4(1). DOI: 10.7603/s40930-015-0001-y.
- Crompton, J. L. (1979). Motivations for Pleasure Vacation. Annals of Tourism Research, 6(4), 408–424. DOI: 10.1016/0160-7383(79)90004-5
- Correia, A., Kozak, M. and Ferradeira, J. (2013). From tourist motivations to tourist satisfaction. International Journal of Culture, Tourism and Hospitality Research, 7(4), pp.411–424. DOI: https://doi.org/10.1108/ijcthr-05-2012-0022.
- Cruz-Milán, O. (2023). Loyalty in the time of COVID-19: A review of the literature in tourism destination settings. Frontiers in Psychology, 14. DOI: 10.3389/fpsyg.2023.1119737.
- Dann, G.M.S. (1977). Anomie, ego-enhancement and tourism. Annals of Tourism Research, 4(4), pp.184–194. DOI: 10.1016/0160-7383(77)90037-8.
- Deyshappriya, N.P.R., Idroos, A.A. and Sammani, U.G.O. (2019). Analyzing the Determinants of Tourists' Buying Behaviour in Sri Lanka: With Special Reference to Tourism Destinations in Down South of Sri Lanka. South Asian Journal of Social Studies and Economics, pp.1–13. DOI: 10.9734/sajsse/2019/v4i330130.
- Fajriyati, I., Afiff, A.Z., Gayatri, G. and Hati, S.R.H. (2020). Generic and Islamic attributes for non-Muslim majority destinations: application of the three-factor theory of customer satisfaction. Heliyon, 6(6), p.e04324. DOI: 10.1016/j.heliyon.2020.e04324.
- Fornell, C. and Larcker, D.F. (1981). Evaluating Structural Equation Models with Unobservable Variables and Measurement Error. Journal of Marketing Research, 18(1), pp.39–50.
- Frolova, E.V., Rogach, O.V., Kabanova, E.E., Medvedeva, N.V. and Shimanskaya, I.Y. (2017). Tendencies and prospects of tourism industry in Russia : sociological analysis of stereotypes among population during tourism trips. European Research Studies Journal, 20, pp.308–320.
- Garg, P. and Pandey, A. (2020). Towards sustainable tourism: an empirical investigation. foresight, 23(2), pp.188–200. DOI: 10.1108/fs-04-2020-0042.
- Gidebo, B.H. (2021). Factors determining international tourist flow to tourism destinations: A systematic review. Journal of Hospitality Management and Tourism, 12(1), pp.9–17. DOI: 10.5897/jhmt2019.0276.
- Ginting, N., Rahman, V. and Nasution, A. (2019). Aspects of self-esteem in the tourism development in Karo regency, North Sumatera, Indonesia. Journal of Urban and Regional Analysis, 11(2). DOI: 10.37043/jura.2019.11.2.4.
- Güzel, Ö., Sahin, I. and Ryan, C. (2020). Push-motivation-based emotional arousal: A research study in a coastal destination. Journal of Destination Marketing & Management, 16, p.100428. DOI: 10.1016/j.jdmm.2020.100428.
- Hair, J.F., Risher, J.J., Sarstedt, M. and Ringle, C.M. (2019). When to use and how to report the results of PLS-SEM. European Business Review, 31(1), pp.2–24.
- Han, X., Praet, C.L.C. and Wang , L. (2019). The role of social interaction in the tourism experience of Chinese visitorsto Japan: A grounded theory approach. In: Travel and Tourism Research Association: Advancing Tourism Research Globally. University of Massachusetts Amherst.
- Henseler, J., Ringle, C.M. and Sarstedt, M. (2015). A new criterion for assessing discriminant validity in variance-based structural equation modeling. Journal of the Academy of Marketing Science, 43(1), pp.115–135. DOI: 10.1007/s11747-014-0403-8.
- Hosni, H., Kievit, H., Drakos, P.D., Angelakis, G. and van Dijk, G. (2018). Measuring Tourist Attitudes and Consumer Behavior. International Journal of Food and Beverage Manufacturing and Business Models, 3(2), pp.29–41. DOI: 10.4018/ijfbmbm.2018070103.
- Hu, L. and Bentler, P.M. (1999). Cutoff Criteria for Fit Indexes in Covariance Structure Analysis: Conventional Criteria versus New Alternatives. Structural Equation Modeling: A Multidisciplinary Journal, 6(1), pp.1–55.
- Huang, S., Hsu, C.H.C. and Chan, A. (2009). Tour Guide Performance and Tourist Satisfaction: a Study of the Package Tours in Shanghai. Journal of Hospitality & Tourism Research, 34(1), pp.3– 33. DOI: 10.1177/1096348009349815.
- Hung, V.V., Dey, S.K., Vaculcikova, Z. and Anh, L.T.H. (2021). The Influence of Tourists' Experience on Destination Loyalty: A Case Study of Hue City, Vietnam. Sustainability, 13(16), p.8889. DOI: 10.3390/su13168889.
- Japutra, A. and Keni, K. (2020). Signal, need fulfilment and tourists' intention to revisit. Anatolia, 31(4), pp.1–15. DOI: 10.1080/13032917.2020.1806889.
- Khan, Md.Ashraful.A. and Hashim, H. (2020). Tourist Satisfaction Index for Tourism Destination, Integrating Social Media Engagement into the European Customer Satisfaction Index: A Conceptual Paper. International Journal of Academic Research in Business and Social Sciences, 10(9). DOI: 10.6007/ijarbss/v10-i9/7519.
- Klenosky, D. B. (2002). The "Pull" of Tourism Destinations: A Means-End Investigation. Journal of Travel Research, 40(4), 396–403. DOI: 10.1177/004728750204000405
- Ko, D.-W. and Stewart, W.P. (2002). A structural equation model of residents' attitudes for tourism development. Tourism Management, 23(5), pp.521–530. DOI: 10.1016/s0261-5177(02)00006-7.
- Krejcie, R.V. and Morgan, D.W. (1970). Determining sample size for research activities. Educational and Psychological Measurement, [online] 30(3), pp.607–610. DOI: 10.1177/001316447003000308.
- Kumar, R.R. and Stauvermann, P.J. (2016). Dataset for an analysis of tourism and economic growth: A study of Sri Lanka. Data in Brief, 8, pp.723–725. DOI: 10.1016/j.dib.2016.06.066.
Lise, W. and Tol, R.S.J. (2001). Impact of Climate on Tourist Demand. SSRN Electronic Journal, 55(4). DOI: 10.2139/ssrn.278516.
- Marques, C.P. (2006). Seeking to Escape: Sights over Approach-Avoidance Dialectics. In: M. Kozak and L. Andreu, eds., Progress in Tourism Marketing. Elsevier Ltd., pp.191–205.
- McNeely, L.E., Burton, J.L. and Pennington, J.R. (2020). Emotional and Cognitive Drivers of Customer Satisfaction in Adventure Travel. Tourism Review International, 23(3), pp.133–147. DOI10.3727/154427219x15790218411835.
- Mohamad, M., Ali, A.M. and Ghani, N.I.A. (2011). A Structural Model of Destination Image, Tourists' Satisfaction and Destination Loyalty. International Journal of Business and Management Studies, 11(2), pp.167–177.
- Mooser, A., Anfuso, G., Stanchev, H., Stancheva, M., Williams, A.T. and Aucelli, P.P.C. (2022). Most Attractive Scenic Sites of the Bulgarian Black Sea Coast: Characterization and Sensitivity to Natural and Human Factors. Land, 11(1), p.70. DOI: 10.3390/land11010070.
- Neuburger, L., & Egger, R. (2020). Travel Risk Perception and Travel Behaviour during the COVID-19 Pandemic 2020: a Case Study of the DACH Region. Current Issues in Tourism, 24(7), 1–14. DOI: 10.1080/13683500.2020.1803807
- Nikjoo, A.H. and Ketabi, M. (2015). The role of push and pull factors in the way tourists choose their destination. Anatolia, 26(4), pp.588–597. DOI: 10.1080/13032917.2015.1041145.
- Oliver, R. L. (1980). A Cognitive Model of the Antecedents and Consequences of Satisfaction Decisions. Journal of Marketing Research, 17(4), 460–469. JSTOR. DOI: 10.2307/3150499
- Oliver, R. L. (1999). Whence Consumer Loyalty? Journal of Marketing, 63(4), 33–44.
- Oliver, R.L. and Winer, R.S. (1987). A framework for the formation and structure of consumer expectations: Review and propositions. Journal of Economic Psychology, 8(4), pp.469–499. DOI: 10.1016/0167-4870(87)90037-7.
- Park, S., Hahn, S., Lee, T. and Jun, M. (2018). Two factor model of consumer satisfaction: International tourism research. Tourism Management, 67, pp.82–88. DOI: 10.1016/j.tourman.2018.01.007.
- Pawaskar R, P. and Goel, M. (2017). Enhancing the effectiveness of marketing a tourist destination using satisfaction analysis. International Journal of Business and Systems Research, 11(1/2), p.163. DOI: 10.1504/ijbsr.2017.10000885.
- Pestana, M.H., Parreira, A. and Moutinho, L. (2019). Motivations, Emotions and satisfaction: the Keys to a Tourism Destination Choice. Journal of Destination Marketing & Management, 16. DOI: 10.1016/j.jdmm.2018.12.006.
- Prayag, G., Hosany, S., Muskat, B., & Del Chiappa, G. (2017). Understanding the Relationships between Tourists' Emotional Experiences, Perceived Overall Image, Satisfaction, and Intention to Recommend. Journal of Travel Research, 56(1), 41–54. DOI: 10.1177/0047287515620567
- Prayag, G., & Ryan, C. (2012). Antecedents of Tourists' Loyalty to Mauritius. Journal of Travel Research, 51(3), 342–356. DOI: 10.1177/0047287511410321
- R.-Toubes, D., Araújo-Vila, N. and Fraiz-Brea, J.A. (2020). Influence of Weather on the Behaviour of Tourists in a Beach Destination. Atmosphere, 11(1), p.121. DOI: 10.3390/atmos11010121.
- Raykov, T. (2000). A Method for Examining Stability in Reliability. Multivariate Behavioral Research, 35(3), pp.289–305. DOI: 10.1207/s15327906mbr3503_01.
- Resino, B.J.J., Gutiérrez-Broncano, S. and Arias-Oliva, M. (2020). Proposal for Lines of Research Into Consumer Behavior: Examples in the Tourism Industry. Frontiers in Psychology, 11. DOI: 10.3389/fpsyg.2020.00064.
- Rice, J. and Khanin, D. (2019). Why Do They Keep Coming Back? The Effect of Push Motives vs. Pull Motives, and Attribute Satisfaction on Repeat Visitation of Tourist Destinations. Journal of Quality Assurance in Hospitality & Tourism, 20(4), pp.1–25. DOI: 10.1080/1528008x.2018.1553117.
- Said, J. and Maryono, M. (2018). Motivation and Perception of Tourists as Push and Pull Factors to Visit National Park. E3S Web of Conferences, [online] 31, p.08022. Available at: https://www.e3sconferences.org/articles/e3sconf/pdf/2018/06/e3sconf_icenis2018_08022.pdf.
- Satyarini, N.W.M., Tamjuddin, T. and Kurniawan, R. (2020). Interrelation Between Tourist Risk Perception and Destination Image and Revisit Intention East Lombok Post Earthquake. Proceedings of the 2nd International Seminar on Business, Economics, Social Science and Technology (ISBEST 2019). DOI: 10.2991/aebmr.k.200522.036.
- Šimková, E. and Holzner, J. (2014). Motivation of Tourism Participants. Procedia - Social and Behavioral Sciences, [online] 159(1), pp.660–664. DOI: 10.1016/j.sbspro.2014.12.455.
- Simpson, N. (2017). Demographic and economic determinants of migration. IZA World of Labor. DOI: 10.15185/izawol.373.
- SLTDA (2023). Sri Lanka Tourism Development Authority. [online] SLTDA. Available at: https://sltda.gov.lk/en/annual-statistical-report. [Accessed 21 Sep. 2024].
- Soldatenko, D. and Backer, E. (2019). A content analysis of cross-cultural motivational studies in tourism relating to nationalities. Journal of Hospitality and Tourism Management, [online] 38, pp.122–139. DOI: 10.1016/j.jhtm.2018.12.004.
- Song, H., van der Veen, R., Li, G. and Chen, J.L. (2012). The Hong Kong tourist satisfaction index. Annals of Tourism Research, 39(1), pp.459–479. DOI: 10.1016/j.annals.2011.06.001.
- Su, D.N., Nguyen, N.A.N., Nguyen, Q.N.T. and Tran, T.P. (2020). The link between travel motivation and satisfaction towards a heritage destination: The role of visitor engagement, visitor experience and heritage destination image. Tourism Management Perspectives, 34, p.100634. DOI: 10.1016/j.tmp.2020.100634.
- Sulkaisi, N., Idris, Siska, F. and Irwan (2021). The Effect of Services Quality on Tourist Satisfaction and Tourist Loyalty. [online] www.atlantis-press.com. DOI: 10.2991/aebmr.k.210218.001.
- Tammubua, M.H. and Surapto, D. (2021). Analysis of Competence and Service Quality on Customer Satisfaction and Loyalty in Eastern Indonesia Border Tourism. Budapest International Research and Critics Institute (BIRCI-Journal): Humanities and Social Sciences, 4(2), pp.3016–3031. DOI: 10.33258/birci.v4i2.2022.
- Thong, J.-Z., Lo, M.-C., Abang Azlan Mohamad and Lim, J. (2020). Culture, Carrying Capacity And Perceived Value On Tourists' Satisfaction And Revisit Intention. ˜ The œ European Proceedings of Social & Behavioural Sciences. DOI: 10.15405/epsbs.2020.10.49.
- Wen, J., Kozak, M., Yang, S., & Liu, F. (2020). COVID-19: potential effects on Chinese citizens' lifestyle and travel. Tourism Review, 76(1), 74–87. DOI: 10.1108/tr-03-2020-0110
- Wickramasinghe, K. and Naranpanawa, A. (2023). Tourism and COVID-19: An economy-wide assessment. Journal of Hospitality and Tourism Management, 55, pp.131–138. DOI: 10.1016/j.jhtm.2023.03.013.
Wijesekara, C., Tittagalla, C., Jayathilaka, A., Ilukpotha, U., Jayathilaka, R. and Jayasinghe, P. (2022). Tourism and economic growth: A global study on Granger causality and wavelet coherence. PLoS ONE, [online] 17(9), p.e0274386. DOI: 10.1371/journal.pone.0274386.
Yoon, Y., & Uysal, M. (2005). An examination of the effects of motivation and satisfaction on destination loyalty: a structural model. Tourism Management, 26(1), 45–56. DOI: 10.1016/j.tourman.2003.08.016
Appendix 01
PLS-SEM Algorithm Results