

1. Introduction
An outbreak of novel coronavirus in Wuhan has attracted worldwide attention, and more than 200 countries are infected by the virus. The World Health Organization (WHO) has declared the disease as a pandemic on March 11, 2020 when more than 118,000 cases in 114 countries and 4,291 deaths have happened [1]. As of April 09, 2020, there have been 1,600,990 confirmed cases and 98,804 deaths. The disease has spread very fast, for only in two days (as April 11, 2020), the number of infections has escalated dramatically with a total number of confirmed cases nearly two millions and more than 130 thousand death toll [2].
Research has been undertaken to investigate the transmission dynamics of the disease and the potential effects of the measures to slow down the epidemics. Mathematical models have been widely used to understand disease transmission dynamics and assessed the potential strategies against diseases while waiting for vaccine or pharmaceutical intervention [3, 4, 5, 6]. The analysis focuses mainly on estimating the reproduction ratio and analyze the best potential strategies against disease transmission. The works center around the questions: is the curve still increasing with exponential growth rate? When will the progression curve or the cumulative cases of COVID-19 bend lower from the current observed data? What is the highest peak of infection and when this peak will be reached? How large are the important epidemiological measures such as the basic reproduction ratio, \(R_0\). Another important question is that "to what extent the probability of extinction of the disease?". There are several strategies implemented to slowing down the epidemics: social distancing, lockdown, mass testing, and border restriction. The question is how effective these strategies? To what extent these lead to the probability of extinction?
Generally, mathematical models of the COVID-19 transmission are based on the compartmental SEIR model with its modification of the original SEIR model in deterministic setting [6, 7, 8, 9, 10, 11, 12, 13, 14, 15] and only few authors discussed in a stochastic setting [3, 16, 17]. Using a deterministic and stochastic model, we assess the reproduction ratio and the probability of disease extinction. Furthermore, we also simulate the effects of the reduction in the transmission rate and days needed to confirm undetected infected individuals. The proportion of undetected infected individuals is also calculated. We analyse the model for Indonesia and Saudi Arabia. We are interested to study Saudi Arabia since the Saudi Arabia has become one of the centers where many people from various countries visit Saudi Arabia. Each year, Saudi Arabia become the
*Corresponding author
place where millions of people gather in the relatively small places to perform annual pilgrimage. Besides, thousands of people from other countries -in and -out at daily bases to perform minor pilgrimage. This fact has placed Saudi Arabia as a hub in terms of disease transmission if it is not managed appropriately [18, 19]. This report is a preliminary study, and would be regarded as a baseline, before we have extended the model to study long-term disease transmission dynamics when Saudi Arabia has re-open their country for visits and how this situation affects disease transmission dynamics in the country and overseas. This would lead us to formulate metapopulation or network model to study the effects human movement on disease transmission dynamics from and to Saudi Arabia.
2. DETERMINISTIC MATHEMATICAL MODEL
A compartment-based mathematical model has been formulated where the population is divided into different compartment according to their disease status. In this model, the human population is susceptible (S), exposed (E), infected undetected (IU), infected detected (directly to quarantine) (IQ), and recovered (R). The flowchart of the diagram is shown in Figure 1.
Figure 1: Flow chart of the model for COVID-19. The population is divided into Susceptible (S), Exposed (E), Infected Undetected (IU), and Infected Detected (directly quarantine) (IQ) and Recovered (R).
In this model, it is assumed that only undetected infected individuals can transmit the virus and therefore, susceptible humans are exposed to the virus after contacting with the undetected infected individuals at a rate of \(\beta\). Since we are interested in short term period, the birth and natural death rates are ignored. The model is governed by the following differential equations.
\[\frac{dS}{dt} = -\beta \frac{SI_U}{N},\] \[\frac{dE}{dt} = \beta \frac{SI_U}{N} - kE,\] \[\frac{dI_U}{dt} = kE - (\gamma + \sigma + d)I_U,\] \[\frac{dI_Q}{dt} = \gamma I_U - dI_Q - \sigma I_Q,\] \[\frac{dR}{dt} = \sigma (I_U + I_Q).\] (1)
We follow Chowell et al. [20] to set the death rate as
\[d = \sigma \frac{CFR}{1 - CFR},\] where the CFR is the case fatality rate.
Before the outbreak takes off, the total susceptible human population is equal to the total human population, S = N, and hence using the concept of the next generation matrix [21], we obtain the reproduction ratio as
\[R_s = \frac{\beta}{\gamma + d + \sigma} \tag{2}\]
3. PARAMETER ESTIMATION
3.1. Estimation of Case Fatality Ratio
We use data available in https://www.worldometers.info/coronavirus/#countries for Saudi Arabia and https://kawalcovid19.id/ for Indonesia.The data is used to estimate the the case fatality ratio and the take-off rate for determining the reproductive ratio. We use the data from the date of the first confirmed case until 23 April 2020 for both countries.
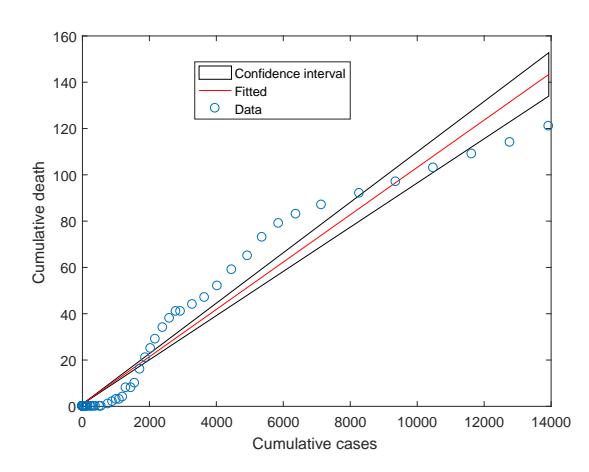
The case fatality rate is estimated using the simple linear regression model. The cumulative number of cases as predictor variable and cumulative deaths as the outcome variable. The slope is used as an estimate of the case fatality rate [4]. The results are given in Figure 2. The case fatality rate for Indonesia and Saudi Arabia are 0.087212 (95% CI: 0.0861, 0.08864), and 0.010222 (95% CI: 0.095, 0.0109). The coefficient of determination, R-squared, are 0.998 and 0.948 for Indonesia and Saudi Arabia, respectively, which implies that the early epidemic data followed the linear trend.
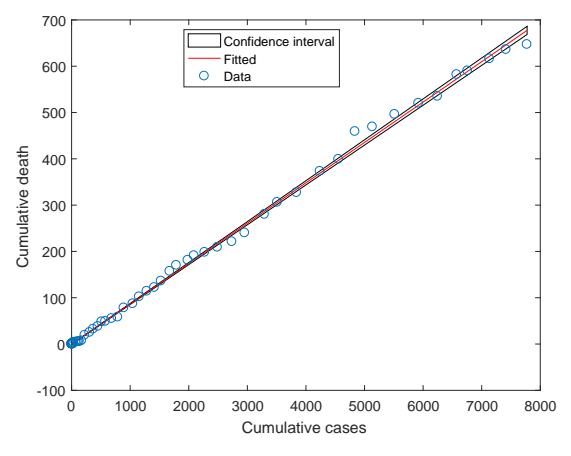
- (a) The slope of the linear model is 0.086253 for Indonesia.
- (b) The slope of the linear model is 0.01359 for Saudi Arabia.
Figure 2: Fitting the linear regression to the cumulative cases and deaths.
3.2. Estimation of reproductive ratio
Estimating the reproductive ratior is based on exponential growth rate [22]. We assume that the growth rate of the model follows the exponential distribution by
\[E(t) = E(0)e^{\lambda t},\]
\[I_U(t) = I_U(0)e^{\lambda t}.\]
Substituting the E(t) and IU (t) to the Model (1) and doing algebraic manipulation to obtain
\[R_E = \left\lceil \frac{\lambda}{k} + 1 \right\rceil \left\lceil \frac{\lambda}{a} + 1 \right\rceil \tag{3}\]
where a = γ + d + σ. The Equation (3) is used to estimate the reproductive number of Equation (2). The λ is the take-off rate obtained by fitting the exponential exponential function to the real data of Indonesia and Saudi Arabia. The take-off rate λ is found by fitting the cumulative cases to the exponential function K(t) ≈ K(0)e λt. We use the following parameter values. The parameter k = 1/5.2, σ = 1/7, γ = 1/6.1 [3]. The initial values for Indonesia and Saudi Arabia are K(0) = 11.4557, K(0) = 7.9684, respectively which is obtained from the fitted data. The results are given in Table 1.
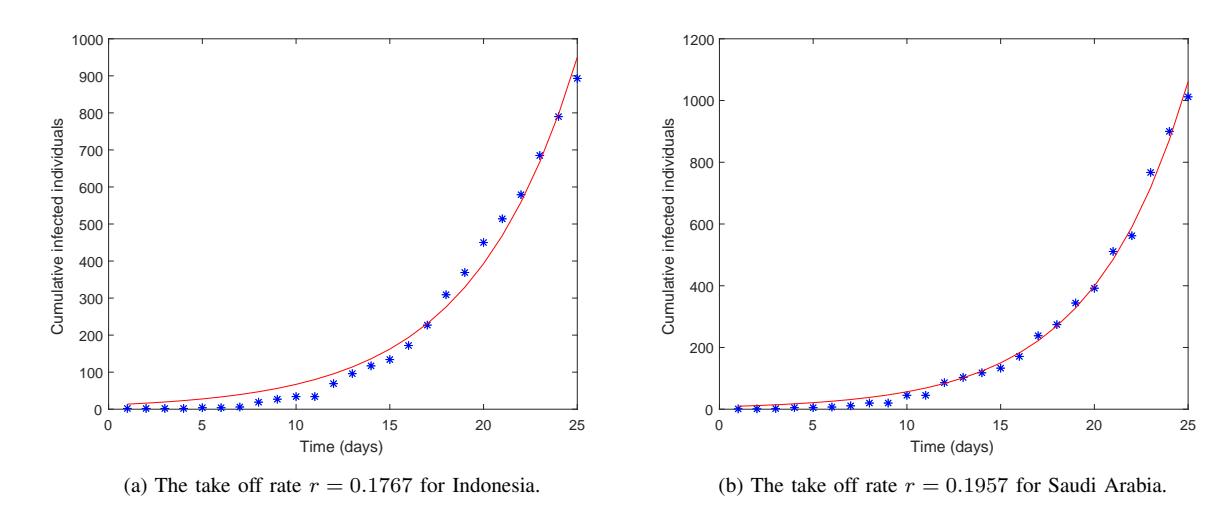
Figure 3: Fitting the exponential function to the data of Indonesia, and Saudi Arabia
Table 1: The reproductive ratio, take off rate, and the case fatality rate where the proportion of individuals who get infected is 100%.
| Location | Take off rate | CFR | R0 |
|---|---|---|---|
| Indonesia | 0.1767 | 0.087212 | 2.9685 |
| Saudi Arabia | 0.1957 | 0.01022 | 3.2985 |
3.3. Calculation of undetected cases
Based on our model, we estimate the proportion of undetected and detected quarantine cases. This is important as individuals with mild symptons or showing no symptoms are unlikely to seek for the medical examination and hence may not be reported as the Covid-19 victims. The proportion of detected cases is estimated using Equation [23].
\[C_{IQ} = \frac{\gamma}{\gamma + d + \sigma} \tag{4}\]
The proportion of undetected cases is estimated using the following equation
\[C_{IU} = \frac{\sigma + d}{\gamma + \sigma + d} \tag{5}\]
Using the Equations (4) and (5), we obtain the proportion of detected and undetected cases. We substitute the values and obtain 51% and 53% of detected cases and 49% and 47% of undetected cases for Indonesia and Saudi Arabia, respectively. The only estimated parameters is the death rate based on the case fatality ratio. We perform variation in the time required to detect infected individuals and its effects on the proportion of undetected infected individuals, and the result is given in Figure 4.
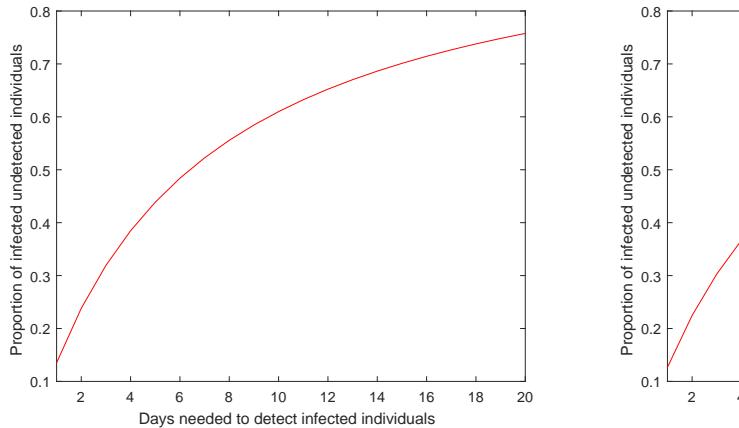
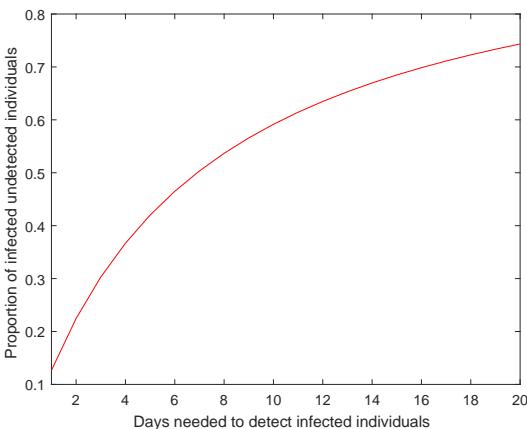
Figure 4: The proportion of undetected individuals when the time needed to detect undetected infected individuals varies. Left: Indonesia, and Right: Saudi Arabia
4. CONTINOUS TIME MARKOV CHAIN
The deterministic model acts as a basis for the development of a stochastic model. We use a Continous Time Markov Chain (CTMC) model [24, 25, 26]. The CTMC model is the following Let X(t) = (S(t), E(t), IU(t), IQ(t), R(t)). The corresponding transition probabilities are
\[\begin{aligned} \operatorname{Prob}\{(\Delta S, \Delta E) &= (-1, +1)\} = \beta S/N\Delta t + \mathcal{O}(\Delta t), \\ \operatorname{Prob}\{(\Delta E, \Delta I_U) &= (-1, +1)\} = kE\Delta t + \mathcal{O}(\Delta t), \\ \operatorname{Prob}\{(\Delta IU, \Delta I_Q) &= (-1, +1)\} = \gamma I_U\Delta t + \mathcal{O}(\Delta t), \\ \operatorname{Prob}\{(\Delta I_U, \Delta R) &= (-1, +1)\} = \sigma I_U\Delta t + \mathcal{O}(\Delta t), \\ \operatorname{Prob}\{(\Delta I_Q, \Delta R) &= (-1, +1)\} = \sigma I_Q\Delta t + \mathcal{O}(\Delta t), \\ \operatorname{Prob}\{(\Delta I_U) &= -1\} = dI_U\Delta t + \mathcal{O}(\Delta t), \\ \operatorname{Prob}\{(\Delta I_Q) &= -1\} = dI_Q\Delta t + \mathcal{O}(\Delta t), \end{aligned}\]
The offpsring probability generating function (pgf) for type i infected individual given \(I_i = 1\) and \(I_j = 0\), \(i \neq j\), \(f_i : [0,1]^n \to [0,1]\) is defined as
\[f_i(u_1, u_2, ..., u_n) = \sum_{k_n=0}^{\infty} ... \sum_{k_i=0}^{\infty} P_i(k_1, k_2, ..., k_n) u_1^{k_1} ... u_n^{k_n},\] (7)
where \(P_i(k_1, k_2, ..., k_n)\) is the probability that one individual of type i generates \(k_j\) individuals of type j [27].
The offspring probability generating function for E given E = 1, \(I_U = I_Q = 0\) is
\[f_1(u_1, u_2, u_3) = u_2. (8)\]
The offspring probability generating function for IU given IU = 1, E = IQ = 0 is
\[f_2(u_1, u_2, u_3) = \frac{\beta u_1 u_2 + \gamma u_3 + (\sigma + d)}{\beta + \gamma + \sigma + d}.\] (9)
The offspring probability generating function for IQ given IQ = 1, E = IU = 0 is
\[f_3(u_1, u_2, u_3) = 1. (10)\]
Finding the fixed points by solving the Equations (8)–(10) to obtain
\[(u_1^*, u_2^*, u_3^*) = \left(\frac{1}{R_0}, \frac{1}{R_0}, 1\right) \tag{11}\]
The fixed point in (11) is used to determine the probability of extinction. The probability of extinction is
\[P_0 = \left(\frac{1}{R_0}\right)^{E_0} \left(\frac{1}{R_0}\right)^{I_{U0}} = \left(\frac{1}{R_0}\right)^{E_0 + I_{U0}} \tag{12}\]
Note that Equation (12) shows that the probability of extinction depends on R0 and also exposed and undetected infected individuals, which implies the important of detect the infected individuals to reach the disease extinction.
5. RESULTS AND DISCUSSIONS
In this section, we assess two types of intervention strategies, which are reducing the transmission rate through the use of protective devises such as masks, social distancing, self-isolation, and increase handwashing. This is represented in the reduced transmission rate (β) by a factor between zero and one. The second type of strategies has the objective of reducing the potential of disease transmission through isolating infected individuals by speeding up the test results. This is represented by increasing the quarantine rate (γ). We quantify the single and combined impact of these two strategies on the reproductive ratio and assess the probability of disease extinction.
We calibrate the transmission rate by using the reproductive ratio given in Table 1. The R0 is estimated using Equation (3) and the transmission rate (β) is obtained using Equation (2) where the R0 is the estimated values (RE).
Results show that when the time to detect uninfected individuals takes longer, the proportion of undetected cases is higher (see Figure 4). Furthermore, an increase in the proportion of individuals who get tested is not sufficient to contain the epidemics (see Figure 5). The reproductive ratio is still above unity and the probability of extinction is low.
Figure 5 shows that the reproductive ratio is above one and the probability of extinction is very low although the time period to detect infected individuals is faster.It shows that when the time period to detect infected individuals is longer, the reproductive ratio for Saudi Arabia is higher than Indonesia and the probability of extinction is lower than that of Indonesia. Figure 6 shows that the reduction in the transmission rate can slow down the epidemics. If the transmission rate can be reduced up to 70%, the reproductive ratio goes below unity and the probability of extinction is unity. It also shows that the reproductive ratio is below unity and the probability of extinction is close to one if the reduction in transmission rate is around 67% for Indonesia and 70% for Saudi Arabia. The probability of extinction is above 0.5 if the proportions of reduction in the transmission rates are 61% and 64% for Indonesia and Saudi Arabia, respectively.
Figure 7 shows that if the transmission rate is reduced, the reproductive ratio will also reduce. Furthermore, it can be seen that if we reduce the transmission rate by around 0.4, the reproductive ratio is still above one although the time period to detect infected individuals is faster. The similar results can be found for the probability of extinction. If the time to detect infected individuals is faster (i.e 2 days), a 60% reduction in the transmission rate is sufficient to lead to disease extinction (P0 = 1). On the other hand, if the time to detect individuals is faster and the proportion of reduction in the transmission rate is low (i.e 0.3), it is not sufficient to lead to disease extinction. The results imply that the reduction in the transmission rate is sensitive and can slow down the epidemic. The results imply that although the time period to detect infected individuals is short, it cannot reduce the disease transmission if there is less reduction in the transmission rate. Therefore, a combination both strategies are important to slow down the epidemics.
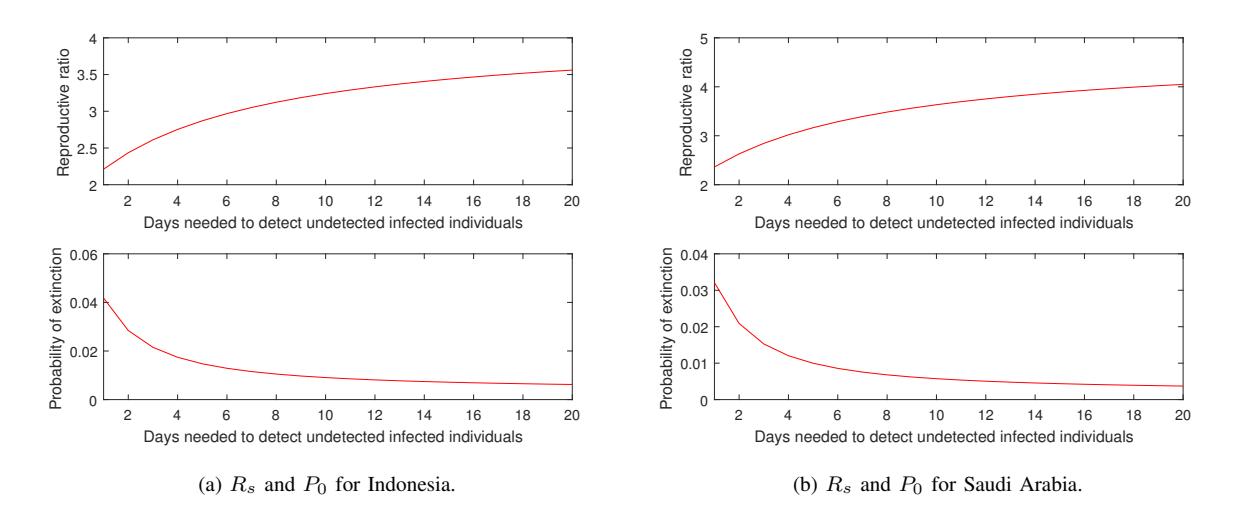
Figure 5: Plots of the reproductive ratio and the probability of extinction with variation on the proportion of uninfected individuals who get tested for Indonesia, and Saudi Arabia
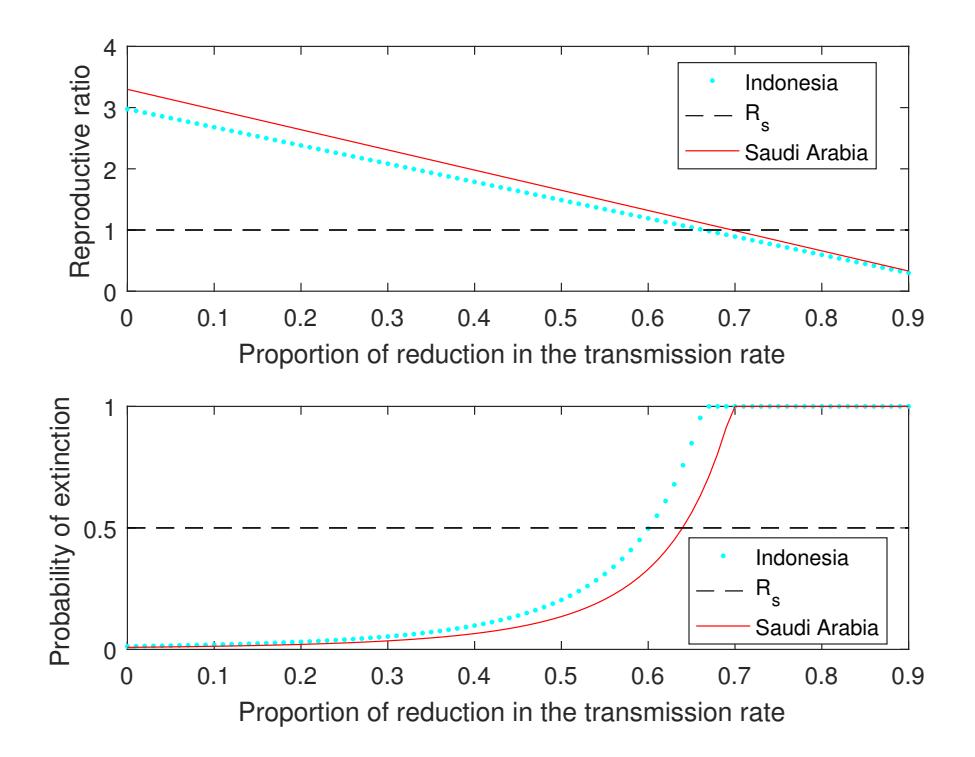
Figure 6: Plots of the reproductive ratio and the probability of extinction when varying the reduction in transmission rate for Indonesia, and Saudi Arabia
In this paper, we assume that once the test results are obtained, infected individuals are directly quarantined.
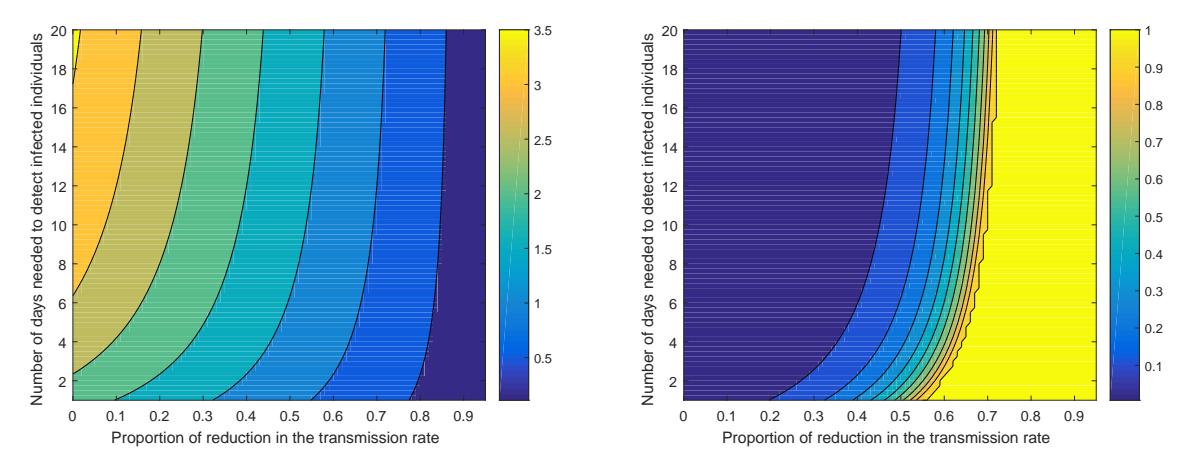
Figure 7: The values of \(R_0\) (left) and \(P_0\) (right) when varying the proportion of reduction in transmission rate and time period to detect infected individuals.
This is ideal condition. However, due to limited capacity, in reality, infected individuals might not be directly quarantined. Let denote, \(\alpha\), proportion of the infected individuals quarantined, then the rate of individuals that progress from \(I_U\) class to \(I_Q\) class is \(\alpha\gamma\). The detail analysis is the subject of the future work.
6. CONCLUSIONS
This paper presents a deterministic and stochastic mathematical model to determine the probability of extinction of Covid-19 transmission. We also calculate the proportion of undetected infected individuals. In general, reducing the transmission rate can reduce the transmission of Covid-19, although the time needed to detect infected individuals is longer. However, if the time period to detect infected individuals is longer, the proportion of undetected infected individuals is higher.
ACKNOWLEDGEMENT
The authors thank the anonymous referees for constructive comments which have improved the paper. We acknowledge funding from Ministry of Education and Culture through Penelitian Dasar Unggulan Perguruan Tinggi (2019-2020). We also acknowledge Dr. Ali S. Alarjani from Prince Sattam bin Abdulaziz University for suggesting the analysis of Saudi Arabia data.