

1. INTRODUCTION
After WHO declaration of COVID-19 as pandemic on March 11, 2020 [1], the broader community throughout the world has been affected by a situation of panic and anxiety. Although the pandemic procedure was immediately followed up by the government, public concern continued to increase by the spread of news and issues that addressed the virus. The sea and air transportation were cancelled, many universities replaced their lecture system with online lectures, and even the Governor of DKI Jakarta released regulations to close schools for two weeks [2]. Are all of these steps necessary to prevent the spread of Coronavirus? Do public health officials overreact to the threats posed by the virus that causes COVID-19 disease?
According to medical historian Howard Markel, M.D., Ph.D., a University of Michigan expert who has studied the effects of similar responses to past epidemics, those steps are absolutely necessary. "An outbreak anywhere can go everywhere. We all need to pitch in to try to prevent cases both within ourselves and in our communities" [3]. This message can be interpreted that prevention measures in accordance with the pandemic standard procedures must be carried out without the need to wait for the case to reach a certain level. Otherwise, it could be too late to do it. There is a quite interesting article written by Thomas Pueyo on medium.com [4], discussing the problem of what needs to be done when we face COVID-19. This article presents data and analysis from various sources and actions that need to be taken.
In a report released on the scientist.com [5], journalist David Adam mentioned that scientists were struggling to predict how this COVID-19 spread behaves. John Edmunds from the Centre for the Mathematical Modelling of Infectious Diseases at the London School of Hygiene & Tropical Medicine stated that most of the work that modelers have not presented models and predictions, instead they focused around epidemiological characterization.
In this work, we provide analysis with simple calculations related to the rate of increase of COVID-19 cases in Indonesia. This analysis is carried out by comparing the rate of increase in incident data in several countries. Due to the massive infections, China, South Korea, Italy, Iran, and the USA were chosen as a reference to determine the model parameters for data in Indonesia. In addition, comparison with the accumulation of cases throughout the world is also shown.
∗Corresponding author
Received March 24th, 2020, Revised April 1st, 2020, Accepted for publication April 16th, 2020. Copyright ©2020 Published by Indonesian Biomathematical Society, e-ISSN: 2549-2896, DOI:10.5614/cbms.2020.3.1.1
2. MODEL FORMULATION
Some online sites provide data updates about the number of sufferers of this disease in various countries, for example [6], [7], [8], [9], [10]. The data used in this analysis were obtained from Oxford University data and statistics [10], as shown in Figure 1.
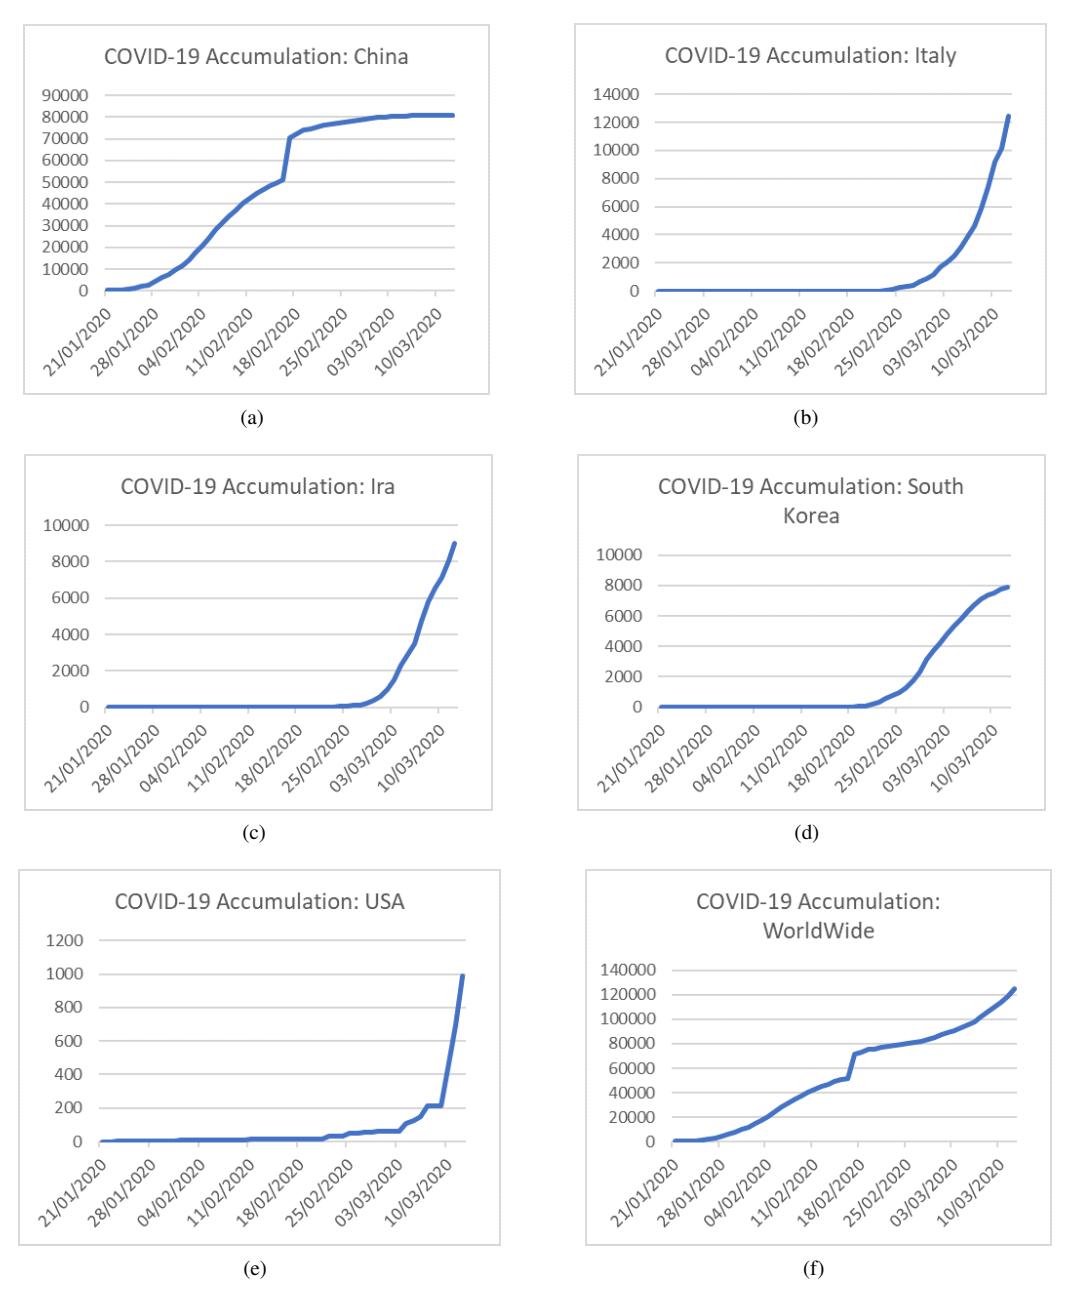
Figure 1: Number of infected from Januari 21 until March 13, 2020. (a) China, (b) Italy, (c) Iran, (d) South Korea, (e) USA, and (f) worldwide.
Daily data on the number of people infected with nCOVID-19 above were used to build our model. In this work, we use Richard's Curve that was introduced by F.J. Richards [11] as our model, which is an advancement of the logistics model. It was shown that this model gave good results to determine the beginning, the peak and the end of SARS endemic disease in Hong Kong in 2003 [12].
According to Richard, the growth function can be obtained by solving differential equation
\[\frac{dy}{dt} = \frac{r}{\alpha}y\left(1 - \left(\frac{y}{K}\right)^{\alpha}\right) \tag{1}\] where r, K and \(\alpha\) denote the initial growth rate (person / day), the carrying capacity, and asymptotic effect, respectively. Observe that when \(\alpha=1\), the equation turns into the classical logistic differential equation. The solution to this differential equation is given by
\[y(t) = \frac{K}{\left(1 + \alpha \exp\left(-r(t - t_m)\right)^{1/\alpha}\right)} \tag{2}\]
There are four parameters that need to be estimated from data, namely \(K, r, \alpha\), and \(t_m\).
To find the characteristics of incident for each country that we choose for reference, the model in (2) is fitted to the incident daily data in those countries using Least Square Method. The results are presented in Table 1. The dynamics obtained using the corresponding parameter values are shown in Figure 2 and Figure 3.
Table 1: Parameter values for Richard Curve model for incident data of COVID-19 in five countries.
| Country | K | r | \(\alpha\) | \(t_m\) | RMSE |
|---|---|---|---|---|---|
| China | 82000 | 0.2 | 1.017 | 20.41 | 2940.85 |
| Italy | 132983 | 0.081 | 0.148 | 63.92 | 91.00 |
| Iran | 12860 | 0.2 | 0.182 | 46.49 | 67.48 |
| South Korea | 8495 | 0.2 | 0.41 | 40.12 | 51.77 |
| USA | 60292 | 0.1 | 0.166 | 69.19 | 33.73 |
In general, Richard's Curve and Least Square Method provide models that adequately represent the dynamics of nCOVID-19 sufferers in each country reviewed. For example, the model shows that the number of patients in China is relatively constant around 80,000 after February 25, 2020. The model also shows that the number of new cases that have decreased significantly after February 11, one week later than the one that is shown by the data. But we think that it is relatively still in a good agreement. A similar behavior also occurs in South Korea where the model can relatively fit the data quite well.
After constructing the model for the the five countries above, the parameters obtained in Table 1 are used to simulate the expected number of nCOVID-19 cases in Indonesia through the Richard Curve approach. Thus, each parameter set from each country in Table 1 is used for prediction and the results are compared. Based on the data in [10], Indonesia began the case on February 2, 2020 with a total of two patients. This number did not increase until March 7, 2020. Thus, a simulation was carried out with the initial values of two patients where the simulation started on March 7, 2020. The results of the simulation and comparison with real data in Indonesia until March 14, 2020, are shown in Figure 4.
From the results above, it can be observed that our data is relatively well fitted by the Richard's Curve using the parameter values for South Korea. Therefore in the next section, we predict the number of COVID-19 cases in Indonesia using the parameter values for South Korea. We admit that this is a crude calculation with a very strong assumption, where we assume that the situation or the strategy to handle the pandemic in Indonesia is as effective as in South Korea.
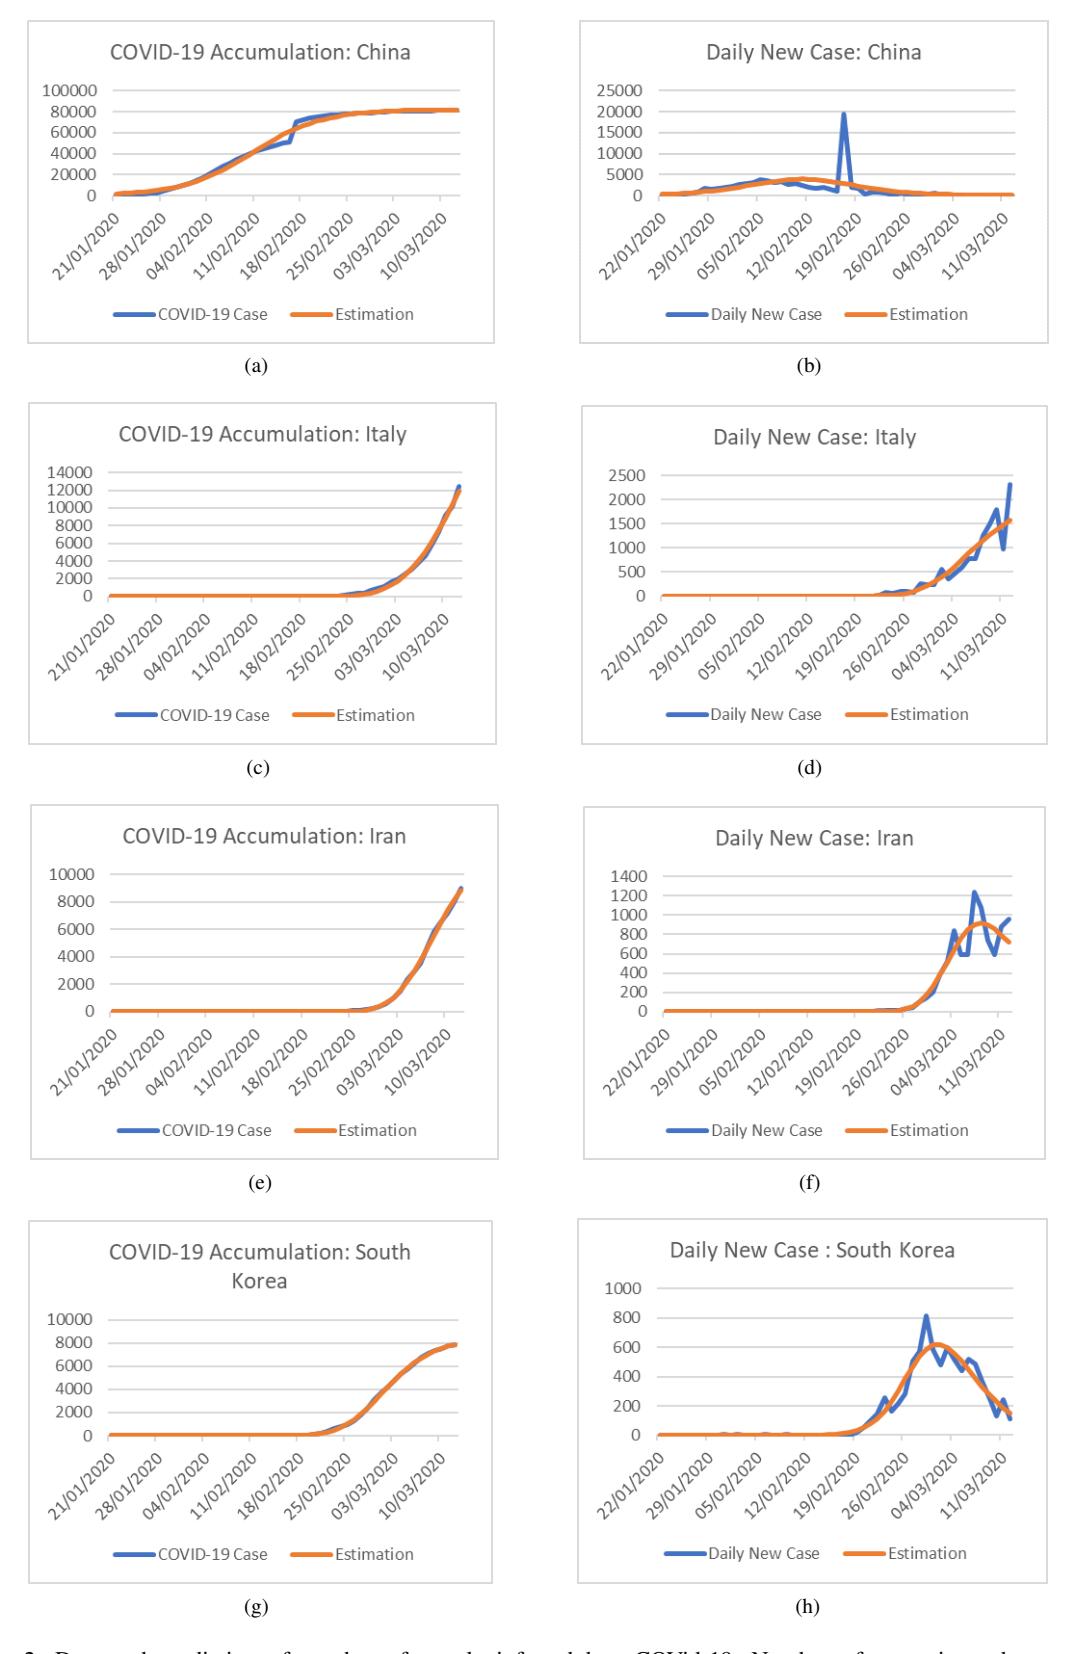
Figure 2: Data and prediction of number of people infected by nCOVid-19. Number of cases in each country is (a),(c),(e),(g) whereas (b),(d),(f),(h) is the number of daily cases.
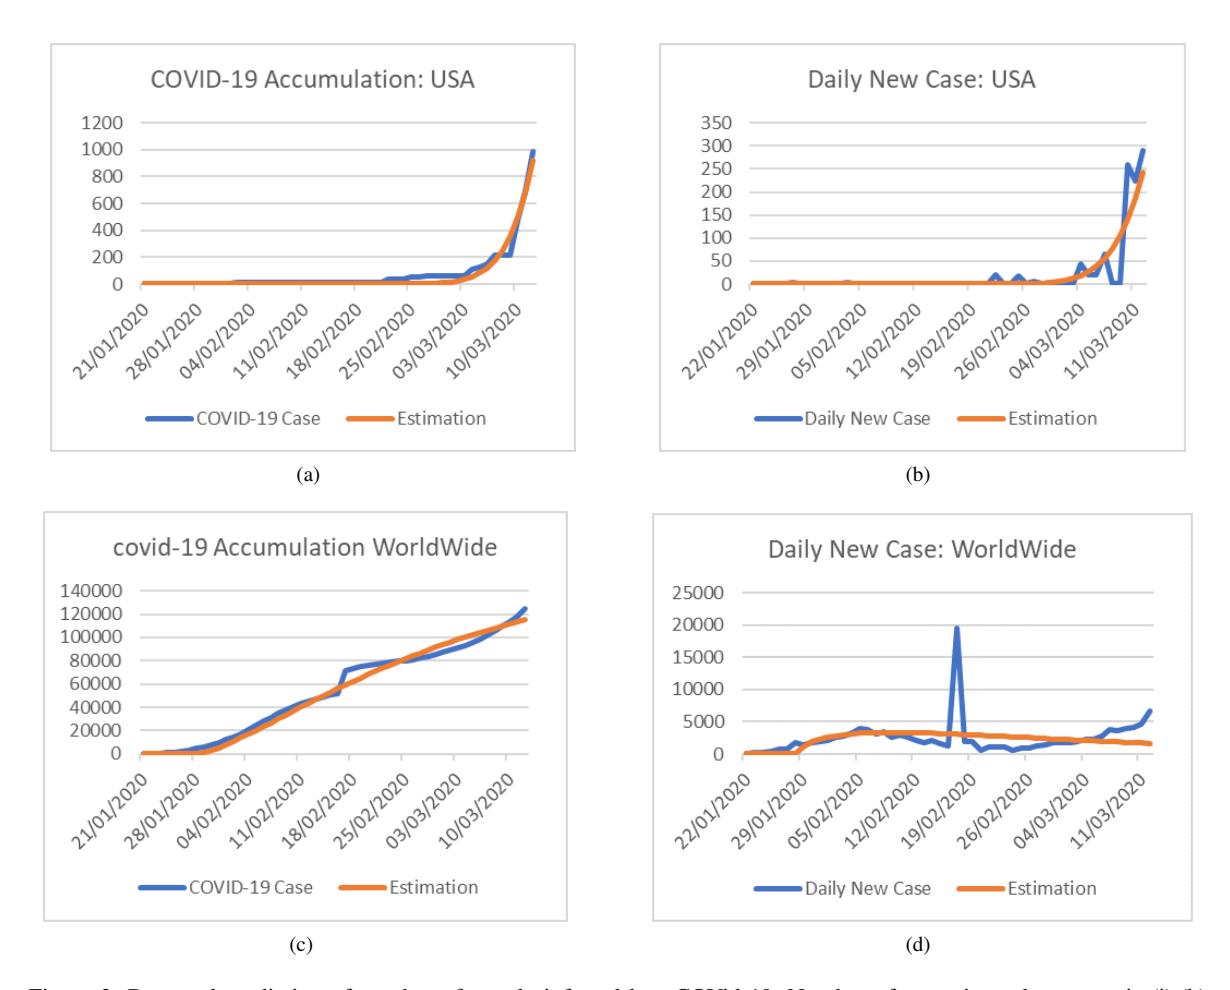
Figure 3: Data and prediction of number of people infected by nCOVid-19. Number of cases in each country is (i),(k) whereas (j),(l) is the number of daily cases.
3. RESULTS
Using the parameter values for South Korea, the projection of cases in Indonesia is shown in Figure 5. From the simulations above, we found that based on the Richard's curve, the epidemic of nCOVID-19 in Indonesia
- Starts of epidemic: begin of March 2020
- Peak of epidemic: end of March 2020
- End of epidemic: mid of April 2020
- Number of cases: more than 8000 cases
- Largest daily case: ± 600 cases
What needs to be underlined from this result is that it is obtained using the estimated model parameters from South Korea data that is considered to have been quite successful in implementing the strategy with a very high discipline to prevent the spread of COVID-19. It can be imagined if these preventive measures are not taken seriously in Indonesia, then the number of cases may multiply in tens, hundreds, thousands and even millions of cases than the one that is predicted. Of course this model approach is still simple and is not perfect. But, basically all the models point to the same message: We do not know the actual number of cases, but clearly the cases that occur are much higher than those reported. Maciej Boni, a biologist at Penn State
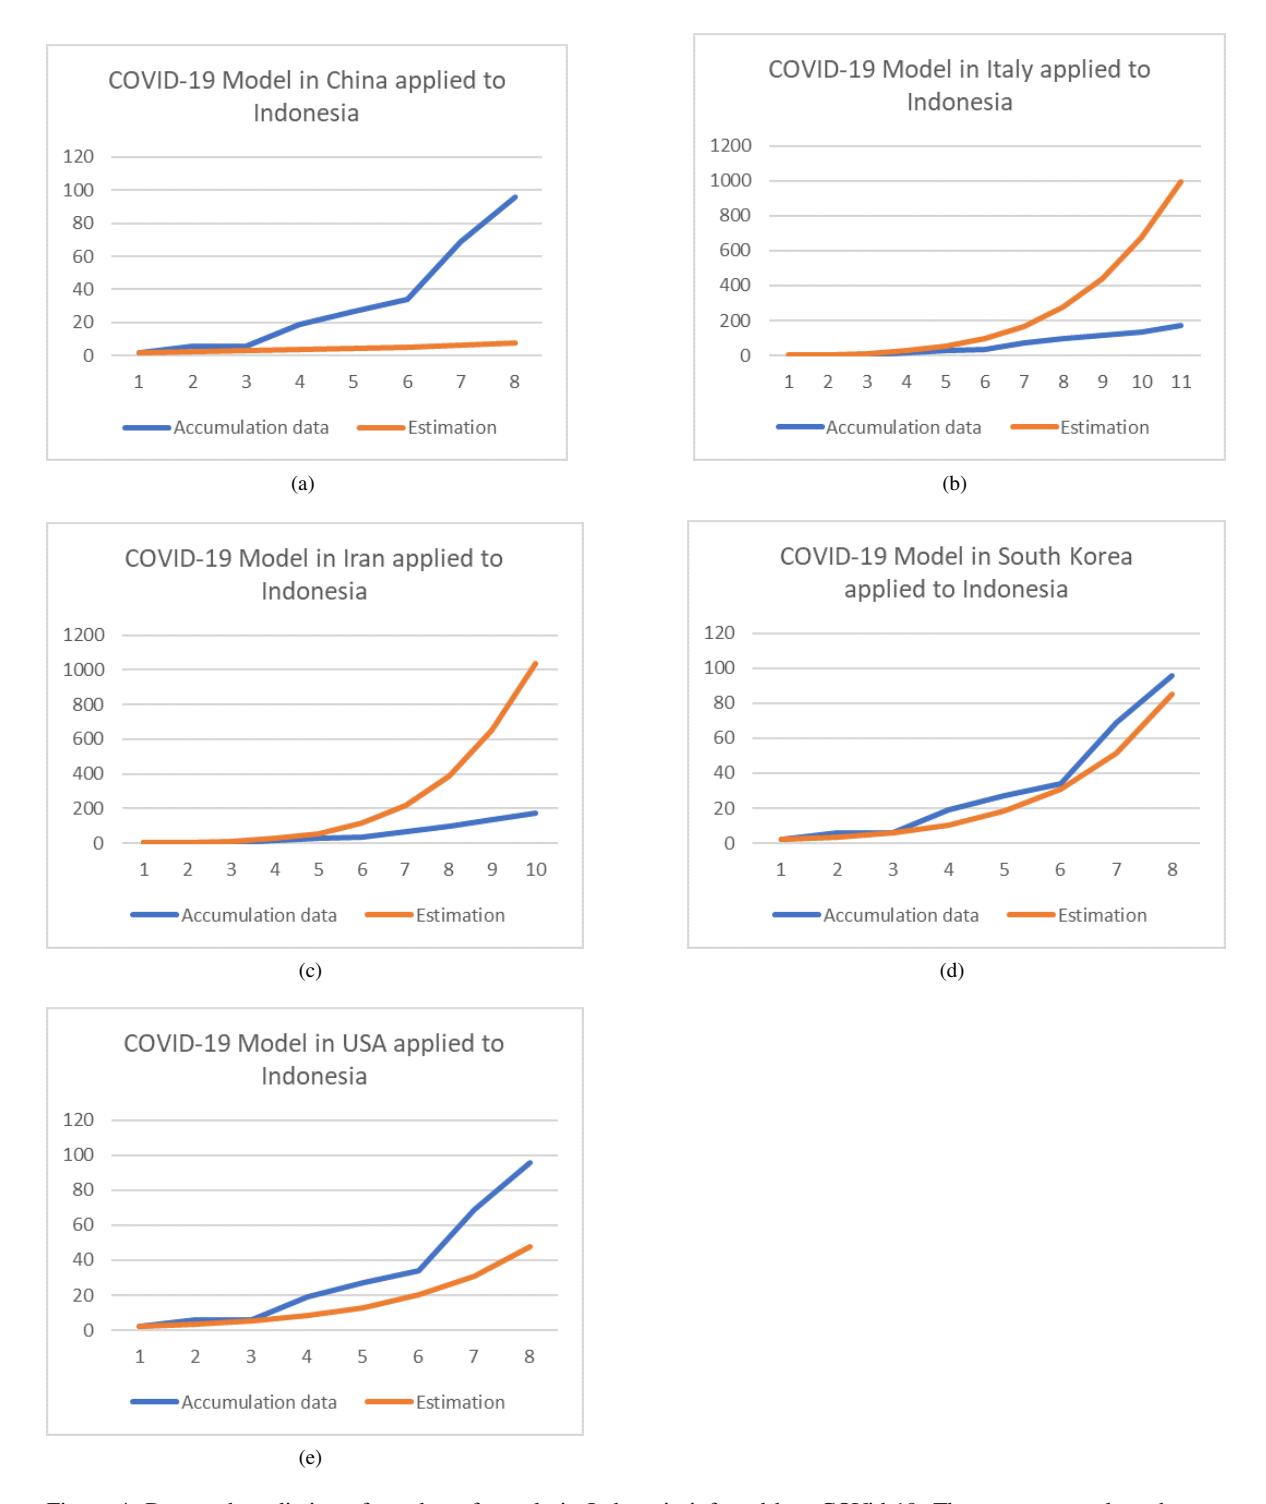
Figure 4: Data and prediction of number of people in Indonesia infected by nCOVid-19. The parameter values that we use are based on the parameter values in (a) China, (b) Iran, (c) Italy, (d) South Korea, (e) USA.
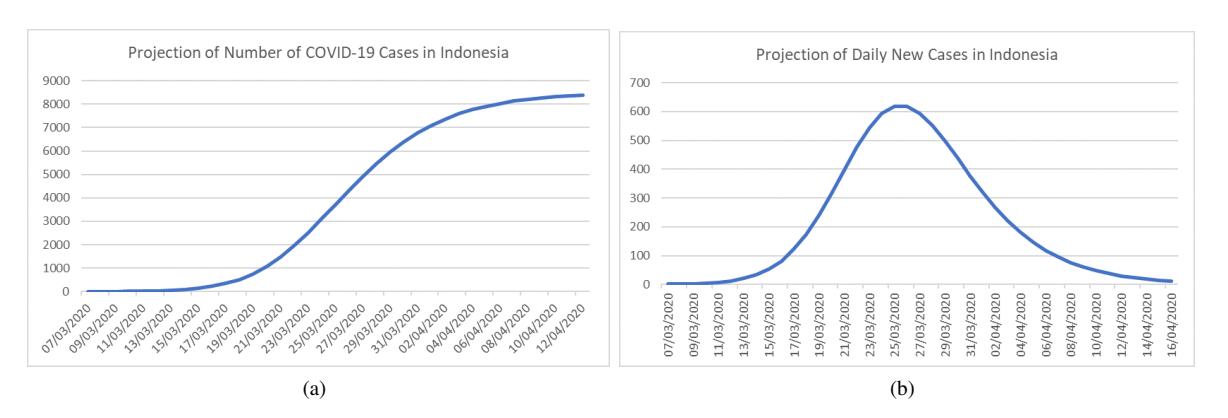
Figure 5: Predicting the number of COVID-19 case in Indonesia using parameter values for South Korea. (a) Prediction of the accumulated case, (b) Prediction of daily new case.
University who has studied the spread of influenza in tropics region says, the high number of undetectable cases means the spread of the virus cannot be traced to the number of confirmed infections [5].
4. CONCLUSIONS AND DISCUSSIONS
We have built a simple model to predict the pandemic of COVID-19 in Indonesia. The model is based on the Richard's Curve [11]. Because the initial trend of the data in Indonesia until March 14, 2020 is similar to that in South Korea, we use the same parameter values that are obtained from data in South Korea. It is very important to notice, however, that by doing this we assume that the strategy and the policy that are made in Indonesia is as effective and efficient as in South Korea. Since the result tells us that the pandemic will end in the mid of April, we call this model as an optimistic prediction. This is because according to the prediction, the pandemic will end soon. However, if the assumption of the efficacy of the strategy fails to be fulfilled, then the prediction might really deviate from the real data. In this case, the model should be updated by incorporating the new hypothesis or information and the advancement of the real data.
Another lack of our approach is that it is difficult to obtain the basic reproduction number R0, which is very important to see whether the disease is going to spread in the population. Even if we calculate it as multiplication between the infection rate, the infection rate, and the period of infection, it is still quite crude. Thus, another approach should be used to get a better estimate on R0.
Our model is a very simple model, consists of only one equation. Certainly, it is not the best model to describe the phenomena and might not be able to capture the detail mechanisms of how the disease spread. In fact, it is our preliminary result of our research for the COVID-19 disease that are currently occur in Indonesia. However, with this result we hope that people in Indonesia will be more aware that even in the control that is very effective as in South Korea, a large number of people will still get infected and need treatments. Thus, it is very important for us to take actions immediately to prevent the spread of the virus to get worse.
In the near-future, we are going to update our model by incorporating some actions that can be taken to control the disease. Some of these actions are for example to quarantine infected people and to apply social distancing. Social distancing can be interpreted as to stay away from the crowd and limit the desire to leave the house without important needs. Working from home, online learning, canceling or delaying recreation and other mass activities may be uncomfortable, annoying, and disappointing. But it is worth the risk we will face if we ignore it. In addition, it is very important to be discipline in maintaining personal and environmental hygiene in accordance with the guidelines given by the public health.
Supported by good information, a mathematical model can help to determine policies to control the spread of the disease. At present, the development of models to accommodate various choices of control strategies, mapping spatial distribution and other prevention strategy proposals are being constructed by many experts and are expected to provide input to decision makers at the regional and central government levels.
ACKNOWLEDGEMENT
This study was funded by Riset KK ITB 2020.