

1. INTRODUCTION
Citizens all over the world today are shocked and alert at how quickly the Covid-19 epidemic is spreading. Most governments already imposed extraordinary emergency status, social distancing regulation, and even lock-down. WHO, in the recent report [1] announced that there were 234,073 confirmed cases globally and 9,840 deaths. As the cases are still increasing and becoming a pandemic, WHO officials are sending a statement of airborne precautions for Covid-19 healthcare workers [2].
The spread of the disease was originated in Wuhan city, China, in December 2019 and initially identified with the name Corona-19 [3], [4]. It was suspected that the spread started from the Wuhan Fish Market and quickly becoming a human-to-human transmission. In relatively short time, the disease spread through out the country. Only within one month the diseases was transmitted to other countries and recently already affecting people in nearly 200 countries.
With no vaccine available in the market and no proven medicine to cure the disease, most affecting countries enforce isolation for infected and suspected people. WHO released a protocol to prepare for emergencies by identifying, mitigating and managing risks [5]. Publicly this protocol is known with the government instruction in physical distancing, contact tracing and isolation.
The difficulty in preventing and controlling the Covid-19 disease is characterized by the rapid spread of human-to-human infection and with high human mobility. Three corona cases are discussed here, in which the initial infection started with a single or a group of infected persons and no other imported case during the period of observation.
Wuhan, the city with approximately ten million people, has been known as the first epidemic city with a big Covid-19 cluster in which no imported case for more than two months. At the end of December 2019, the official discovered pneumonia cases of unknown cause with fever and breathing difficulty symptoms. Later on January 3, 2020, unexpected new cases increase with 44 patients [3].
For the second case, the Covid-19 transmission is chosen at the Diamond Princess cruise ship. There were 3,711 people on board consisting of 2,666 passengers and 1,045 crew members. The transmission was initiated with a passenger who got infected when the person disembarked in Hong Kong on January 25 during the stops of the ship. On February 3, the ship arrived in Yokohama, and the Japanese government requested the ship stay at port, and no passengers and crews were allowed to disembark from the ship. Quarantine officials checked all passengers and crew, and those who were positive with corona were isolated in their room for 14 days. The ship was lock-down, and there was no incoming infection from the outside of the ship[6].
The case of Jakarta started with an imported case in the mid of February 2020 and developed a cluster, which was identified as Jakarta-cluster consisting eleven new cases. Later on, the cases in the Jakarta city grew very fast with new incoming imported cases. All these three clusters are investigated here to get an understanding how the infection started and ended as well as how the intervention contributes in the elimination of the diseases [7].
An SEIR flu transmission model is chosen in Section 2 to analyze the infection progress of Covid-19 disease. The description of the data from Wuhan, Diamond Princess, and Jakarta-cluster cases are presented in Section 3. Intervention with contact tracing and isolation is discussed in Section 4. In Section 5, an operator on the cumulative case is constructed to identify the completion time of the intervention. This operator is useful for analyzing the effectiveness of the contact tracing and isolation for a given cumulative data of Covid-19 in a given region.
2. MODEL FORMULATION
A simple model of flu transmission of SEIR type can be used for the early infection of Covid-19 virus
\[\frac{dS}{dt} = \pi - a \frac{SI}{N} - \mu S\] \[\frac{dE}{dt} = a \frac{SI}{N} - \alpha E - \mu E\] \[\frac{dI}{dt} = \alpha E - \gamma I - \mu I\] \[\frac{dR}{dt} = \gamma I - \mu R.\] (1)
The description of parameters in model (1) could be seen in Table 1. Early SEIR model of Covid-19 transmission, which are implemented in the cases in China and Japan, have recently appeared [8], [9], [10]. Modeling of the spread from Wuhan to other provinces in China is shown in [8]. Analysis of the spread in China using AI indicating the consequence of delay in the intervention is done in [9]. Prediction of epidemic peak in Japan is shown in [10].
The basic reproductive ratio of the System (1) is obtained as follow
\[R_0 = \sqrt{\frac{a\alpha}{(\alpha + \mu)(\gamma + \mu)}}.\] (2)
Table 1: Description of parameters
| Parameter | Description | |
|---|---|---|
| π | recruitment rate | |
| µ | Natural death rate | |
| α | 1/(average incubation period) | |
| γ | 1/(average infection period) | |
| a | Average new infections | |
| from a single infected | ||
| person per unit time | ||
Note that the unobservable parameter a is unknown. This parameter represents the number of per unit time new infection(s) when a single infected person enters the fully susceptible population. With limited data, it is not easy to give a good estimate of the parameter a. For short period of transmission, the natural death rate µ, which are relatively much smaller than γ, can be ignored and the the basic reproductive ratio (2)can be reduced as
\[R_0 \approx \bar{R}_0 = \sqrt{\frac{a}{\gamma}}. (3)\]
Here we construct the basic reproductive ratio using the take-off rate at the early infection [11], [12] by assuming that the incidences as well as the cumulative incidence K(t) grow with a take-off rate θ during the take-off period:
\[E(t) \approx E(0)e^{(\theta t)}\] \[I(t) \approx I(0)e^{(\theta t)}\] \[K(t) \propto e^{(\theta t)}\] (4)
By substituting (4) into (1), where at the early infection S(t) ≈ N, we have
\[\left(\frac{\theta}{\alpha+\mu}+1\right)E(0) = \frac{a}{\alpha+\mu}I(0) \left(\frac{\theta}{\gamma+\mu}+1\right)I(0) = \frac{\alpha}{\gamma+\mu}E(0)\] (6)
We have now a representation of the basic reproductive ratio (2) in term of the take-off rate θ as
\[R_0 = \sqrt{\left(\frac{\theta}{\alpha + \mu} + 1\right) \left(\frac{\theta}{\gamma + \mu} + 1\right)},\tag{7}\]
and the infection rate
\[a = \frac{(\theta + \alpha + \mu)(\theta + \gamma + \mu)}{\alpha}.\] (8)
3. DESCRIPTION OF THE INCIDENCE DATA
The choice of three Covid-19 locations are based on the similarity of the field condition of transmission. Wuhan city is considered as the start of the transmission and there was no imported case. Hence the transmission model can be formulated with a given initial condition. The same condition occurred at the Diamond Princess ship, in which during a certain period all people on board were lock down in the ship and the infection started a single infected person. The case of transmission in Jakarta is basically similar to the cases in most countries, which came from imported cases. It is the interest here to understand how fast a cluster of transmission is progressing when a single imported case arrived in a location.
The Wuhan data came from five different sources [3], [13], [14], [15], [8], [16]. Detail information of the daily new cases, new discharge and death are available in [16]. With this detail information we can construct the daily infected cases. There is a significant jump of infection on January 28. This may came from the new and more accurate treatment mechanism in the testing.
Table 2: Cases in Wuhan
| Date | Year | Cumulative cases | Total Daily Infected | References |
|---|---|---|---|---|
| rd Jan 3 | 2020 | 44 | 44 | [3] |
| th Jan 5 | 2020 | 103 | 103 | [13] |
| Jan 10th | 2020 | 144 | 144 | [14] |
| Jan 19th | 2020 | 280 | 280 | [15] |
| Jan 20th | 2020 | 478 | 478 | [8], [15] |
| Jan 24th | 2020 | 870 | 870 | [15] |
| Jan 28th | 2020 | 1520 | 1520 | [16] |
| Jan 29th | 2020 | 2261 | 2261 | [16] |
| Jan 30th | 2020 | 2639 | 2639 | [16] |
| Jan 31st | 2020 | 3215 | 3215 | [16] |
| th F eb 1 | 2020 | 4109 | 4104 | [16] |
| th F eb 2 | 2020 | 5142 | 5030 | [16] |
| th F eb 3 | 2020 | 6384 | 6145 | [16] |
| th F eb 4 | 2020 | 8351 | 7998 | [16] |
| th F eb 5 | 2020 | 10117 | 9649 | [16] |
| th F eb 6 | 2020 | 11618 | 10983 | [16] |
| th F eb 7 | 2020 | 13603 | 12737 | [16] |
| th F eb 8 | 2020 | 14982 | 13874 | [16] |
| th F eb 9 | 2020 | 16902 | 15554 | [16] |
| F eb 10th | 2020 | 18454 | 16877 | [16] |
| F eb 11th | 2020 | 19558 | 17738 | [16] |
| F eb 12th | 2020 | 32994 | 30420 | [16] |
| F eb 13th | 2020 | 35991 | 32959 | [16] |
| F eb 14th | 2020 | 37914 | 34289 | [16] |
| F eb 15th | 2020 | 39462 | 35314 | [16] |
| F eb 16th | 2020 | 411152 | 36385 | [16] |
| F eb 17th | 2020 | 42752 | 37152 | [16] |
| F eb 18th | 2020 | 44412 | 38020 | [16] |
| F eb 19th | 2020 | 45027 | 37994 | [16] |
| F eb 20th | 2020 | 45346 | 36448 | [16] |
| F eb 21st | 2020 | 45662 | 36682 | [16] |
| F eb 22nd | 2020 | 46201 | 36174 | [16] |
| F eb 23th | 2020 | 46607 | 35674 | [16] |
| F eb 24th | 2020 | 47071 | 34691 | [16] |
| F eb 25th | 2020 | 47441 | 33563 | [16] |
| F eb 26th | 2020 | 47824 | 32392 | [16] |
| F eb 27th | 2020 | 48137 | 30179 | [16] |
| F eb 28th | 2020 | 48557 | 26636 | [16] |
| F eb 29th st | 2020 | 49122 | 27700 | [16] |
| Mar 1 nd | 2020 | 49315 | 25903 | [16] |
| Mar 2 rd | 2020 | 49426 | 24144 | [16] |
| Mar 3 th | 2020 | 49540 | 22368 | [16] |
| Mar 4 th | 2020 | 49671 | 21050 | [16] |
| Mar 5 th | 2020 | 49797 | 20115 | [16] |
| Mar 6 th | 2020 | 49871 | 19011 | [16] |
| Mar 7 th | 2020 | 49912 | 17772 | [16] |
| Mar 8 th | 2020 | 49948 | 16627 | [16] |
| Mar 9 | 2020 | 49965 | 15732 | [16] |
Note that the total daily infected cases are calculated after the cumulative cases is reduced by the total discharge and total death.
The Diamond Princess data which are relatively within short period of time, were collected from [6], [17], [18]. It is assumed that during this period none of the infected person was fully recovered and discharged from the ship
Data of Jakarta-cluster were collected from the daily press released from the Indonesian Speaker of Corona [7]. It is assumed that the cluster ended with 12 infected people for 30 days.
| Date | Cumulative cases | References |
|---|---|---|
| st 2020 F eb 1 | 1 | [6], [17] |
| th 2020 F eb 4 | 10 | [6], [17] |
| th 2020 F eb 6 | 51 | [6], [17] |
| th 2020 F eb 9 | 117 | [6], [17] |
| F eb 11th 2020 | 156 | [6], [17] |
| F eb 12th 2020 | 200 | [6], [17] |
| F eb 16th 2020 | 267 | [6], [17] |
| F eb 18th 2020 | 436 | [6], [17] |
| F eb 20th 2020 | 621 | [18] |
Table 3: Cases at the Diamond Princess Cruise Ship
Table 4: Cases in Jakarta-cluster (Infection from imported case is not included)
| Date | Year | Cumulative Cases | References |
|---|---|---|---|
| F eb 14th | 2020 | 1 | [7] |
| F eb 26th | 2020 | 2 | [7] |
| nd March 2 | 2020 | 3 | [7] |
| th March 6 | 2020 | 5 | [7] |
| th March 8 | 2020 | 6 | [7] |
| th March 9 | 2020 | 10 | [7] |
| March 10th | 2020 | 12 | [7] |
3.1. Estimation of the take-off rate
We estimate the exponential growth rate θ with the incidence data in Table 2, 3, 4 as follows. During the early infection, none of the infected person was fully recovered and we have the cumulative incidence is identical to the daily incidence. Estimate values of θ are done by simulations are shown in Figure 1 for the cumulative cases with an initial infection I(0) at the day-0. In the simulation, the parameter values of infection is taken as follow. The average incubation period is 8 days [9], and the average recovery period is 10 days [10].
Figures 1a,1b,1c are selected from the best fit of K(t) = K(0)e θt to the first few days of the cumulative data in each cluster. By substituting this estimate of θ into (7) we have the estimate for the the basic reproductive ratio for the Covid-19. Further we obtain the estimate of the infection rate a from the Equation (5). Here the initial value K(0) = 10 is chosen for Wuhan, assuming that at the initial infection time more people were simultaneously infected at the Wuhan sea food market. For the case of Diamond princess and Jakarta-cluster, the initial infection is K(0) = 1, which came from an imported case. The estimate values of R0 and a in each cluster follow from (7,8) and are given in Table 5.
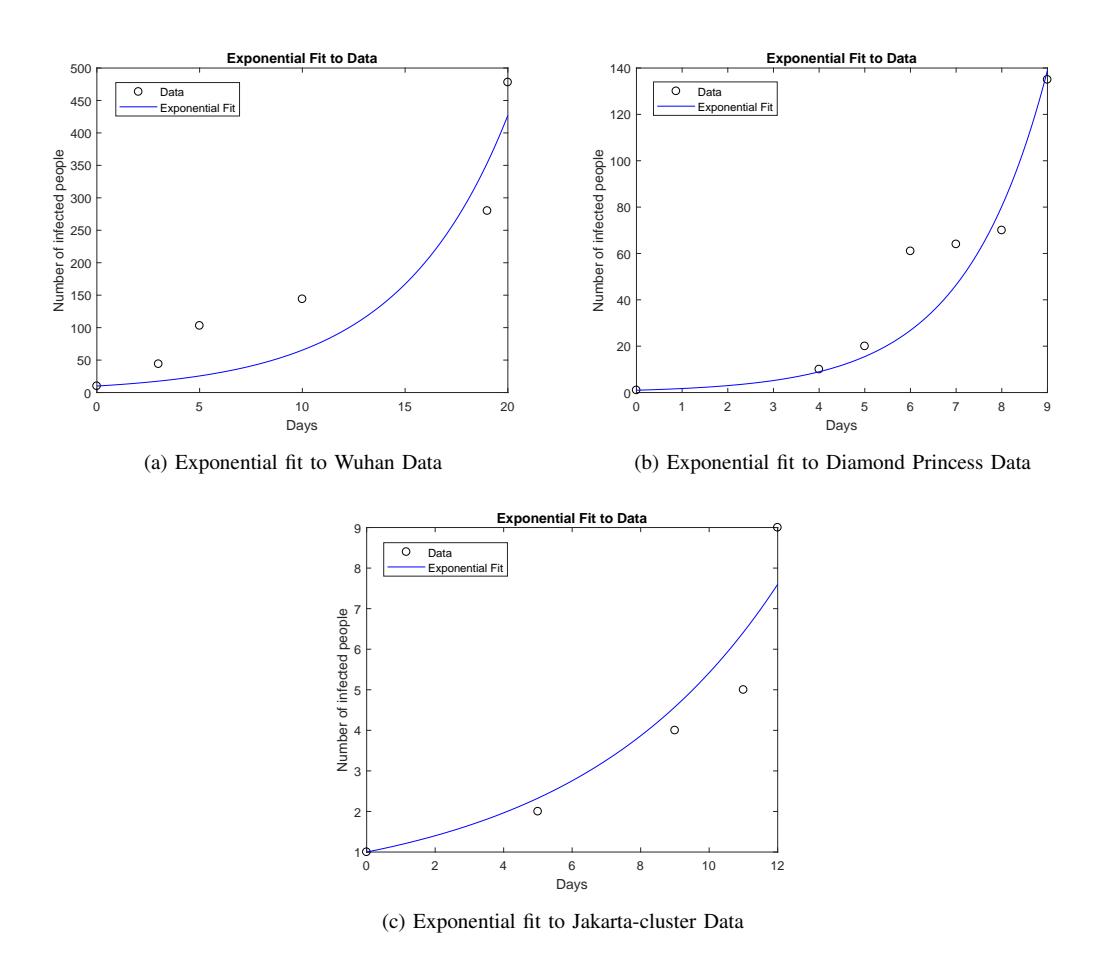
Figure 1: Estimation of \(\theta\) for (a) Wuhan case, (b) Diamond Princess case, and (c) Jakarta-cluster case
Table 5: Estimate values of \(\theta\), \(R_0\), and a
| Case | θ | \(R_0\) | a |
|---|---|---|---|
| Wuhan | 0.2729 | 3.4444 | 1.1873 |
| Diamond Princess | 0.5483 | 5.9076 | 3.4924 |
| Jakarta-cluster | 0.1690 | 2.5148 | 0.6329 |
From Table 5, in line with the property (2,3) we have \(R_1:R_2:R_3=\sqrt{a_1}:\sqrt{a_2}:\sqrt{a_1}\), where the index 1,2,3 represent the case Wuhan, Diamond Princess and Jakarta-cluster respectively.
4. EFFECT OF CONTACT TRACING AND ISOLATION
Contact tracing for people with close contact history with infected persons, which is followed by rapid testing and isolation of suspects are commonly done in the Covid-19 control and prevention. This process is not easily implemented in the field, time-consuming and, very costly. The process starts by identifying people who have close contact with a single infected person and put them under self-quarantine and being monitor for their daily infection status. Those who are already confirmed with infected status are isolated for special care and treatment.
Identification of infected people can be done only with proper testing and takes some time before the person is confirmed positive with Covid-19. Suspected people who have contacts with those infected are even more difficult to identify completely. Those who are infected and not yet isolated may have a possibility to infect others. As the number of successful isolation and identification of contact tracing increases, the new cases from the contact between infected and healthy people are decreasing. The contact tracing can be declared as entirely successful when new cases are coming only from the transition from the suspected who are already isolated.
A simple model of contact tracing and isolation is constructed here with the following assumptions:
- 1) From a given time, there is no additional imported case. In other words, the model is restricted for a single (big) cluster with no interaction with another cluster.
- 2) The contact rate is monotonically decreasing. The completion time \(\tau\) of intervention is defined as the first time when there is no more new contact producing new exposed. At this time, the contact tracing and isolation are fully completed.
In the following simulation, we construct linear infection rate
\[a(t) = \begin{cases} a_0(1 - \frac{t}{\tau}) & 0 \le t < \tau \\ 0 & t \ge \tau, \end{cases}\] (9)
where \(\tau\) is the completion time of contact tracing. In the following we simulate the contact tracing model for different values of \(\tau\) for Wuhan case, with E(0) = 50, I(0) = 10, and R(0) = 0. As shown in Figure 2 (d), with the choice of linear intervention model, the completion time of contact tracing for Wuhan case is approximately 50 days.
5. ESTIMATION OF THE LENGTH OF INTERVENTION
Indication of a slowing down of the transmission can be easily seen from the S-curve profile of the cumulative graph in Figure 3a. The behavior of the S-curve profile will be analyzed in the following general derivation of completion time. Assuming that during a relatively short period time, the number of newborns, as well as the deaths, are relatively very small, and we can neglect them for simplification. Rewrite the Equation (1) in a simple form
\[\frac{dS}{dt} = -a(t)\frac{SI}{N} \frac{dE}{dt} = a(t)\frac{SI}{N} - \alpha E \frac{dI}{dt} = \alpha E - \gamma I \frac{dR}{dt} = \gamma I,\] (10)
where
\[a(t) = \begin{cases} A(t) & 0 \le t < \tau \\ 0 & t \ge \tau. \end{cases}\] (11)
and A(t) is decreasing with \(A(\tau) = 0\). In this model, A(0) is the infection rate if there is no intervention. As the contact tracing and isolation are progressing, the infection rate A(t) is decreasing. It is the interest here, for a given cumulative data, how to estimate the end of the completion time \(\tau\).
Let K(t) is the cumulative cases at time t, then we can approximate K(t) as
\[K(t) = I(t) + R(t). \tag{12}\]
By differentiating (12) and with the use of (10) we have the following equation
\[\frac{1}{\alpha} \frac{d^2 K(t)}{dt^2} + \frac{dK(t)}{dt} = a(t) \frac{S(t)I(t)}{N}.\] (13)
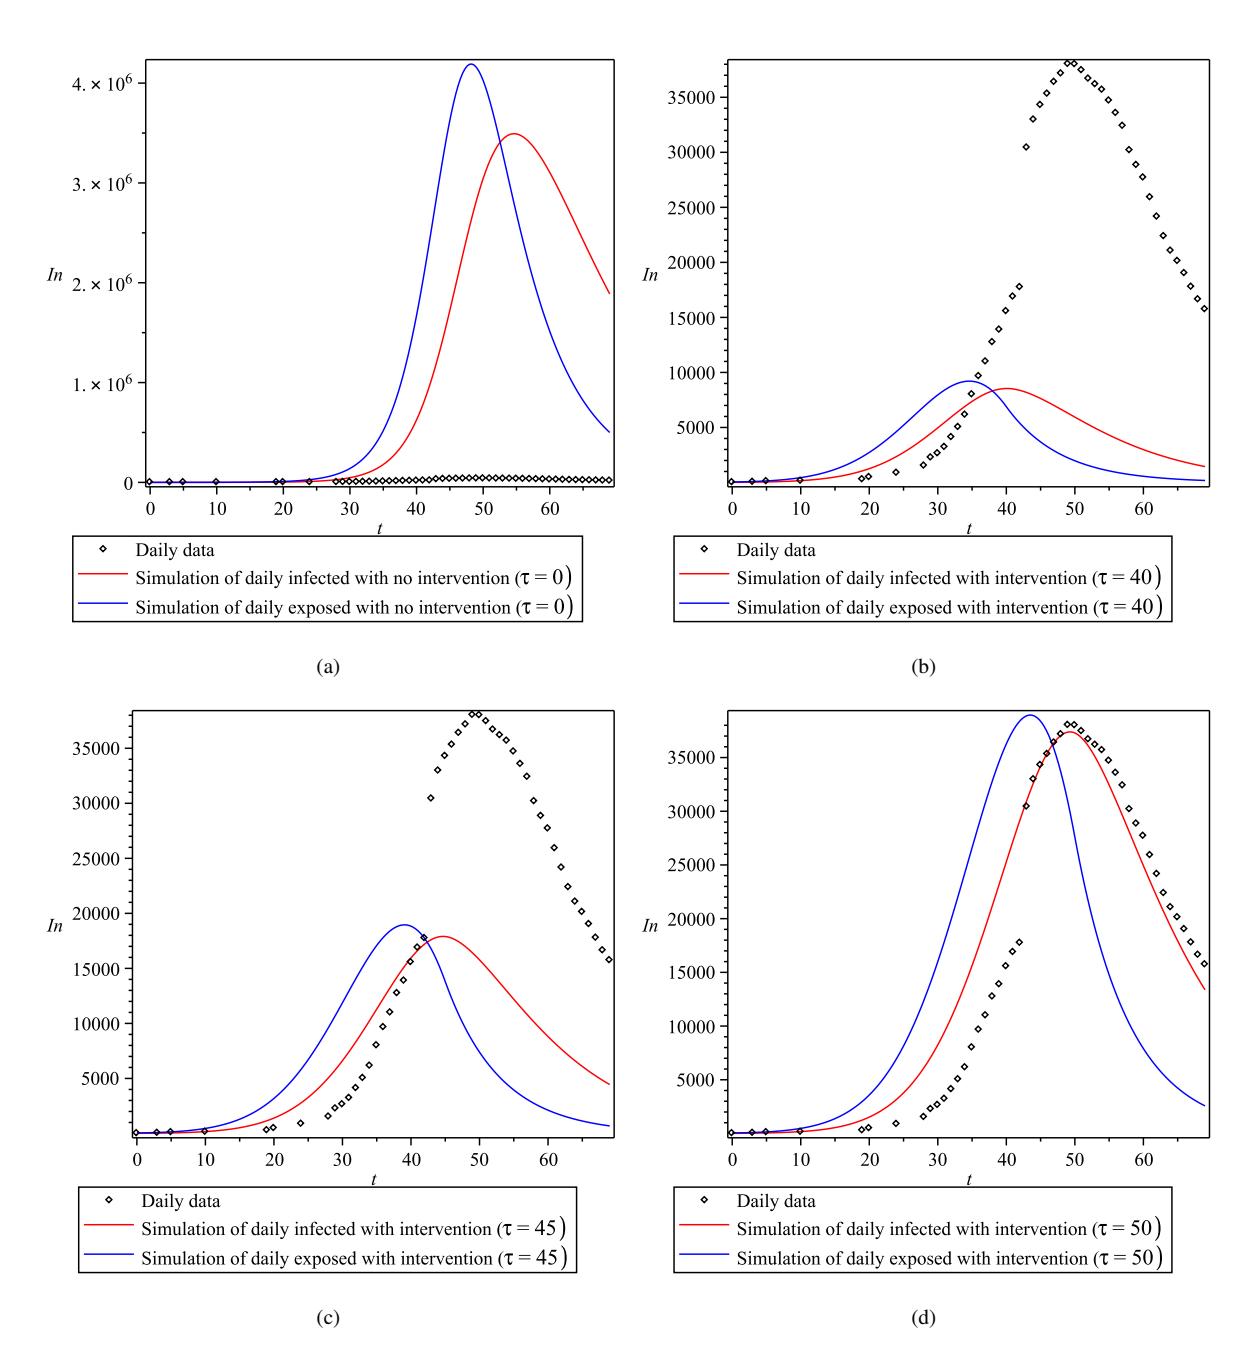
Figure 2: Simulations of I(t) and E(t) for Wuhan case; (a) with no intervention, (b)with intervention completed within 40 days, (c) with intervention completed within 45 days, (d) with intervention completed within 50 days
The time t = τ is achieved when contact tracing and isolation are completed, i.e. there is no more new infection from the contact with infected persons. After t = τ , only additional infection coming from transition of exposed into infected compartment. Define an operator F on the cumulative function K as
\[F(K(t)) = \frac{1}{\alpha} \frac{d^2 K(t)}{dt^2} + \frac{dK(t)}{dt},\] (14)
then at the time t = τ where a(τ ) = 0, then we have F(K(τ )) = 0. Here F(K(t)) represents the number of daily new cases a(t) S(t)I(t) N . The graphs of the exponential fit of cumulative data and the graph of F(K(t)) are shown in Figure 3. In this approximation τ = 55.
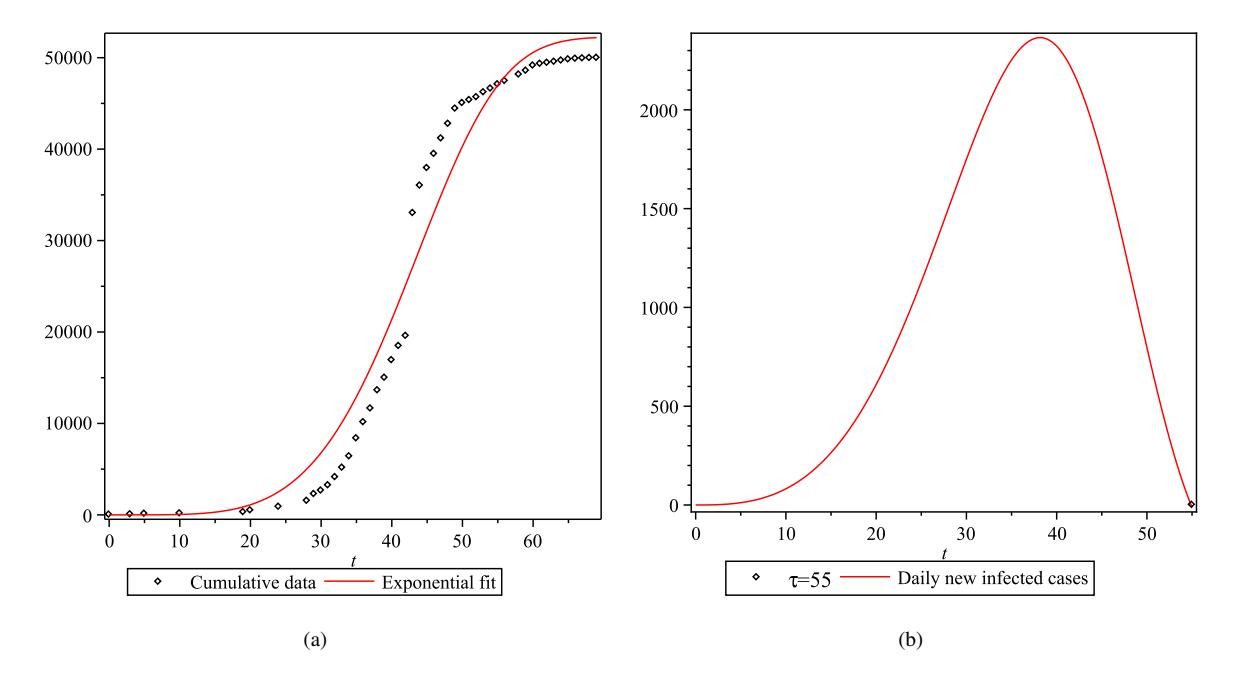
Figure 3: (a) Plot Exponential fit and cumulative data, (b) Plot F(K(t))
The differential operator (14) is useful for giving a quick evaluation of implementation of an intervention of Covid-19 transmission.
6. CONCLUSION
An SIR model for Covid-19 transmission is used here to analyze three clusters of transmission with the same type transmission in which the transmission started with some initial infected person(s) and no imported cases later on during the observation. The origin transmission in Wuhan spread within a large population of approximately ten million is shown to have the basic reproductive ratio R0 = 3.4444 with infection rate a = 1.1873. The case in Diamond Princess ship has a larger basic reproductive ratio R0 = 5.9076, although the population size is only 3,711. With the relatively smaller size of the ship area, the intensity of the contact is much larger, with the infection rate a = 3.4924. On a smaller scale, the case of Jakarta-cluster is a good representative of an isolated case when only one imported case entered the community, and the transmission was relatively contained within a small cluster before other imported cases came later on within the city. The basic reproductive ratio for the Jakarta-cluster is 2.5148 with the transmission rate a = 0.6329. These results could give early information for the Covid-19 Task Force in preparing resources and strategy when an imported case is entering an area.
As we have seen in the daily Covid-19 recent report throughout the world, prevention and contact-tracing of the cases are complicated. The contact tracing process in a large scale area requires huge effort involving a large number of health officers. A model with linear growth of tracing and isolation is implemented in Wuhan case, and resulting 51 days of completing the tracing until there is no new case of infection from the contact with future infected people.
A general model for identifying the completion of tracing and isolation is constructed from the cumulative case function K(t). A differential operator F(K(t)), which represents the number of daily new infected cases, is constructed in Equation (14) to obtain the completion time τ , in which F(K(τ )) = 0. It is shown, with this model, τ = 55.
ACKNOWLEDGEMENT
Part of this work is funded by The Indonesian WUR-Kemenristekbrin 2020 research grant.