

1. INTRODUCTION
Measles (Rubeola) is a highly contagious virus that can lead to complications. It is caused by paramyxovirus of genus Morbillivirus. The transmission of the virus normally person-to-person through airborne respiratory droplets or direct contact. The incubation period is in average 14 days in which infected individuals might have high fever, followed by cough, runny nose, and finally rash all over the body. Most reported complications from the disease are diarrhea (8%), otitis media (7%), pneumonia (6%), enchepalitis (0.1%), seizures (0.6 - 0.7%) and death (0.2%). (See [3], [16], [18]).
Measles is one of vaccine-preventable diseases that first became a health concern worldwide in the ninth century. After firstly introduced in 1963, Measles-Content Vaccine (MCV) (and later multi valent or combined Measles, Mumps, Rubella (MR/MMR) vaccine) successfully eliminated measles from the United States in 2000 [2]. This encouraged other regions worldwide to implement MR or MMR vaccine to eliminate the transmission of the virus. It was reported that in the period 2000 – 2015, annual measles incidence declined by 75% and annual estimated measles deaths declined by 79% worldwide. [17].
Measles vaccines are use starting as early as 6 months of age. In countries with high incidence and mortality from measles in the first year of life, it is recommended that vaccination is initiated at tha age of 9 months or shortly thereafter. In countries where infection occurs later in life, vaccination can be postponed until 12-15 months of age. For basic immunization, 2-dose strategy is recommended in order to anticipate children who did not develop protective immunity after the first dose [18].
Complications caused by measles virus very often require hospitalization. Therefore, together with vaccination implementation program, hospitalizing the infective (infected and infectious) individuals is a complementary treatment that can increase the effectiveness of controlling the spread of measles virus. Hospitalization
*Corresponding author
also can overcomes the complications as a result of low vaccine coverage rate and low vaccine efficacy. (See Lee, et.al. [8]).
The importance of hospitalization of measles patients is reflected by quite a number of studies on that matter. Lee et. al. [8] studied about hospitalizations of measles patient in the United States by describing the data from the National Notifiable Diseases Surveilance System by using independent data sets in order to provide a more accurate estimate about the total measles hospitalizations. This information is important for validating the data about measles in the country. Meanwhile, Wong et. al. [19] studied both clinical and laboratory aspects of hospitalized adult patients with complications due to measles virus. The results of the study can be used to described the epidemiology, morbidity, and mortality of the patients. Stahl et.al. [12] reported their study on adult hospitalized patients with complications for measles in France. Clinical treatments and laboratory test were carried out to obtain information about the kind and causes of the complications suffered by the patients. One of the findings of the study was that low vaccine coverage before the outbreak in the period of 2008 – 2011 is the main cause of the outbreak. Similar study were done by Fragkou et. al. [7] in Greece. The results were reported that demographic profile of measles hospitalized patients and their clinical characteristics were obtained and the outcome said that almost 50% complications were pneumonitis and all patients but one were discharged alive after 6 days hospitalized. Similarly, Rehman, Siddiqui, and Idris [11] studied clinical outcome of hospitalized patients with complication for measles in Pakistan. The study focused on six month to 12 years old children who suffered complications from measles. The results informed the demographic profile of measles patients and the outcome said that almost 95% patients with complications were recovered. Those studies depict a strong relation between the vaccination implementation program and hospitalization.
Modeling measles transmission has been done by numerous authors. Basically, the models were the modification or refinement from the standard SIR model of Kermack–McKendrick epidemic model [1]. In 2013, Momoh et. al. [9] studied the impact of exposed individuals in the transmission dynamics of measles virus. They made use of SEIR model to investigate the stability of the solutions of the model and supplied the analysis with numerical simulation. Meanwhile, in 2015, Verguet et. al. [15] studied the effectiveness of Supplemental Immunization Activities (SIAs) in some countries and states in the United States with high measles burden. They used of SIR and VS-VI-VR models and made use of statistical software to calculate. The results of the study offered country policymakers for deciding the optimal scheduling of SIAs and its combination with routine vaccination to control measles. Later in 2018, Peter et. al. [10] proposed an SVEIR model to study the impact of vaccination for controlling measles transmission in the population. Due to vaccination, recovery rate of infected individuals was divided into natural recovery and recovery due to vaccination. The results showed the effectiveness of vaccination can be drawn from studying the dynamic of infected and recovered population.
In this study, we proposed a measles transmission model involving vaccination implementation program and hospitalization. This study can provide further identification related to measles transmission such that it can improve the effectiveness of policy making. Furthermore, the model analysis regarding the equilibria and its stabilities are also carried out, followed by numerical simulation. For the simulation, unobservable parameters will be estimated based on the recorded data for validation purposes for our proposed model.
2. MODEL FORMULATION
The model was constructed based on SIR model with additional compartment for hospitalized individuals. This was a modification of the system studied by Fakhruddin et.al. (2020) [6]. If in [6] vaccination were implemented to susceptible sub-population in general, this study more focused on the implementation of 1-dose vaccination to children (it can be assumed under 5 years old), combined with hospitalization for infective individuals.
It was assumed that the population was fixed with the number of N|. The population was divided into four sub-populations, namely: Susceptibles (S), Infectives (I), Hospitalized (H), dan Recovered (R). Susceptibles increases due to birth rate of π. It is assumed that one dose vaccination strategy is implemented to susceptibles with the rate of ρ which is the multiplication of the efficacy of the vaccine r with 0 < r < 1 and the coverage of the vaccine p with 0 < p < 1. The infection rate when infective indiduals make a contact with susceptibles is β, Natural recovery rate of infective individuals is γ1 and recovery rate of hospitalized individuals is γ2. It is natural to assume that γ1 ≤ γ2. Infective individuals who are hospitalized is at the rate of δ. Each sub-population decreases due to natural death rate of µ.
The transmission of measles virus can be summarized by the following system of equations.
\[\frac{dS}{dt} = (1 - \rho)\pi - \beta \frac{SI}{N} - \mu S\] \[\frac{dI}{dt} = \beta \frac{SI}{N} - (\delta + \gamma_1 + \mu)I\] \[\frac{dH}{dt} = \delta I - (\gamma_2 + \mu)H\] \[\frac{dR}{dt} = \rho \pi + \gamma_1 I + \gamma_2 H - \mu R.\] (1)
Since the population is constant, \(\pi = \mu N\). Using the following re-scalings
\[\bar{S} = \frac{S}{N}, \ \bar{I} = \frac{I}{N}, \bar{H} = \frac{H}{N}, \bar{R} = \frac{R}{N}\] and after dropping the bars, we obtained the following system.
\[\frac{dS}{dt} = (1 - \rho)\mu - \beta SI - \mu S\] \[\frac{dI}{dt} = \beta SI - (\delta + \gamma_1 + \mu)I\] \[\frac{dH}{dt} = \delta I - (\gamma_2 + \mu)H\] \[\frac{dR}{dt} = \rho \mu + \gamma_1 I + \gamma_2 H - \mu R.\] (2)
The analysis of system (2) was focused on the dynamics of susceptibles, infectives, and hospitalized sub-populations because recovered sub-population does not contributed to the other sub-populations and therefore it was not considered in the analysis. The analysis was started with finding the equilibria of the reduced system and then followed by determining the threshold number with which the stability of the equlibria can be determined. To illustrate the results, numerical simulations were undertaken to support the interpretation of the solution of the system.
3. EQUILIBRIA AND THEIR STABILITIES
The reduced system to be analized was as follows.
\[\frac{dS}{dt} = (1 - \rho)\mu - \beta SI - \mu S\] \[\frac{dI}{dt} = \beta SI - (\delta + \gamma_1 + \mu)I\] \[\frac{dH}{dt} = \delta I - (\gamma_2 + \mu)H\] (3)
whereas R being neglected can be determined from R=1-S-I-H or from \(\frac{dR}{dt}=\rho\mu+\gamma_1I+\gamma_2H-\mu R\). The feasible region of system (3) is
\[\Delta := \{ (S, I, H) \in \mathbb{R}^3 | 0 \le S + I + H \le 1 \},\\]
since for given any non-negative initial values in \(\Delta\), all solutions of (3) have non-negative components and stay in \(\Delta\) for all \(t \ge 0\).
The disease-free equilibrium of system (3) is obtained if I = H = 0 to have
\[DFE = (S^0, I^0, H^0) = (1 - \rho, 0, 0). \tag{4}\]
Meanwhile, the endemic equilibrium of the system is given by
\[EE = (S^*, I^*, H^*),\] (5)
where
\[S^* = \frac{\mu \delta(R_0 - 1)}{\beta(\gamma_2 + \mu)}\] \[I^* = \frac{\mu(R_0 - 1)}{\beta}\] \[H^* = \frac{1 - \rho}{R_0}\] with
\[R_0 = \frac{\beta(1-\rho)}{\delta + \gamma_1 + \mu},\tag{6}\] where R0 is the Basic Reproduction Ratio, an epidemiological threshold when the expected second cases produced. (See Diekmann, Heesterbeek, and Metz [4] or van den Driessche and Watmough [5] for references).
The (local) stability of the equilibria of system (3) can be analyzed by, first, Linearization to system (3) to obtain the Jacobian matrix
\[J = \begin{pmatrix} -\beta I - \mu & -\beta S & 0\\ \beta I & \beta S - \delta - \mu - \gamma_1 & 0\\ 0 & \delta & -\mu - \gamma_2 \end{pmatrix}. \tag{7}\]
Substituting DF E = (1 − ρ, 0, 0) to (7) to obtain the corresponding characteristic equation
\[(\lambda + (\mu + \gamma_2))(\lambda + \mu)(\lambda - \beta(1 - \rho) + (\delta + \mu + \gamma_1)) = 0, \tag{8}\] from which the roots are: −µ, β(1 − ρ) − δ − µ − γ1, and − µ − γ2. As all parameter values are positive, it can be concluded that the roots are all negative if
\[\beta(1-\rho) - \delta - \mu - \gamma_1 < 0\] or
\[R_0 = \frac{\beta(1-\rho)}{\delta + \gamma_1 + \mu} < 1. \tag{9}\]
Therefore, DF E is locally asymptocally stable in ∆ if (9) is satisfied.
Now, Substituting (5) into (7), the corresponding characteristic equation is given by
\[\lambda^3 + a_1 \lambda^2 + a_2 \lambda + a_3 = 0 \tag{10}\]
where
\[a_{1} = (1 + R_{0})\mu + \gamma_{2},\] \[a_{2} = \frac{\mu R_{0}^{2}(\mu + \gamma_{2}) + \mu(R_{0} - 1)\beta(1 - \rho)}{R_{0}},\] \[a_{3} = \frac{(\gamma_{2} + \mu)\mu(R_{0} - 1)\beta(1 - \rho)}{R_{0}}.\]
Because all parameters are positive and 0 < ρ < 1 then a1, a2, a3, and a1 · a2 − a3 will be all positive if R0 > 1. Therefore, Routh-Hurwitz criterion implies that the characteristic equation (10) has roots with negative real parts, and hence EE is locally asymptotically stable in ∆.
The stability conditions of the equilibria which are determined by the value of basic reproduction ratio (R0) are similar with those of [6].
4. NUMERICAL SIMULATION: CASE STUDY OF JAKARTA, INDONESIA
Some numerical simulations were performed to see how close the analysis results to the real situation. In this study, the same data of Jakarta, Indonesia as used by Fakhruddin et.al. [6] was utilized in the simulation. The data was the observation data of hospitalized individuals in 2017 in weekly basis.
The data was used to validate the model under study by estimating the values of unobservable parameters. One common method used is the method of Nonlinear Least Squares. The estimate values obtained cannot be guaranteed its globality. Therefore, it will be leave for further study. From the numerical calculation using the method, it is obtained some important value of parameters of the system, namely: infection rate \((\beta)\), the rate of infective individuals to be hospitalized \((\delta)\), and the coverage of the vaccination implementation (p). Also from the calculation, the initial point S(0) and I(0) can be determined, from which the initial point H(0)and R(0) can also be derived by using the assumption that the population is constant. This is quite different with those done by Fakhruddin et. al. [6] where they estimated 2 parameters and 2 initial conditions, namely \(\beta, \delta, I(0), H(0)\), and assuming that R(0) = p = 0. The other parameters of the system that could not be determined from the calculation will be assumed or taken from related references. In the study of Fakhruddin et. al., vaccination is applied to the susceptible compartment in general, here we apply it to the birth rate by looking at the tendency that vaccination is carried out in stages starting with children under five. Therefore, vaccination parameters have no effect on the term of force of infection. Fig. 1 decribes the results of the numerical calculation that simulates parameter estimation as a comparison. These results show visually that the dynamic of this model is more adaptable in capturing data, were in the initial phase it decreased, then went to the peak of the outbreak, and decreased at the end of the period.
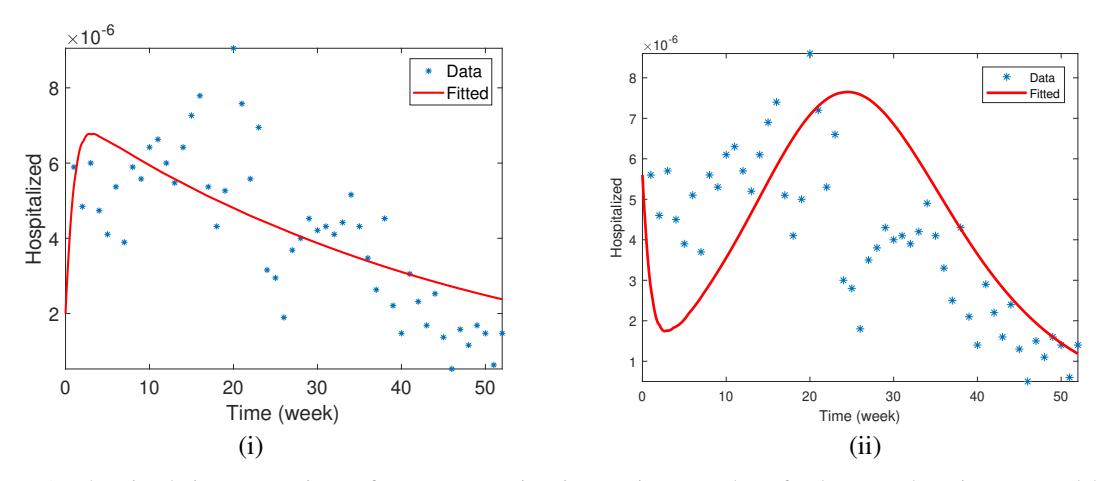
Figure 1: The simulation comparison of parameter estimation against measles of Jakarta, Indonesia generated by (i) Fakhruddin et. al. [6] and (ii) our proposed model.
Parameter values in Table 1 gives \(R_0 = 1.325661714 > 1\). This means that the asymptotically stable endemic equilibrium takes place, as illustrated in Fig. 2.
Fig. 2 (i) shows that after 52 weeks the susceptibles population tends to 0.466131 (or about 4.6 million of people), and Fig. 2 (ii) shows that although the number of infectives reaches almost 50.000 people in about 20 weeks time, it quickly decreases up to 6457 people after 52 weeks. It needs about 140 weeks to eradicate the virus from infectives population. Fig. 2 (iii) shows that it needs about 60 weeks to discharge all patients from hospital alive. So, the combination of vaccination implementation and hospitalizing the infectives during 1 year period is effectively suppressed the virus transmission and these contribute about 5.27 million recovered individuals by the end of the year.
To see the effectiveness of the combined strategy for controlling the transmission the virus, it is make sense to increase the proportion of infectives to be hospitalized (\(\delta\)). By taking \(\delta=0.165\) and keep other parameter values as in Table 1, it gives \(R_0=0.887<1\), the disease-free equilibrium (DFE) takes place. As has been analyzed previously, (DFE) is asymtotically stable in the domain. This is illutrated in Fig. 3.
Table 1: Parameter Values and Initial Values.
| Description | Parameter | Values | Source |
|---|---|---|---|
| (week−1 ) | |||
| Number of population | N | 10000000 | [13] |
| Natural death rate | µ | 0.00027 | 1 (52)(70) |
| Contact/infection rate | β | 0.4984 | estimated |
| Vaccine efficacy | r | 0.9 | assumed |
| Vaccination coverage | p | 0.1248 | estimated |
| proportion of infectives to be hospitalized | δ | 0.000165 | estimated |
| Natural recovery rate | γ1 | 0.3333 | assumed |
| Recovery rate due to hospitalized | γ2 | 1 | assumed |
| Initial number of susceptibles (S(0)) | 0.9242 | estimated | |
| Initial number of infectives (I(0)) | 0.00759 | estimated | |
| Initial number of hospitalized individuals (H(0)) | 0.0000056 | estimated |
Note: ρ = r · p, N is rounded off for simplicity
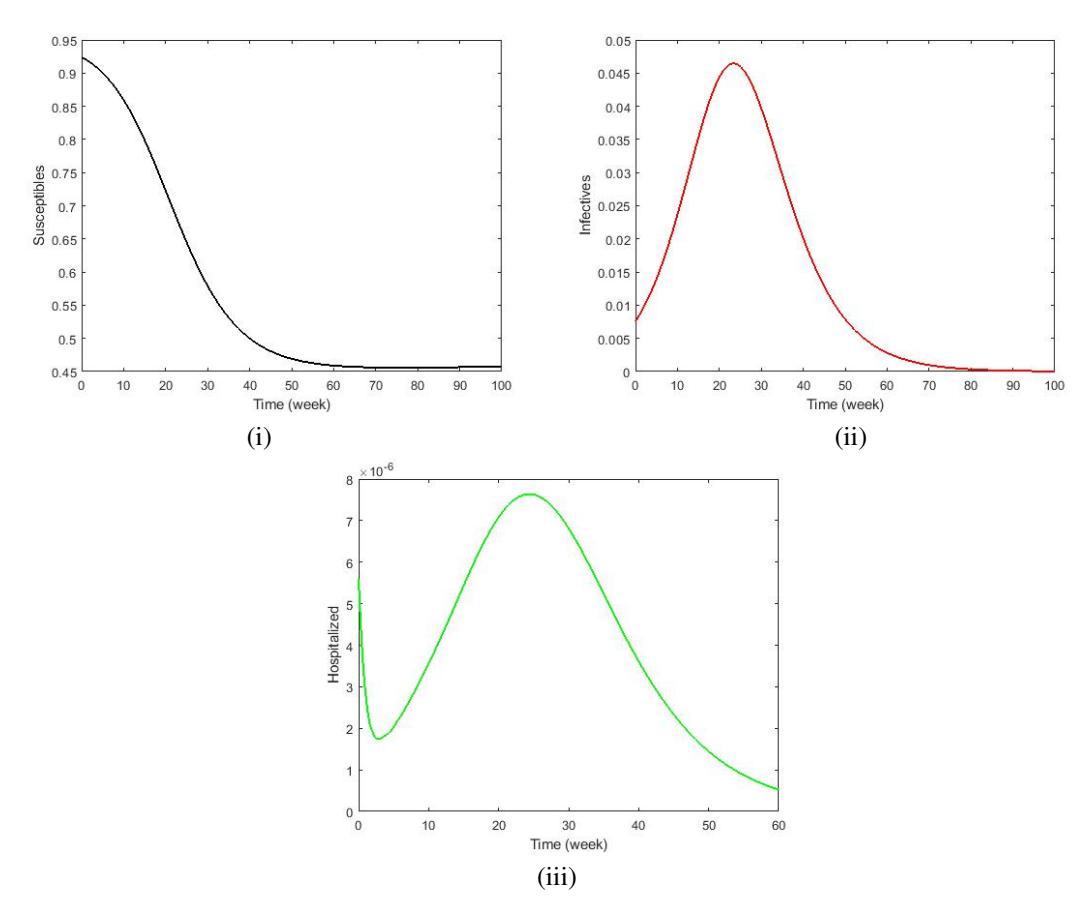
Figure 2: The dinamic of each sub-population (i) Susceptibles, (ii) Infectives, and (iii) Hospitalized, for β = 0.4984, µ = 0.00027, p = 0.1248, r = 0.9, γ1 = 0.3333, γ2 = 1, δ = 0.000165.
In the period of 52 weeks (1 year) the role of vaccination implementation and hospitalizing the infectives is quite effective in diminishing the transmission of the virus. By the end of the year more than 85% of population are susceptibles with leftover infectives and hospitalized of about 336 individuals and about 60 individuals, respectively. These will be fully eradicated for a longer time. Meanwhile, about 13% of population are recovered.
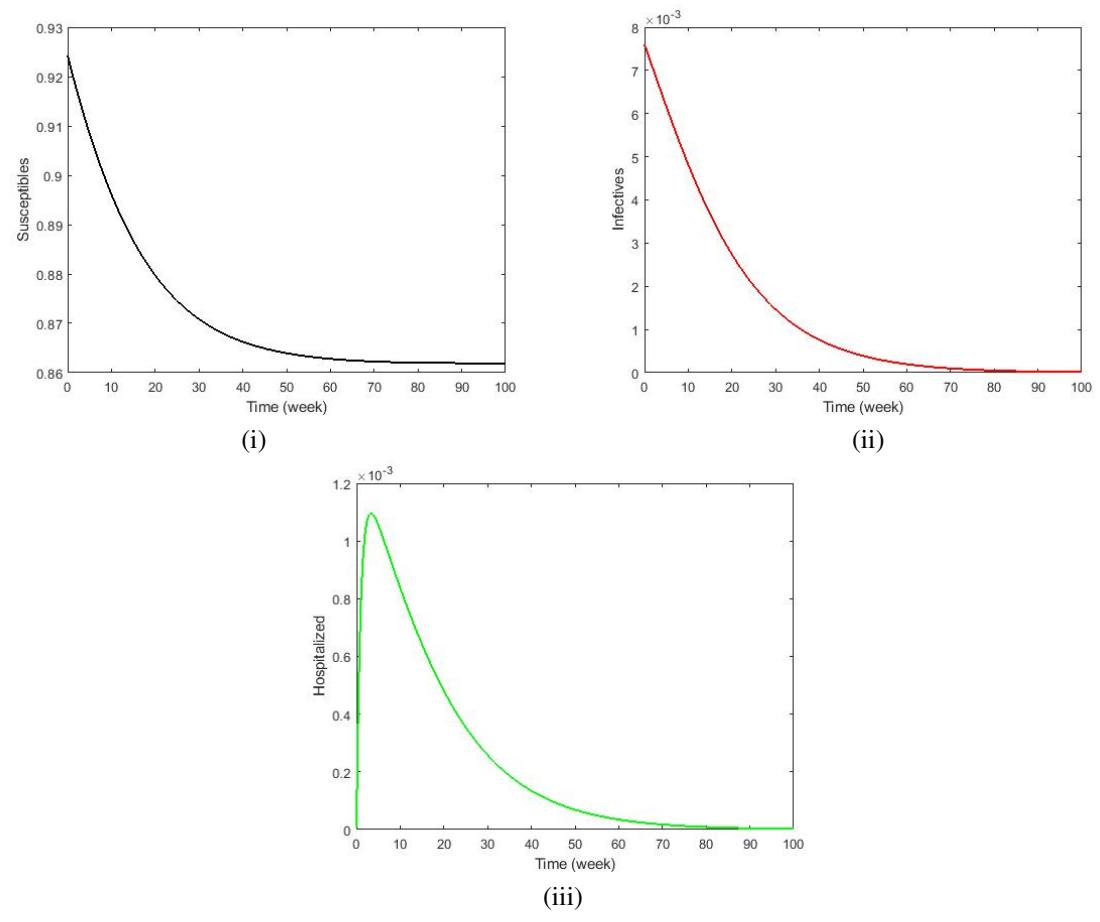
Figure 3: The dinamic of each sub-population of disease-free equilibrium (DF E) for β = 0.4984, µ = 0.00027, p = 0.1248, r = 0.9, γ1 = 0.3333, γ2 = 1, δ = 0.165.
5. CONCLUSION
The results of this study showed that the basic reproduction ratio obtained also played a central role in the analysis, especially for concluding the stability of disease-free equilibrium and endemic equilibrium compared to the work of Fakhruddin et. al. [6]. Applying the real data of Jakarta, Indonesia, the numerical simulations showed that the analytical results fit with the numerical ones, including the stabilities of the equlibria. Also, as already presented in the analysis that hospitalization can be a good strategy to combine it with the existing 1-dose vaccination program in order to decrease the transmission of measles in Jakarta. This can be put into consideration by the policy makers of Jakarta to reformulate the program for preventing measles.
Further study may be done for global approach for determining parameter values of the system. In addition, It is interesting and reasonable to modify the model by implementing 2-dose vaccination strategy, which is in line with WHO recommendation [17].
ACKNOWLEDGEMENTS
The authors would like to thank Dinas Kesehatan (Public Health Office) of Jakarta Province, Indonesia, for the data of measles incidence. The authors would also like to thank the reviewers for valuable comments on model modification and presentation of the paper.