

1. Introduction
Mathematical models are logical descriptions of real-life phenomena using mathematical techniques and language. The process of developing a mathematical model is referred to as mathematical modeling [1]. Most of these models formulated are prototypes of real-life occurrences arising from science and engineering, physical system, psychology, medicine, economics and virtually all aspect of human life. These models also answer questions that emanate from changes in the behavior of the infectious organism to proffer solutions to the infections. The models use basic assumptions and mathematical approaches to determine the parameters that drive the infections and use them to proffer solutions for treatments and preventions including vaccine production [2].
Over the years, mathematical models have been tested and proven to be one of the efficient and reliable tools used in proffering control and mitigation measures to epidemics and pandemics of infectious diseases. In modeling infectious diseases, mathematical models provide practical and factual guides useful in making decisions on health policies that mitigate the virulence of infectious organisms. It can also advise health-decisions such as cost-effectiveness and optimal control of containment and intervention measures [2], [3].
The coronavirus disease 2019, simply referred to as COVID-19, is a viral disease that was first reported in Wuhan China in 2019 [4]. It is caused by Severe Acute Respiratory Syndrome coronavirus 2 (SARS-CoV-2). It has a high rate of infectivity but low mortality rate when compared with the outbreaks of the Middle East Respiratory Syndrome (MERS) 2012 and Severe Acute Respiratory Syndrome (SARS) 2003 [5], [6]. It is known to spread through exposure to the droplets from infected persons during coughing and sneezing. As
*Corresponding author for now, Covid-19 has neither known vaccine nor specific treatments [7]. The World Health Organization (WHO) declared COVID-19 a global pandemic in March 2020 [4].
The COVID-19 pandemic has disrupted activities all over the world and forced many countries to reset their economic priorities [3], [8]. Different control policies recommended by the WHO such as lockdown, quarantine, isolation, observing social distancing and restriction of the movement were implemented by the governments of many countries to halt the spread of COVID-19 [4], [9], [10]. Sadly, these control policies have caused economic down-turn, mortalities and morbidities, inflation, high rate of crime, lawlessness, and hunger in many countries [10], [11]. For instance, the closure of international borders, local and international flights, restaurants, and markets during lockdowns impacted negatively on the world economy. Nigeria has slipped into another economic recession. The WHO and researchers have stated that COVID-19 will remain in the world until there is a vaccine [12], [13].
Though, the disease emanated from China, it spread rapidly to Europe, America, Asia, Australia and Africa within two months. As of May 13, 2020, every African country has recorded an infection, Lesotho being the last [14]. As at June 7, 2020, Africa had a total of 492,805 confirmed cases; 244,104 active cases; 227,204 recovered persons and 11,659 mortality due to COVID-19. South Africa is the most affected country, with Egypt and Nigeria coming second and third respectively [9], [14].
Nigeria recorded her first case on February 27, 2020, from an Italian immigrant. Within four months, the country recorded as at July 7, 2020 about 29,286 confirmed cases; 16,804 active cases, 11,828 discharges and 654 deaths [9]. The government of Nigeria implemented various control policies as advocated by the WHO to halt the spread of COVID-19, yet the country is still reporting outrageous new cases daily [9]. These daily new cases have been attributed to either incompatibility of the control measures with Nigerian socioeconomic environment or error on the part of stakeholders [10], [11]. For instance, the enforcement of total or partial lockdown and shutdown of humans and the economies in the entire country especially Lagos state (the most populated and industrial state in the country), Abuja, the Federal Capital Territory (the seat of administrative power of the country), Kano state (the commercial centre of Northern Nigeria) and Ogun state (another industrial state in south-western Nigeria) except for essential workers (like Food vendors, the media, healthcare workers, law enforcement agencies, etc) caused a drastic decline in the gross domestic product of the country. Other consequences include; strangulation of small and medium enterprises, increase in crime due to hardship, inflation due to scare resources available and poverty in the country. The attitude of the citizens towards the disease is frustrating the fight of COVID-19 in the country: many people still believe the disease does not kill Africans while some believe that 'COVID-19 is just a scam to enrich some cabal' [11]. Many are still organizing/attending public gatherings and some are still not adhering to basic safety precautions of wearing of face-mask and washing of hands with running water or use of hand sanitizers [8], [10], [11].
Few researchers have attempted to mathematically model the Nigerian scenario in a bid to control and mitigate COVID-19 in the country. The work of Madubueze et al. [3] is one of the mathematical models of COVID-19 that considered the optimal control analysis of some control measures advocated by WHO. Their result revealed that the combined implementation of quarantine, isolation and public health education will greatly mitigate the virus if timely implemented. However, the study did not incorporate testing for COVID-19. Iboi et al. [8] presented a mathematical model and analysis of COVID-19 to assess the impact of face-mask in the COVID-19 transmission in Nigeria. Their model also revealed that COVID-19 will be eliminated in Nigeria if the wearing of face-mask in public is implemented in Nigeria with a social distancing strategy. Although, all the available data on COVID-19 in Nigeria was utilized, the study did not incorporate testing for COVID-19 in their model. Okuonghae and Omane [10] formulated a mathematical model of COVID-19 to assess the impact of non-pharmacological control measures such as social distancing, use of face-mask and case detection (contact tracing and subsequent testing). Their findings revealed that with intensified disease case detection rate and at least 55% of the population adhering to the observance of social distancing and the use of face-mask in public, the disease will eventually die out. However, their model analysis utilized the data on COVID-19 cases in Lagos State alone. Whereas, Ibrahim and Ekundayo [11] outlined the importance and the need for mathematical epidemiologists to correct the general misconstrued perception of COVID-19 in Nigeria. Their findings addressed the wrong perceptions and attitudes of most Nigerians towards the disease and emphasized the need for total adherence to the control measures recommended by the government. They also affirmed the needs for mathematical models as the most urgent and necessary tools needed to effectively control COVID-19 in Nigeria.
From the literature the authors were able to assess, none studied the impact of the non-pharmaceutical control measures (social distancing and wearing face-masks) and testing rates on COVID-19 using all the available data in Nigeria. The study done on Lagos state may not capture the true picture of the Nigerian scenario since COVID-19 has spread to all the states in Nigeria. Therefore, this study will assess the impact of non-pharmaceutical control measures (social distancing, use of face-masks) and testing rate on the spread of COVID-19 in Nigeria.
The rest of the paper is organized as follows: Section 2 is devoted to the formulation of the model and the model analysis is presented in Section 3. In Section 4, numerical simulations are carried out to display the effect of the testing rate and intervention measures on COVID-19 dynamics. Discussion is described in Section 5 while Section 6 is the conclusion.
2. MODEL FORMULATION
In this section, the formulation of a community-based transmission model for COVID-19 in Nigeria is presented. The total population, N(t), at time, t, is divided into sub-populations; Susceptible population, S(t), Exposed population, E(t), Infected population, I(t), Isolated Infected individuals through mass testing, IJ (t), Infected individuals that escaped mass testing, INT (t), Hospitalized infectious population, H(t), and Recovered individuals, R(t).
The human population at any given time, t, is given by
\[N(t) = S(t) + E(t) + I(t) + I_J(t) + I_{NT}(t) + H(t) + R(t).\] (1)
There is no immigration or emigration due to border closure; birth and natural death within the pandemic is negligible because the period of observation is relatively short. For the susceptible population, Some individuals exit the S(t) population and progress to exposed population, E(t), when they have contact with the individuals in the subpopulations, I(t), INT (t), IJ (t), and H(t), at the force of infection, λ. This leads to
\[\frac{dS}{dt} = -\lambda S,\] where
\[\lambda = \frac{(1 - \alpha)\beta(I + \eta_1 I_{NT} + \eta_2 I_J(t) + \eta_3 H)}{N},\] (2)
and α ∈ (0, 1) is the intervention measures which reduce the transmission between the susceptible individuals and infected individuals. These intervention measures include wearing of face mask and observing social distancing. The parameters, η1, η2, η3 are the modification parameters for the subpopulation, INT (t), IJ (t), and H(t) respectively with η1 > η2, η3. The parameters, η2, η3 refer to the hygiene consciousness of the infected populations who are aware of their status. Individuals in the subpopulations,IJ (t), and H(t) can transit infection to the health personnel who breach the infectious disease control protocol such as failure to wear personal protective equipments (PPEs) properly or adhere to the procedures for removal and disposal of the PPEs after usage.
The Exposed compartment gains population from the susceptible individuals at the force of infection rate, λ. Individuals move from the exposed population to the Infected population after the incubation period of the virus (usually 5 – 6 days) at a rate, τ . This is given by
\[\frac{dE}{dt} = \lambda S - \tau E.\]
Mandatory mass testing is introduced at the stage of the infected population as a diagnostic measure. This is to fish out infected individuals in the population especially the asymptomatic infected individuals that are not aware of their status. A proportion, p ∈ [0, 1] of the infected individuals know their status through mass testing at a rate, σ2, and are isolated while the proportion, (1 − p), of the Infected population escapes mass testing at a rate, σ1 and enter the INT (t). This yields
\[\frac{dI}{dt} = \tau E - (1 - p)\sigma_1 I - p\sigma_2 I.\]
The Infected individuals that escape mass testing (symptomatic infected) become hospitalized at the progression rate, k. Some of them may either die of the virus at a rate, λ1 or recover at a rate, γ1 without hospitalization.
\[\frac{dI_{NT}}{dt} = (1-p)\sigma_1 I - (k+\gamma_1 + \lambda_1)I_{NT}.\]
The Isolated Infected population, IJ (t), gains individuals from the proportion, p, of the Infected population, at a testing rate, σ2. They are isolated either at home or a facility for observation. The asymptomatic among them recover at a rate, γ2, while the symptomatic are hospitalized at a rate, θ, with the probability, p, of developing symptoms. This gives
\[\frac{dI_J}{dt} = p\sigma_2 I - (\rho\theta + \gamma_2)I_J.\]
The Hospitalized infectious population, H(t), gains individuals from the Infected population that miss mass testing at a rate, k, and the Isolated infected individuals that become symptomatic at a rate, θ, and p, the probability of developing symptoms. Some people in the hospitalized population recovers at the rate, γ3, while some die of the disease at the rate, λ2.
\[\frac{dH}{dt} = kI_{NT} + \rho\theta I_J - (\lambda_2 + \gamma_3)H.\]
The Recovered population, R(t), gains individuals from the infectious population that escapes mass testing, the isolated infected population and the hospitalized population at the rates, γ1, γ2 and γ3 respectively.
\[\frac{dR}{dt} = \gamma_1 I_{NT} + \gamma_2 I_J + \gamma_3 H.\]
The following are the assumptions of the model.
- i. The simplification of the model is taken by neglecting the natural death and the newborns (considering that the period of observation is relatively short).
- ii. The model assumes a constant population during the epidemic since borders have been closed (i.e. no immigration or emigration). Hence, the model is a community-based transmission model of COVID-19 in Nigeria.
- iii. It is assumed that recovered individuals developed permanent immunity to COVID-19 since it has not been proven that recovered individuals become susceptible again. It is based on literature [3, 8].
- iv. Infection is acquired via direct contact and inhalation or swallowing of infectious human fluid droplets.
- v. Rodent infection is not considered due to the reality that present infections that are bedeviling the country are secondary infection and do not originate in Nigeria.
- vi. For an individual to become infectious, he/she must pass through the latent stage.
The schematic diagram of the transmission dynamics of the COVID-19 model is shown in Figure 1 below.
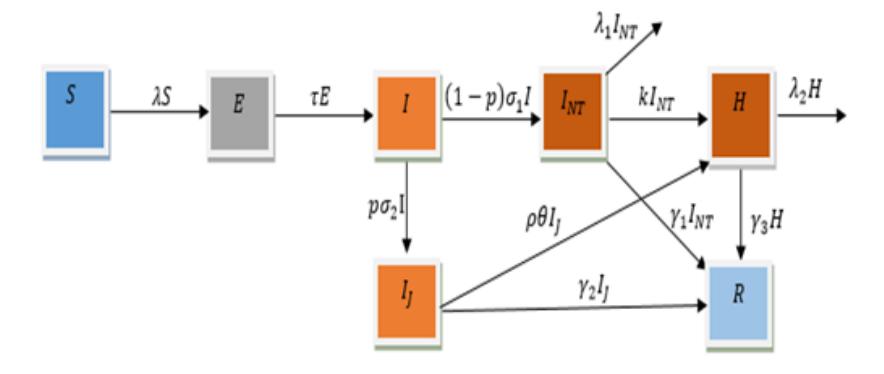
Figure 1: The systematic diagram of the COVID-19 model.
With the assumptions of the model and the schematic diagram, the model equation is derived as
\[\frac{dS}{dt} = -\lambda S\] \[\frac{dE}{dt} = \lambda S - \tau E\] \[\frac{dI}{dt} = \tau E - (1 - p)\sigma_1 I - p\sigma_2 I\] \[\frac{dI_{NT}}{dt} = (1 - p)\sigma_1 I - (k + \gamma_1 + \lambda_1) I_{NT}\] \[\frac{dI_J}{dt} = p\sigma_2 I - (\rho\theta + \gamma_2) I_J\] \[\frac{dH}{dt} = kI_{NT} + \rho\theta I_J - (\lambda_2 + \gamma_3) H\] \[\frac{dR}{dt} = \gamma_1 I_{NT} + \gamma_2 I_J + \gamma_3 H\] (3)
with S(0) > 0, \(E(0) \ge 0\), \(I(0) \ge 0\), \(I_{NT}(0) \ge 0\), \(I_{J}(0) \ge 0\), \(I_{J}(0) \ge 0\) and \(I_{J}(0) \ge 0\) as the initial conditions.
Table 1: Description of Parameters of the Model
| Variables | Description |
|---|---|
| \(\sigma_1\) | The rate which the Infected population miss mass testing, |
| \(\sigma_2\) | The testing rate for the infected population, |
| \(\beta\) | Transmission rate, |
| k | The Hospitalization rate for infected population not-tested, |
| \(\theta\) | The Hospitalization rate for isolated infected population, |
| p | The proportion of infected individuals that participant in mass testing, |
| \(\rho\) | Probability of isolated infected population to develop symptoms, |
| \(\gamma_1\) | The recovery rate for infected population that escaped testing, |
| \(\gamma_2\) | The recovery rate for isolated infected population, |
| \(\gamma_3\) | The recovery rate for hospitalized population, |
| \(\lambda_1\) | Disease induced death rate for infectious population that escape testing, |
| \(\lambda_2\) | Disease induced death rate for Hospitalized population, |
| \(\alpha\) | Intervention measures parameter, |
| \(\tau\) | The incubation period rate, |
| \(\eta_1\) | Modification parameter for Infected population that escapes mass testing, |
| \(\eta_2\) | Modification parameter for Isolated Infected population, |
| \(\eta_3\) | Modification parameter for Hospitalized infectious population. |
3. MODEL ANALYSIS
3.1. Boundedness of Solutions
With positive initial data, the boundedness of the solutions of system (3) is discussed in this section to prove that all the solutions of the system (3), \((S(t), E(t), I(t), I_J(t), I_{NT}(t), H(t), R(t))\), will remain nonnegative for all time and bounded in a region, D.
We first prove that the solutions of the system (3) are nonnegative for all \(t \ge 0\).
Theorem 1. All the solutions of the system, \((S(t), E(t), I(t), I_J(t), I_{NT}(t), H(t), R(t))\) with initial conditions are positively bounded for all \(t \ge 0\).
Proof: From first equation of system (3), we have
\[\frac{dS}{dt} = -\lambda S.\]
With the method of integrating factor and initial condition, S(0), we have
\[S(t) = S(0) \int_0^t \exp(-\lambda u) \, du > 0 \quad \forall \quad t \ge 0.\]
Hence, S(t) is always nonnegative for t > 0.
In a similar way for all \(t \ge 0\), the other state variables, S(t), E(t), I(t), \(I_J(t)\), \(I_{NT}(t)\), H(t) and R(t) are all nonnegative. Therefore, all the solutions of system (3) are all nonnegative for all \(t \ge 0\).
Theorem 2. The solutions of system (3), \((S(t), E(t), I(t), I_J(t), I_{NT}(t), H(t), R(t))\), will enter the positive invariant region, D, that is uniformly bounded.
Proof: From the total population at time t, N(t), in Eq. (1), we have
\[\frac{dN}{dt} = -\lambda_1 I_{NT} - \lambda_2 H.\]
With the fact that \(I_{NT}(t)\), \(H(t) \leq N(t)\) and choosing \(\lambda = \min(\lambda_1, \lambda_2)\), it gives
\[\frac{dN}{dt} \leq -\lambda N,\] which simplifies to give
\[N \le N_0 e^{-\lambda t}\].
So, as \(t \to \infty\), the total population, N(t) approaches \(N \le N_0\). Thus, we conclude that N(t) is bounded above and all the solutions of the system (3) are also bounded.
Therefore, it is necessary to carry out other analysis within this region, D.
3.2. Basic Reproduction Number
The basic reproduction number, \(R_0\), in an epidemiological study shows how transmissible or infectious an infection is. It is the average number of new infections an infected person can infect in an infective period. From the value of the reproduction number, we can predict if an infection will spread in exponential progression, die off after some time or remain constant without any further spread. When \(R_0 < 1\), the infection will die off as each infected will infect less than one person in the infective period. When \(R_0 = 1\), the infection becomes endemic and stays with each infected person infecting one new person. When \(R_0 > 1\), an infection spreads and the number of infected people will grow in an exponential proportion which will eventually lead to a pandemic as is seen in Nigeria and most of the world now for COVID-19 cases.
The basic reproduction number is computed at the disease-free equilibrium state using the next-generation approach by Van den Driessche and Watmough [15]. It is defined as the maximum eigenvalue of the matrix, \(FV^{-1}\), where matrices, F and V are the Jacobian matrices for new infections and the movement in or out of the infected populations by other means respectively. This is evaluated at disease-free condition, \(E_0 = (S(0), 0, 0, 0, 0, 0, 0, 0, 0)\) and the infected populations are \(E, I, I_{NT}, I_J, H\). These matrices are given as
\[\text{[rumus tidak dapat ditampilkan dengan baik — lihat PDF asli]}\] where
\[\beta^* = (1 - \alpha_1)\beta,\] and
\[f = (1 - p)\sigma_1 + p\sigma_2, g = k + \gamma_1 + \lambda_1, h = \rho\theta + \gamma_2 \quad \text{and} \quad q = \lambda_2 + \gamma_3\] \[\tag{4}\]
The basic reproduction number, \(R_0\), is given as
\[R_0 = \beta^* \left[ \frac{1}{f} + \frac{\eta_1 (1 - p)\sigma_1}{fg} + \frac{\eta_2 p \sigma_2}{fh} + \frac{\eta_3 (g \rho \theta p \sigma_2 + (1 - p)hk\sigma_1)}{fghq} \right].\] (5)
The basic reproduction number, \(R_0\), is the sum of reproduction numbers contributed by the infected populations, I, \(I_{NT}\), \(I_J\), H. It is represented by \(R_0 = R_1 + R_2 + R_3 + R_4\) where
\[R_{1} = \frac{\beta^{*}}{f}, \quad R_{2} = \frac{\beta^{*}\eta_{1}(1-p)\sigma_{1}}{fg}, \quad R_{3} = \frac{\beta^{*}\eta_{2}p\sigma_{2}}{fh}, \quad R_{4} = \frac{\beta^{*}\eta_{3}(g\rho\theta p\sigma_{2} + (1-p)hk\sigma_{1})}{fghq}.\]
Epidemiological Interpretation of R<sub>0</sub>
- \(R_1\) is the reproduction number for the Infected population, I(t) with mean time, \(\frac{1}{f}\), that have contact with susceptible population, S(t) at a rate, \(\beta^*\).
- \(R_2\) is the reproduction number for \(I_{NT}(t)\) population. It means that out of the infected individuals in I(t) with mean time, \(\frac{1}{f}\), a proportion (1-p) of them miss mass testing at a rate, \(\sigma_1\) and move to \(I_{NT}(t)\) where they spend \(\frac{1}{g}\) average time. Individuals in \(I_{NT}(t)\) population have contact with S(t) population at a rate, \(\beta^*\eta_1\).
- \(R_3\) is the reproduction numbers for \(I_J(t)\) population. It implies that a proportion, p of I(t) population with mean time, \(\frac{1}{f}\), participates in the mass testing at a rate, \(\gamma_2\) and progress to \(I_J(t)\) population of mean time, \(\frac{1}{h}\). Individuals in \(I_J(t)\) population have contact with S(t) population at a rate, \(\beta^*\eta_2\).
- \(R_4\) is the reproduction number for H(t) population. Its contribution comes from both \(I_{NT}(t)\) and \(I_J(t)\) populations. \(\frac{(1-p)k\sigma_1}{fgq}\) is for the infected population that miss mass testing, \(I_{NT}(t)\) and \(\frac{\rho\theta p\sigma_2}{fhq}\) is for the isolated population, \(I_J(t)\). The quantities \(\frac{(1-p)\sigma_1}{fg}\) and \(\frac{p\sigma_2}{fh}\) are already interpret in \(R_2\) and \(R_3\) respectively. \(\frac{(1-p)\sigma_1}{fg}\) individuals from \(I_{NT}(t)\) population become hospitalized at a rate, k, while \(\frac{p\sigma_2}{fh}\) individuals from \(I_J(t)\) population become hospitalized at a rate, \(\theta\) with the probability, \(\rho\), of developing symptoms. Both populations, \(I_{NT}(t)\) and \(I_J(t)\) spend a mean time of \(\frac{1}{q}\) in H(t) population where they have contact with susceptible population, S(t) at a rate, \(\beta^*\eta_3\).
3.3. Stability Analysis of the Disease-free Equilibrium
Theorem 3. The disease-free equilibrium, \(E_0\), of the system (3) is locally and globally asymptomatically stable whenever \(R_0 < 1\) and unstable if \(R_0 > 1\).
Proof: By Theorem 3 in [15] of next-generation method, It is certain that disease-free equilibrium, \(E_0\), is locally asymptomatically stable when \(R_0 < 1\) and unstable for \(R_0 > 1\).
For global stability, we apply the method of matrix-theoretic by Shuai and Van den Driessche [16] to construct a Lyapunov function given by
\[L = \left[\frac{1}{f} + \frac{\eta_1(1-p)\sigma_1}{fg} + \frac{\eta_2p\sigma_2}{fh} + \frac{\eta_3(g\rho\theta p\sigma_2 + (1-p)hk\sigma_1)}{fghq}\right](E+I) + \left[\frac{\eta_1}{g} + \frac{\eta_3k}{gq}\right]I_{NT} + \left[\frac{\eta_2}{h} + \frac{\eta_3\rho\theta}{hq}\right]I_J + \frac{\eta_3}{q}H.\]
Taking the derivative of L with respect to time, t, yields
\[\begin{split} L' &= \Big[\frac{1}{f} + \frac{\eta_1(1-p)\sigma_1}{fg} + \frac{\eta_2p\sigma_2}{fh} + \frac{\eta_3(g\rho\theta p\sigma_2 + (1-p)hk\sigma_1)}{fghq}\Big](E'+I') + \Big[\frac{\eta_1}{g} + \frac{\eta_3k}{gq}\Big]I'_{NT} \\ &+ \Big[\frac{\eta_2}{h} + \frac{\eta_3\rho\theta}{hq}\Big]I'_{J} + \frac{\eta_3}{q}H', \end{split}\] when simplifies along the trajectory of the system (3) to give
\[L' = \left[ \frac{1}{f} + \frac{\eta_1 (1 - p)\sigma_1}{fg} + \frac{\eta_2 p \sigma_2}{fh} + \frac{\eta_3 (g\rho\theta p \sigma_2 + (1 - p)hk\sigma_1)}{fghq} \right] (\lambda S - \tau E + \tau E - fI)\] \[+ \left[ \frac{\eta_1}{g} + \frac{\eta_3 k}{gq} \right] \left( (1 - p)\sigma_1 I - gI_{NT} \right) + \left[ \frac{\eta_2}{h} + \frac{\eta_3 \rho \theta}{hq} \right] (p\sigma_2 I - hI_J)\] \[+ \frac{\eta_3}{q} (kI_{NT} + \rho\theta I_J - qH). \tag{6}\]
Expanding Eq.(6) and simplifying with the definition of \(\lambda\) in Eq. (2) yields
\[L' = \left[ \frac{1}{f} + \frac{\eta_1(1-p)\sigma_1}{fg} + \frac{\eta_2 p \sigma_2}{fh} + \frac{\eta_3(g\rho\theta p \sigma_2 + (1-p)hk\sigma_1)}{fghq} \right] \frac{(1-\alpha)\beta(I+\eta_1 I_{NT} + \eta_2 I_J(t) + \eta_3 H)S}{N} - \left( I + \eta_1 I_{NT} + \eta_2 I_J + \eta_3 H \right).\]
With the definition of \(R_0\) of Eq. (5), we have
\[L' = \left(\frac{(R_0(I + \eta_1 I_{NT} + \eta_2 I_J(t) + \eta_3 H)S}{N} - \left(I + \eta_1 I_{NT} \eta_2 I_J + \eta_3 H\right)\right)\]\[= \left(\frac{R_0 S}{N} - 1\right) \left(I + \eta_1 I_{NT} + \eta_2 I_J + \eta_3 H\right).\]
Using the condition that \(\frac{S}{N} \leq 1\), it follows that
\[L' \le (R_0 - 1) \Big( I + \eta_1 I_{NT} + \eta_2 I_J + \eta_3 H \Big).\]
Hence, \(L' \leq 0\) if \(R_0 \leq 1\) and L' = 0 when \(E(t) = I(t) = I_J(t) = I_{NT}(t) = H(t) = 0\). This shows that the only invariant set is the singleton \(\{E_0\}\). Thus, by LaSalle's invariance principle, \(E_0\) is globally asymptotically stable in D when \(R_0 \leq 1\). This completes the proof.
4. NUMERICAL SIMULATION
Nigeria COVID-19 cases started with an imported case of a 44-year-old Italian citizen who arrived in Nigeria on 24th February 2020. He presented himself to the staff clinic of his company in Ogun state on 26th February 2020 and later confirmed as the first official case of COVID-19 in Nigeria on 27th February 2020. Cumulatively, five cases were confirmed from 27th February 2020 to 18th March 2020. From 19th March 2020 to 7th June 2020, the Nigeria COVID-19 cases have risen to a five-digit number of 12,801 cumulative cases [17]. On 22nd March 2020, Nigeria recorded the first death of COVID-19. The first one hundred days of daily confirmed cases of Nigeria COVID-19 with their dates are displayed graphically in Figure 2(a). The COVID-19 model (3) is fit to Nigeria cumulative cases of the first one hundred days and this is shown in Figure 2(b). The least square method that is embedded in MatLab is used to estimate the parameter values in Table 2 and Figure 2(b). Some of the parameter values in Table 2 are from the literature [3], [8] while some are estimated from the Figure 2(b). The main focus of this work is to show how mass testing and intervention measures will help in curtailing the spread of COVID-19 in Nigeria using the values of the parameters in Table 2. The intervention measures are face masking and social distancing. These intervention measures are already put in place by the Nigerian government. The parameter values used for the rest of the simulations in this work are in Table 2 except where it is stated otherwise.
| Parameter | Value | Source | Parameter | Value | Source |
|---|---|---|---|---|---|
| β | 0.437 | [8] | \(\gamma_1\) | 1/7 day-1 | [8] |
| \(\eta_1\) | 0.2 | Estimated | \(\gamma_2\) | \(1/7 day^{-1}\) | [8] |
| \(\eta_2\) | 0.1 | [3] | \(\gamma_3\) | \(1/14 day^{-1}\) | [8] |
| \(\eta_3\) | 0.1 | [3] | \(\lambda_1\) | \(0.043 day^{-1}\) | [8] |
| \(\tau\) | \(1/5.1 day^{-1}\) | [8] | \(\lambda_2\) | \(0.0103 day^{-1}\) | Fitted |
| \(\sigma_2\) | \(0.061 \mathrm{day}^{-1}\) | Fitted | \(\theta\) | \(0.08 day^{-1}\) | [8] |
| \(\alpha\) | 0.5 | Fitted | \(\rho\) | 0.01 | Fitted |
| \(\sigma_1\) | \(0.231 day^{-1}\) | Fitted | p | 0.1 | Fitted |
Table 2: Parameter values of the Model
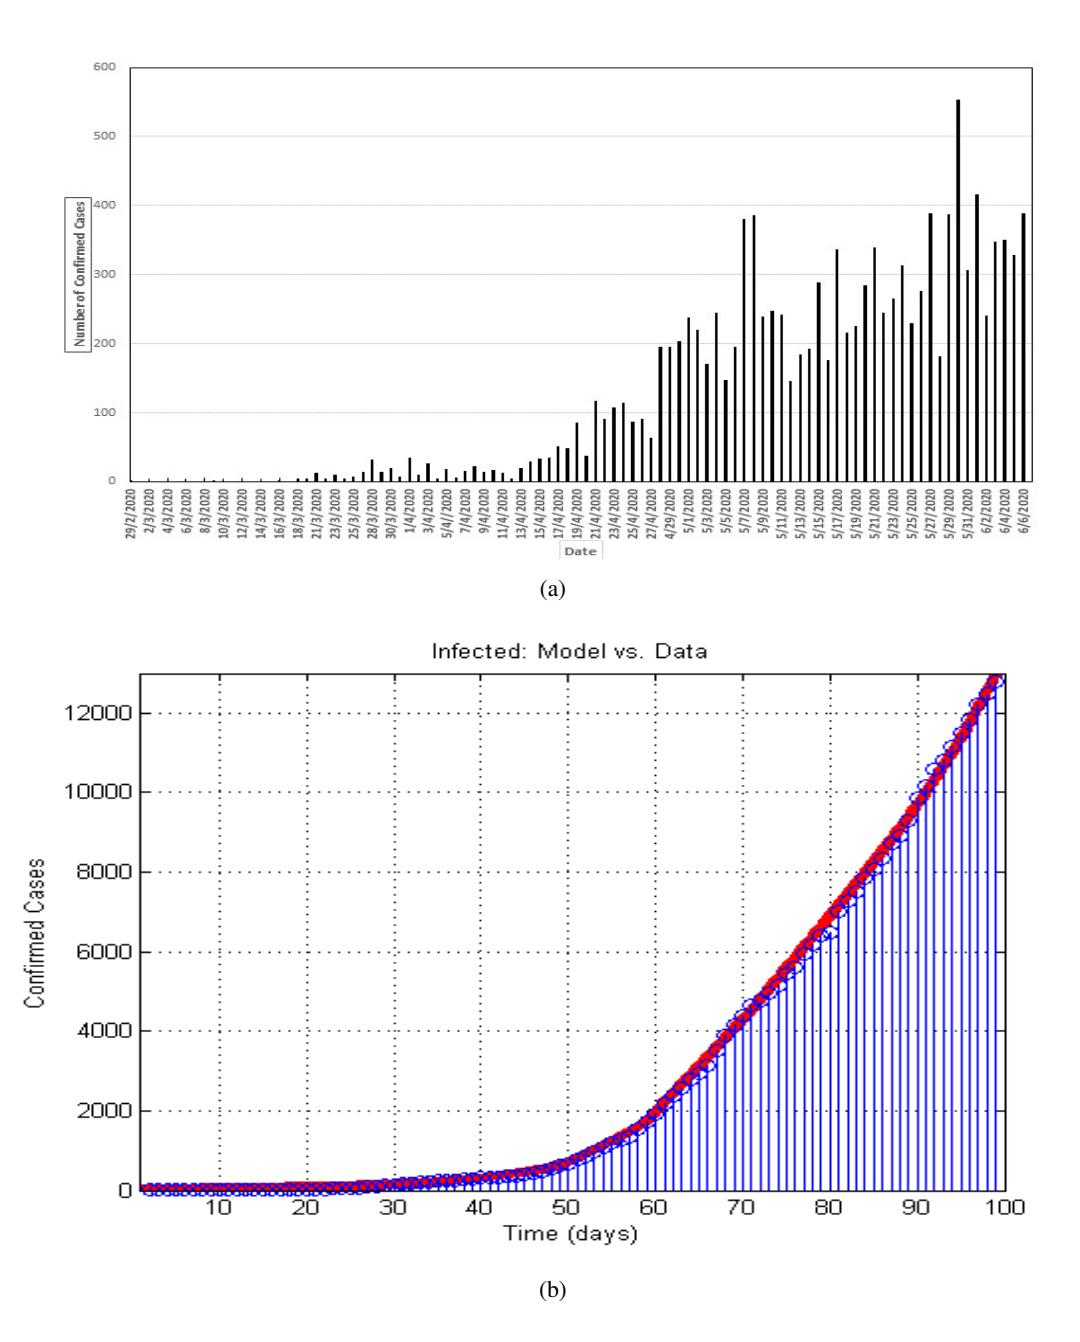
Figure 2: Plot displaying (a) the first one hundred daily cases of COVID-19 (b) the first one hundred days cumulative confirmed cases with COVID-19 model of equation (3).
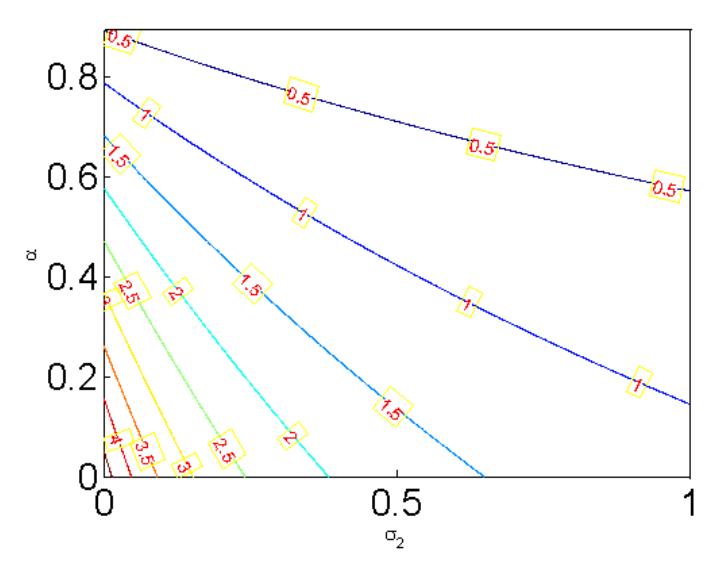
Figure 3: Contour Plot for the basic reproduction number, (R0), of the COVID-19 model as a function of mass testing (σ2) and intervention measures, (α).
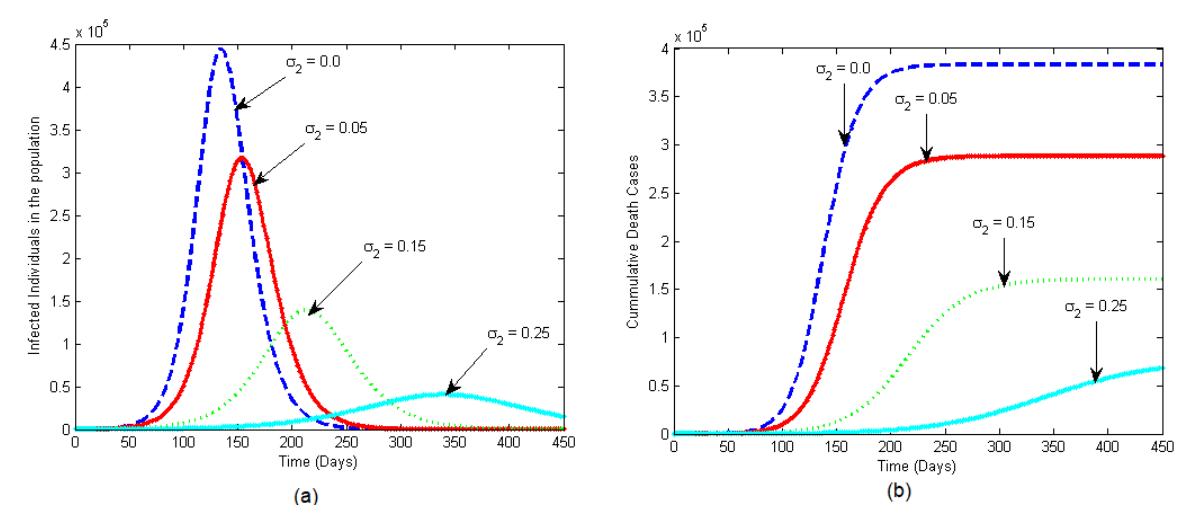
Figure 4: Simulation solution of the COVID-19 model of equation (3) when testing rate, σ2, is increasing in the presence of compliance of intervention measures, α = 50% for (a) the infected individuals in the population and (b) cumulative death cases.
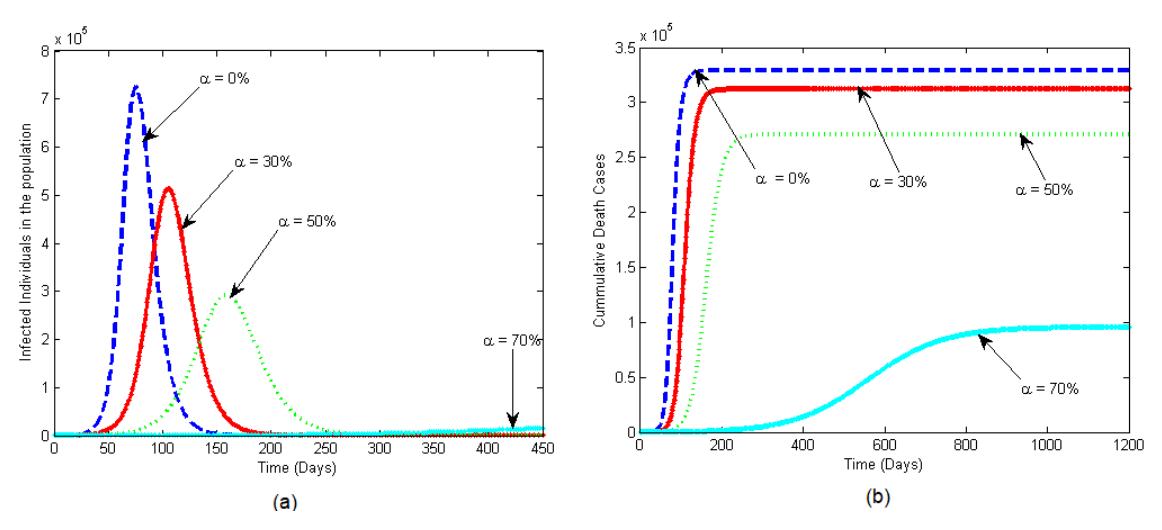
Figure 5: Simulation solution of the COVID-19 model of equation (3) when the compliance of intervention measures, α, is increasing with testing rate, σ2 = 0.061 for (a) the infected individuals in the population and (b) cumulative death cases.
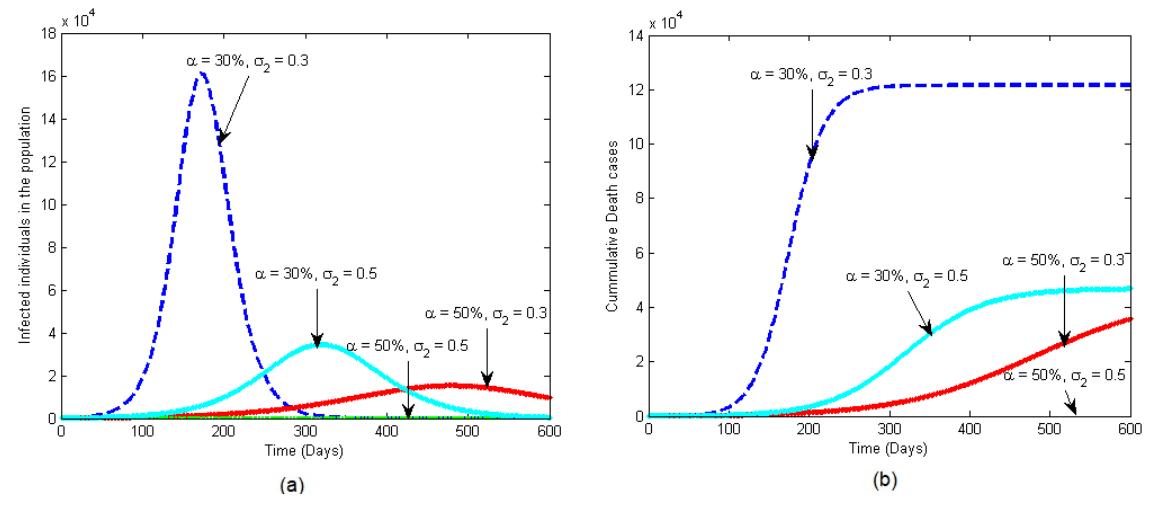
Figure 6: Simulation solution of the COVID-19 model of equation (3) when both the testing rate, σ2, and the compliance of intervention measures, α, are increasing for (a) the infected individuals in the population and (b) cumulative death cases.
5. DISCUSSION
For the ease of understanding, we define intervention measures (face mask and social distancing) compliance as follows: i. Poor compliance: < 50% ; ii. Moderate compliance: 50% ≤ α < 70% ; iii. Strict compliance: α ≥ 70%. Similarly, we define the testing rate as follows: i. Poor testing rate: σ2 < 0.5; ii. Moderate testing rate: 0.5 ≤ σ2 < 0.7; iii. High testing rate: σ2 ≥ 0.7. Using the parameter values in Table 2, the basic reproduction number (R0) for Nigeria is 1.916. This is obtained when the compliance of intervention measures is moderate (α = 50%) and the testing rate is poor (σ2 = 0.061). In Figure 3, the numbers in the square boxes are the basic reproduction number values which occur at the intersection of intervention measures, α, and the testing rate, σ2. The compliance with intervention measures is represented on the y-axis while the testing rate is on the x-axis. The basic reproduction number is greater than unity when the compliance with intervention measures is poor (α < 50%) and the testing rate is high (σ2 ≥ 0.7). However, the basic reproduction number is less than unity (R0 < 1) when the compliance with intervention measures is moderate (50% ≤ α < 70%) and the testing rate is also moderate (0.5 ≤ σ2 < 0.7) or when the compliance with intervention measures is strict (α = 70%) and the testing rate is poor (σ2 = 0.3). This implies that Nigeria will be able to halt the spread of COVID-19 under these two conditions. On the other hand, poor intervention measures compliance and the high testing rate will not keep the R0 less than unity rather it is moderate intervention measures and moderate testing rate that is needed to bring R0 less than unity. Therefore, it will be easier to enforce strict compliance of intervention measures in the presence of poor testing rate. This poor testing rate can be caused by the limited availability of testing facilities and manpower in the population which is common in Africa countries and Nigeria is included.
We observed in Figures 4(a) that when the compliance with intervention measures is moderate, the number of infected individuals in the population reduces as the testing rate increases. Also, in Figure 5(a), when the testing rate is poor (σ2 = 0.061), the number of infected individuals in the population reduces as the intervention measures compliance increases.
Increasing both intervention measures reduce the number of infected individuals that could have died of COVID-19 in the country (see Figure 4(b) and 5(b)). This is expected as the infected individuals who may have contacted the virus will start treatment immediately especially the isolated asymptomatic infected individuals that have a high probability of early treatment when they develop symptoms. Death may be averted with the early commencement of proper treatment.
Figure 6(a) estimate the number of persons that will be infected when the intervention measures and the testing rates are compared at different values. For instance, when the compliance with intervention measures is poor and the testing rate is poor (σ2 = 0.3), 160,900 persons will be infected in the population. Similarly, when the compliance with intervention measures is poor and the testing rate is moderate (σ2 = 0.5), 34,460 persons will be infected. When the compliance with intervention measures is moderate and the testing rate is poor (σ2 = 0.3), 14,830 persons will also be infected. These conditions support our earlier observation that the basic reproduction number is greater than unity when the compliance with intervention measures is poor (α < 50%) and the testing rate is high (σ2 ≥ 0.7). This implies that COVID-19 will remain in the population unless there is an additional intervention such as vaccination.
However, when the compliance with intervention measures is moderate and the testing rate is moderate, about 168 persons will be infected in the population. Also, when the compliance with intervention measures is strict and the testing rate is poor (σ2 = 0.3), it will result in 151 persons being infected. Any of the two scenarios will keep the basic reproduction number less than unity which implies that the chance of an infected person transmitting the infection to another person is very unlikely. These will reduce the spread of COVID-19 in Nigeria. This is similar to the finding by Okuonghae and Omame [10] who reported that the case detection rate of 0.8 per day with 55% of social distancing will eradicate COVID-19 in Lagos State Nigeria. It is also supported by the work of Iboi et al. [8] who reported that COVID-19 can be eliminated in Nigeria if social distancing and face mask compliance were at least moderate. Furthermore, Figure 6b showed that the number of dead persons will be reduced regardless of the various intervention measures compliance and testing rate combinations.
6. CONCLUSION
A deterministic model for the impact of mass testing and interventional measures on the transmission dynamics of COVID-19 in Nigeria is formulated in this study. Mathematical analysis such as boundedness of the solutions, basic reproduction number and stability analysis of disease-free equilibrium are carried out in this study. The analysis shows that the disease-free equilibrium is locally and globally asymptotically stable whenever basic reproduction number is less than unity. Furthermore, the model is calibrated using the cumulative data for the first one hundred days of COVID-19 in Nigeria in order to estimate the parameter values of the model. It was found out that either poor testing rate and strict compliance with social distancing and wearing of face masks or moderate testing rate and moderate compliance with social distancing and wearing of face masks will keep the basic reproduction number less than unity. Based on limited testing facilities and lack of man-power, it will be easier to achieve strict compliance with social distancing and wearing of face masks even under the existing poor testing rate in Nigeria for COVID-19 to be eradicated in the population. This is the most realistic and pragmatic option with the potential to flatten the epidemiological curve of COVID-19 in Nigeria. Therefore, COVID-19 can be eradicated if the Nigerian governments (Federal and States) will implement strict social distancing, wearing of face masks and testing rate of at least 0.3 per day. Implementation of social distancing and wearing of face masks can be achieved through educating the citizens, traditional rulers and religious leaders about the importance of social distancing and wearing of face masks by public health experts and enforcement of compliance by the security agencies.